Munich Personal RePEc Archive
To be or not to be informal?: A
Structural Simulation
Vargas, Jose P Mauricio
Fundacion ARU
18 May 2012
Online at
https://mpra.ub.uni-muenchen.de/41290/
To be or not to be informal?: A Structural Simulation
José P. Mauricio Vargas ARU Foundation
May 18, 2012
Abstract
The paper presents estimations of the informal economy size in Bolivia from an application of a Dynamic General Equilibrium Model. The parameter esti-mation is performed using maximum likelihood method to obtain, as an inter-mediate result, a latent variable estimation of the informal economy size. This procedure is new, as the estimate of the size of the informal economy using a dynamic structural model represents an alternative study area to latent variable models which assume relationships without a strong support in theory (MIMIC models).
The results suggest that the size of the informal economy represents 60% of Bolivian GDP in 2010 and that the trend has been decreasing in the last decade. In addition, we simulated four alternative policies to reduce the size of the underground economy. Some of them allow to identify surprising response mechanisms which allows to analyze the ‡ow of workers from the informal sector into the formal sector and vice versa.
The research, besides quantifying the informal economy size, tries to provide a tool and methodology for evaluating alternative policy scenarios related to …scal policy and labor mobility in a framework of an economy with a large informal sector and evasion.
Key Words: Informal Economy, Kalman …lter, Structural Model.
JEL Classi…cation: C61, E26, E62, O43
Comments are welcome tojpvargas@fen.uchile.cl. I thank Cecilia Salas and Carola Tito for
1
Introduction
Measuring informal economy size has attracted considerable interest in recent decades1,
specially in developing countries2. However, measuring size of informal sector in the
economy is not an easy task. One of the main challenges is the lack of a clear de…ni-tion for informal economy. A wide range of similar terms are used in the literature, as illegal, underground, unreported economy and so on. In addition, designation is just the …rst issue on informality. There are also large di¤erences in determining which should be considered as informal sector activities, estimation processes and usage of results for making economic analysis and taking public policy decissions. Because of these di¢culties and despite its importance "...we are still far from the time when the results of studies of the underground economy can have immediate consequences for policy or for the adjustment of various macroeconomic variables" (Tanzi, 1999). This study seeks to promote new research in order to overcome these problems.
Growing informal activity around the world is an underlying concern (Schneider and Enste, 2000), because -so far- it has not been possible to obtain a consensus about how to measure it. Thus any attempt to measure informal economy is complicated, mainly because activities that make up the informal economy seek to avoid o¢cial registration.
In this context, and given the large magnitude that informal economy size repre-sents in Bolivia3 it is necessary to promote the economic study of this phenomenon
in order to suggest alternative economic policies. Following this objective, and focus-ing on quantifyfocus-ing and proposfocus-ing policy alternatives for the size of the underground economy in Bolivia, this document is organized as follows: the second section reviews the de…nitions and estimations methods of informal economy size identi…ed in the literature, third section brie‡y describes behavior of informal economy in Bolivia, section 4 details the strategy proposed to obtain an alternative measure of informal economy. In section 5 the results related to three policy simulations are presented. Finally, section 6 reviews the major …ndings and conclusions.
1The literature about informal economy received an initial boost in Tanzi (1982).
2Schneider (2005) estimates suggest that the informal economy size in developing countries is
almost twice (as a proportion of GDP) compared to developed countries.
3According to Schneider (2005) the size of the informal sector in the Bolivian economy would
2
De…nition and Estimation Methods of Informal
Econ-omy Size
According to Feige (1996) underground economy includes the following types of ac-tivities4:
Illegal economy, which consists of the outcomes generated by economic activi-ties that involve a violation of legal statutes that de…ne the scope of legitimate forms of commerce.
Undeclared economy, which consists in those legal and illegal economic activi-ties that evade tax rules as stated in the tax laws.
Informal economy, including economic activities that avoid costs and are ex-cluded from bene…ts and rights incorporated in the administrative laws and rules that regulate the relations of property, commercial licensing, labor con-tracts, liability, credit …nancial and social systems.
Alternatively, Portes et al. (1989) de…ne informal economy as the income earn-ing activities that are not regulated by institutions of society, in a legal and social framework in which similar activities are regulated. This document, for measurement purposes, will contain three alternative and not exclusive de…nitions:
Informal economy size is the share of total output produced within productive sector of unregistered economy.
Unreported economy size is the proportion of existing evasion, de…ned as the share of total output that represents the undeclared production of productive registered enterprises.
The employment size in informal sector is the share of all workers who decide to work in underground sector of economy (enterprises not registered or o¢cially recognized).
The following subsections will give an overview of the state of art about existing procedures for estimating informal economy size. These procedures can be catego-rized into three types of methods5:
4An alternative de…nition of underground economy can be found in Cowell (1990). This document
will take informal economy as synonymous of informal underground economy.
5This classi…cation and descriptions closely follow Klinglmair and Schneider (2004). For more
2.1 Direct Approaches
These are mainly composed by microeconomic approaches that use surveys based on voluntary participation and data collection methods based on …scal audits.
The main disadvantage of using surveys is that they present the common failures of this type of processes: accuracy of …ndings and results will depend on response and veracity of participants. The main advantage of using surveys is that they provide detailed information about informal economy structure, allowing to disaggregate the information almost as much as required.
On the other hand, the size of the informal economy might be estimated as the di¤erence between declared incomes for …scal purposes and those measured by audits. The problems facing this methodology is that the use of random audits is equivalent to applying a biased sample of the population. The advantage is that objective data are available (tax returns and …nancial statements).
2.2 Indirect Approaches
The indirect methods try to estimate the informal economy size from the behavior of variables that should re‡ect the existence of underground activities. Next, we identify …ve variants of this type of calculation: i) discrepancies between the measurement of expenditure and income; ii) discrepancies between o¢cial and actual size of the labor force, iii) approximation of transactions; iv) the cash demand approach, and v) the physical input method (approximation of the production by means of electrical consumption behavior).
2.3 Structural Approaches
All methods described so far are designed to estimate the size and development of the informal economy based on a single indicator that would capture its e¤ects.
On the other hand, the structural estimates explicitly consider the use of mul-tiple causes that lead to the existence and growth of informal economy, as well as its multiple e¤ects. The empirical method used is based on the statistical theory of unobserved variables, which considers multiple causes and multiple indicators of the phenomenon to be measured. For estimation, it uses a factor-analytic approach to measure the informal economy as an unobserved variable over time (latent vari-able). The unknown coe¢cients are estimated on a set of structural relationships represented by equations in which the variable can not be measured directly6.
According to the literature, some causes of the underground economy, usually included in MIMIC models, are: i) the burden of direct and indirect taxes both real
6This kind of models, Multiple Indicators and Multiple Causes are known as MIMIC models
as perceived, ii) the burden of regulation as a proxy for other State activities, since it is assumed that an increase in the burden of regulation creates a strong incentive to enter the informal economy (Loayza et al., 2005), and iii) the ‘tax morale’ as the attitudes of citizens towards the State that describes layout of the people to leave their o¢cial occupations and enter informal economy (Torgler and Schneider, 2009; Frey and Torgler, 2007; Güth and Sausgruber, 2004). Among the indicators or e¤ects of the underground economy, researchers typically include: i) the performance of monetary indicators: if activities in the informal economy increases, it requires a further increase in monetary transactions, ii) labor market development, as an increase in the share of workers in the informal sector implies a decrease in their participation in the formal economy, and iii) the production market performance: an increase in the informal economy means that inputs (specially labor) will move from the o¢cial economy (at least in part), causing a shift that could have a depressive e¤ect on the o¢cial growth rate of the economy.
The estimation method we propose and which is detailed in Section 4, is a logical extension of structural models that seeks to add a theoretical background to estimate the size of the informal economy as a latent variable. But previously, the following section contextualizes the behavior of the informal economy in Bolivia, based on information from previous studies.
3
The Informal Economy in Bolivia
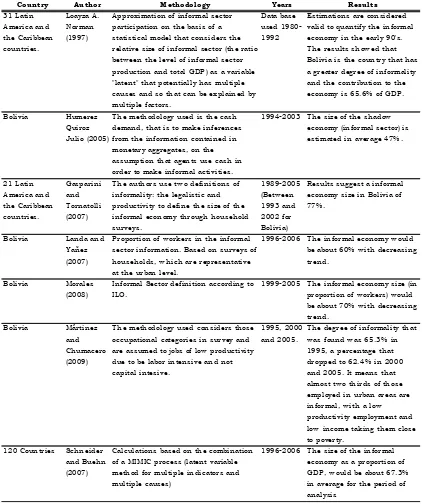
Country Author M ethodol ogy Years Resul ts 31 Latin America and the Caribbean countries. Loayza A. Norman (1997)
Approximation of informal sector
participation on the basis of a
statistical model that considers the relative size of informal sector (the ratio
betw een the level of informal sector
production and total GDP ) as a variable "latent" that potentially has multiple
causes and so that can be explained by
multiple factors.
Data base
used
1980-1992
Estimations are considered
valid to quantify the informal
economy in the early 90's. T he results show ed that
Bolivia is the country that has
a greater degree of informality and the contribution to the
economy is 65.6% of GDP .
Bolivia Humerez
Quiroz
Julio (2005)
T he methodology used is the cash
demand, that is to make inferences
from the information contained in
monetary aggregates, on the assumption that agents use cash in
order to make informal activities.
1994-2003 T he size of the shadow
economy (informal sector) is
estimated in average 47% .
21 Latin America and the Caribbean countries. Gasparini and T ornatolli (2007)
T he authors use tw o definitions of informality: the legalistic and
productivity to define the size of the
informal economy through household
surveys. 1989-2005 (Betw een 1993 and 2002 for Bolivia)
Results suggest a informal economy size in Bolivia of
77% .
Bolivia Landa and
Yañez
(2007)
P roportion of w orkers in the informal
sector information. Based on surveys of
households, w hich are representative at the urban level.
1996-2006 T he informal economy w ould
be about 60% w ith decreasing
trend.
Bolivia Morales
(2008)
Informal Sector definition according to
ILO.
1999-2005 T he informal economy size (in
proportion of w orkers) w ould be about 70% w ith decreasing
trend.
Bolivia Mártinez
and Chumacero
(2009)
T he methodology used considers those
occupational categories in survey and are assumed to jobs of low productivity
due to be labor intensive and not
capital intesive.
1995, 2000
and 2005.
T he degree of informality that
w as found w as 65.3% in 1995, a percentage that
dropped to 62.4% in 2000
and 2005. It means that almost tw o thirds of those
employed in urban areas are
informal, w ith a low productivity employment and
low income taking them close
to poverty.
120 Countries Schneider
and Buehn
(2007)
Calculations based on the combination of a MIMIC process (latent variable
method for multiple indicators and
multiple causes)
1996-2006 T he size of the informal economy as a proportion of
GDP , w ould be about 67.3%
[image:7.612.112.534.128.632.2]in average for the period of analysis
Figure 1 compares the size of the informal economy in Bolivia with averages from other world regions. One element that makes the analysis of informality in Bolivian economy interesting is its magnitude. According to Schneider and Buehn (2007) estimates for the 1999-2006 period, 67.3% of Bolivia’s GDP would be generated by informal activities, which means that among 120 countries, Bolivia occupies the second place (only behind Georgia) among countries with larger informal economies. According to these data, the informal economy, measured as a share of o¢cial GDP, has a slight upward trend in Bolivia in the recent years.
Figure 1. Estimated size of Economy in Bolivia and other groups of countries. (Source: Schneider and
Buehn, 2007)
Figure 2. Estimated Size of the Urban Informal Economy in Bolivia (Source: Landa and Yañez,
2007)
The results of the estimations compiled in this section coincide that the size of the informal economy is non-negligible. Furthermore, a common factor in the mentioned researches, is that they primarily focus on estimating or characterizing the informal economy size; the estimation method we propose in next section, has the virtue that, in addition to providing a new series of the size of the informal economy, seeks to promote the study of the underlying mechanisms from a structural scope.
4
The Estimation Method
of the structural model Loayza (1997). This approach is methodologically similar to the one we propose; however, it arises from a non-uni…ed structural model.
Within the model we propose it is possible to consider the size of the informal economy for at least three de…nitions or components: i) the proportion of unreported income by o¢cially registered businesses (evasion), ii) the proportion of output that is generated by companies that are not registered by the government, and iii) the proportion of workers who choose to work in the informal sector.
The model is composed by three actors: government, households and …rms7.
It includes various events that promote and - under some conditions - ensure the co-existence of an informal sector with the formal sector. Thus, agents are able to evade taxes, meaning evasion for underreporting of income, but can also avoid the full payment of such taxes by producing from the informal sector. The two possibilities are not mutually exclusive, in fact the model allows both: i) a …rm which chooses to produce some share in the informal sector, and ii) evade taxes related with its formal sector production.
Firms face the likelihood to be detected by the government, both in the case of tax evasion as in the case of producing in the informal sector. In the case of detection, they face …nes (penalties) that apply on the amount of the omitted tax. Probabilities and …nes may be the same or di¤erent for the two types of infringement. Besides, we include a mechanism where detection probabilities are endogenous, and depend on a regulatory quality indicator of the activities of government, holding the line of …ndings of Loayza et al. (2005). Endogeneity is supported because regulatory quality is a¤ected by a proportion of government spending used to improve it.
The model depends on a set of parameters that need to be de…ned so that it is a good representation of the Bolivian economy. There is much literature regarding the better strategy to de…ne these parameters, which highlights an important distinction between calibration and estimation processes (Cooley 1997, Hansen and Heckman 1996; Gomme and Rupert 2005; and Dejong and Dave 2007). In this paper we choose the parameter estimation by the method of maximum likelihood.
The maximum likelihood estimation is based on the resolution of the model -by a …rst order approximation - according to the perturbation method proposed in Schmitt-Grohe and Uribe (2004). Once the model solution is found, it can be ex-pressed as a set of di¤erence equations. Then the system of di¤erence equations is assigned to a vector of observable variables known as measurement equations. The measurement equations system is then used in the Kalman …lter to construct like-lihood functions under the assumption of normality of error terms. An important intermediate output of the Kalman …lter is observed and unobserved smoothed ables generated in the estimation process, which are, in the case of unobserved vari-ables, latent variable estimations8, including the variable that identi…es the informal
7Model details are in Apendix A.
economy size9. The application of the proposed method, whose results are described in the next section, was performed using Dynare v.4.2.1 (a Matlab Toolbox).
5
Results
In the following we describe the main …ndings and policy exercises supported by the method of the preceding section. As mentioned above, the …rst step is to estimate the model parameters so that it could be considered a good approximation of the Bolivian economy. The model includes 32 parameters to determine, since this large number of parameters leads to di¢culties for joint estimation, we used a block esti-mation strategy, in such a way to …nd areas where the log-likelihood function is well behaved. We included …ve observable variables on the estimation process: the o¢cial GDP, government spending, investment, consumption, and the index of regulatory quality. The former four were obtained from national accounts in Bolivia, while the latter corresponds to the Governance Matters project (World Bank). The estimated parameters are summarized in Table 2.
Parameter Value Parameter Value Parameter Value
A 0.98 s 1.27 ! 0.1
B 1.12 t 1.4 q -0.24 0.36 T1 -17 1 0.99
0.07 T2 45 2 0.99
F 0.24 T3 -5.1 q 0.99
L 0.16 T4 1 e1 0.04
2.28 W1 0.01 e2 0.03
2 W2 1 e3 0.39
h 0.7 ' 0.29 e4 0.03
0.99 0.83 e5 0.02
[image:11.612.143.486.358.533.2]0.57 H 2
Table 2. Estimated Parameters for the model
It is important to notice that a subset of variables ( ; H) were not estimated, but taken from the literature and/or …xed to reasonable values because it was not possible to build a well-behaved likelihood function for them. In general, the other estimated parameters are within the ranges suggested by the theory and highlight elements that deserve further analysis: the underground sector technology would be higher than the o¢cial sector (B > A); the penalty for evading in the formal sector is lower than the penalty for being found producing in the underground sector
9Further details about method of solution can be found in Dejong and Dave (2007), Canova
(s < t); the probability of being detected evading in the formal sector is highly sensitive to regulatory quality, while the probability of detection when producing in the underground sector, is not so sensitive to regulatory quality(T2 > W2); the share
of government spending representing a positive externality for the formal sector is higher than the share which represents a positive externality for the underground sector ( > '). Except for the …rst one, these results are intuitive according to the evidence and current tax laws.
The parameters in Table 2 are consistent with the following values of the variables in steady-state:
Variable Steady-State Value
y 1
c=y 0.46
g=y 0.28
i=y 0.25
yO=y 0.34
yU=y 0.66
0.33 0.75
p 0.48
o 0.61
[image:12.612.236.390.249.421.2]q 0.46
Table 3. Steady-State of the Model
Above results are quite consistent with other authors’ estimations described in the previous section. At steady-state, the informal economy size represent 66% of the o¢cial product (yU=y), about 67% of workers who belong or have activities in the
Figure 3. Estimated Size of the Informal Economy in Bolivia
Year yU=y
1996 66:0
1997 66:3
1998 67:3
1999 64:9
2000 64:3
2001 62:0
2002 62:2
2003 61:0
2004 61:5
2005 61:1
2006 61:1
2007 60:4
2008 60:4
2009 60:2
2010 59:6
Table 4. Size of the Informal Economy
Previous calculation of the informal economy size follows the same procedure as in Loayza (1997). To transform a time series from a latent variable (with relative scale) to a time series with absolute scale we must …x two points: the …rst is the estimation of informal employment of Landa and Yañez (2007) for 1996, and the second - to adjust the distance between ranks - is the data of informality for 2006 from the same source. Since Landa and Yañez (2007) use an employment approach to measure the size of informal economy, we performed a scale adjustment in order to get a measure of informality as the share of GDP.
[image:13.612.276.350.291.520.2]which is reinforced by negative shocks in technology in the underground economy10, and a decline in regulatory quality. The mechanism under which a reduction in regulatory quality can increase the size of the o¢cial sector, according to the model, is as follows: a diminution in the regulatory quality decreases the detection probability of evasion, so that agents …nd out that tax burden within the o¢cial sector is lower, and therefore reduce their incentives to move to underground economy.
In the following subsection we introduce four alternative scenarios of economic policy experiments; they aim to reduce the informal economy size, without increasing formal sector productivity.
5.1 Four Scenarios for Policy Making
[image:14.612.117.506.376.466.2]We raise four alternative strategies that an economic policy maker might propose to reduce the informal economy size, namely: i) increase the penalties to evade capture in the formal sector, ii) increase the penalties to be caught working in the under-ground sector, iii) increase government regulatory quality (or reduce corruption), and iv) policies ii) and iii), jointly.
Table 5 summarizes the main …ndings:
Variable Baseline Scenario Scenarios of Policy
i) +s ii) +t iii) +q iv) +t^ +q
yU=y 0:66 + +
yO=y 0:34 + +
1 0:24 +
0:33 + +
Table 5. E¤ects of four alternative policies on the size of the informal economy
With regard to the …rst policy option, it seems surprising that increasing the penalty to formal sector workers who evade, decreases the size of the formal sector boosting the agents to work in the informal sector. The transmission mechanism is as follows: evasion becomes more expensive due to increased penalties, so the agents must face a higher tax burden (evading less), but higher tax burden boost to leave the formal sector and move to underground sector.
On the other hand It seems clear that, from the point of view of e¤ectiveness, increasing penalties to agents working in the informal sector (second policy alterna-tive) might be a better choice. Thus, the second policy scenario in Table 5, which suggests increasing the penalty in the underground sector, appears to reach desirable results in order to reduce the size of the informal economy. In fact, the increment in
t increases expected costs of producing in the underground sector, so the option to operate in the formal sector marginally becomes more attractive.
The third policy experiment, focused on increasing regulatory quality provided by government (variable highly correlated with control of corruption and government e¤ectiveness index11) presents similar results to those of the …rst experiment. The
increase in regulatory quality, per se, is not an e¤ective policy, since it leads to increase capture probability in the formal sector (more than in the informal sector), this implies that it becomes more costly to evade (in fact the policy reduces the levels of evasion 1 ), so agents move to the informal sector because they face a heavier tax burden in the formal sector.
Finally, we simulate a combined policy, under which the increase in regulatory quality can be combined with an increase in the penalties imposed when an agents are caught producing in the informal sector. This fourth scenario, is highly e¤ective in reducing the informal economy size ( (yU=y)), displacing workers and capital
into the formal sector( + ) and decreasing the evasion levels( (1 )).
[image:15.612.144.481.331.495.2]The sensitivity of the main variables to the …rst three policy proposals outlined can be inferred from the following graphs12.
Figure 4. Changes in the penalties for evasion in the formal sector
Figure 4 corroborates results of case i) (Table 5). That is to say, an increase in penalties for evading implies, at …rst glance counterintuitively, an increase in the informal sector of the economy. When increasing the size of the penalties in the formal sector, from 1:27 (27% of e¤ective …ne) to about2 (100% e¤ective penalty), the size of the formal sector (yO) and the proportion of its workers ("mu"or ) are
reduced by almost 20%, the informal sector expands in 8% and the proportion of income reported by companies to the Tax Agency ("xi"or ) are increased by 15%, therefore decreasing evasion (1 ) in the same amount.
1 1The correlation between regulatory quality and government e¤ectiveness is 0.93 (using World
Bank Governance Matters series).
1 2In Figures 4, 5 and 6, the vertical axis is adjusted so that the value of 1 corresponds to
Figure 5. Changes in the penalties for producing in informal sector.
The sensitivity analysis of the second policy (case ii) in Table 3) is shown in Figure 5. The estimated value of e¤ective penalties in the baseline scenario ist= 1:4
(i.e. 40%of …nes over unrecorded production value). If, as in the previous case, the penalty increases to reach 100% of …nes, that is to say t = 2, the model suggests that the size of the formal economy, and the proportion of workers in the formal sector would increase just over 120%, the size of the informal economy (yU) would
[image:16.612.144.483.601.676.2]Figure 6. Changes in regulatory quality
Finally, Figure 6 shows the sensitivity analysis of a policy aimed at increasing regulatory quality. To simulate this policy, we assume a positive shock on the au-tonomous regulatory quality level (variable q in equation A.12 in Annex A). The increase in q would be re‡ected in an increase in regulatory quality index q, whose value is represented in the horizontal axis of Figure 6 charts. Thus an increase in regulatory quality does not necessarily imply a smaller size of the informal economy, in fact, the increase in regulatory quality implies an increase of the informal econ-omy size and a decrease in the size of the formal econecon-omy. This happens because the increase inqpromotes better control (i.e. increase in probability of detection) in both the formal sector through the detection probability p as in the informal sector through o. Furthermore, the results of the estimation of the model imply that the probability of detection within the formal sector is much more sensitive to regulatory quality that the probability of detection within the informal sector. Therefore, the increase in regulatory quality discourages evasion more than the disincentive to pro-duce in the informal economy. Finally, the decline of evasion increases the e¤ective tax and therefore the tax burden in the formal sector, leading to a transfer of formal sector workers into the informal sector.
To conclude this section it is important to review the results in column iv) of Table 3. In the fourth policy option we propose to increase penalties for informal sector and improve regulatory quality, both at the same time. This policy mix would allow: to promote formal sector size, decreasing the levels of evasion as well, and decrease the size of the informal sector by increasing the relative cost of staying in it. Obviously, this is not the only possible combination, and a thorough analysis of public policy should consider other factors besides the mentioned here.
6
Concluding Remarks
This paper aims to quantify the informal economy size in Bolivia and propose pol-icy alternatives based on the results of a dynamic general equilibrium model. The method used to calculated the size of the informal economy is novel because allows to take advantage of the parameter estimations by maximum likelihood to calcu-late a calcu-latent variable (unobserved) which represents the proportion of output that is generated in the informal sector of the economy.
The model presented in the paper allows to quantify the size of the informal economy in Bolivia from di¤erent de…nitions: as the total output share; as the exist-ing tax evasion in the formal (registered) sector, and; as the proportion of employees working in the informal (unregistered) sector. The results suggest that the size of the informal economy in Bolivia measured as the share of total output of the economy -declined in recent years, which would potentially mean 60% of the total economy in 2010. This decreasing trend follows closely the results of Morales (2008), and Landa and Yañez (2007).
Furthermore, we proposed four policy simulation exercises aimed to reduce the size of the informal economy in Bolivia: i) increasing penalties for tax evaders in the formal sector of the economy ii) increasing the penalties for agents who are producing in the informal sector of economy, iii) increasing government regulatory quality, and iv) combining policies ii) and iii). According to the estimated model parameters, results indicate that not all these policies are desirable and in some cases the results are counterintuitive and would imply increasing the size of the informal economy. In fact, an increase of penalties in the formal sector of economy, and an increase of regulatory quality levels imply an increase in the size of the underground economy. On the other hand, we …nd that a combined policy, where the penalties for those who produce in the informal economy are increased, and regulatory quality is improved, could have desirable e¤ects when trying to reducethe size of the informal sector, and evasion levels.
References
[1] Adjemian, S., Bastani, H., Juillard, M., Mihoubi, F., Perendia, G., Ratto, M., and Villemot, S. Dynare: Reference manual, version 4. Dynare
Working Papers 1, CEPREMAP, 2011.
[2] Arango, C., Misas, M., and López, E. Economía subterránea en colombia
1976-2003: Una medición a partir de la demanda de efectivo. Borradores de Economia 335, Banco de la Republica de Colombia, 2006.
[3] Busato, F., Chiarini, B., and Rey, G. Equilibrium implications of …scal policy with tax evasion. SSRN eLibrary (2006).
[4] Canova, F. Methods for applied macroeconomic research. No. v. 13 in Methods for applied macroeconomic research. Princeton University Press, 2007.
[5] Chen, B.-L.Tax evasion in a model of endogenous growth. Review of Economic Dynamics 6, 2 (April 2003), 381–403.
[6] Cooley, T. F. Calibrated models. Oxford Review of Economic Policy 13, 3 (Autumn 1997), 55–69.
[7] Cowell, F.Cheating the Government: The Economics of Evasion. MIT Press, 1990.
[8] DeJong, D., and Dave, C. Structural macroeconometrics. Princeton Univer-sity Press, 2007.
[9] DeJong, D. N., Ingram, B. F., and Whiteman, C. H. Keynesian impulses
versus solow residuals: identifying sources of business cycle ‡uctuations.Journal of Applied Econometrics 15, 3 (2000), 311–329.
[10] Dell’Anno, R. Stimare l’economia sommersa con un approccio ad equazioni strutturali. un’applicazione all’economia italiana (1962-2000). Dipartimento di Scienze Economiche e Statistiche, Università degli Studi di Salerno, 2001. [11] Feige, E. L. Overseas holdings of u.s. currency and the underground economy.
InExploring the Underground Economy. Kalamazoo, Michigan, pp. 5-62, 1996. [12] Frey, B. S., and Torgler, B. Tax morale and conditional cooperation.
Journal of Comparative Economics 35, 1 (March 2007), 136–159.
[14] Giles, D. Modeling the hidden economy and the tax-gap in new zealand. Tech. rep., Working Paper, Department of Economics, University of Victoria, Canada, 1999.
[15] Giles, D. Measuring the hidden economy: Implications for econometric mod-elling. The Economic Journal , 109/456, pp.370-380, 1999a.
[16] Gomme, P., and Rupert, P.Theory, measurement, and calibration of macro-economic models. Working Paper 0505, Federal Reserve Bank of Cleveland, 2005.
[17] Güth, W., and Sausgruber, R. Tax morale and optimal taxation. Tech. rep., 2004.
[18] Hansen, L. P., and Heckman, J. J.The empirical foundations of calibration.
Journal of Economic Perspectives 10, 1 (Winter 1996), 87–104.
[19] Henley, A., Arabsheibani, G. R., and Carneiro, F. G. On de…ning and
measuring the informal sector. Institute for the Study of Labor (IZA), Nov. 2006.
[20] Hernández, M., and de la Roca, J. Evasión tributaria e informalidad en el perú. Economía y Sociedad 62, CIES, 2006.
[21] Humerez, J. Una estimación del tamaño de la economía informal, un ejercicio para bolivia: 1990-2003, Abril 2005.
[22] Johnson, S., Kaufmann, D., and Zoido-Lobatón, P. Regulatory dis-cretion and the uno¢cial economy. American Economic Review, Vol. 88, pp. 387½U92, 1981.
[23] Karanfil, F., and Ozkaya, A. Estimation of real gdp and unrecorded econ-omy in turkey based on environmental data. Energy Policy 35, 10 (October 2007), 4902–4908.
[24] Landa, F., and Yañez, P. Informe especial: La informalidad en el mercado
laboral urbano 1996-2006. UDAPE, 2007.
[25] Loayza, N.The causes and consequences of informality in peru. Banco Central
de Reserva del Perú, 2007.
[26] Loayza, N. A. The economics of the informal sector : a simple model and
some empirical evidence from latin america. The World Bank, Policy Research Working Paper Series 1727, Feb. 1997.
[28] Macias, J. B. The dynamics of parallel economies. measuring the informal sector in méxico. CaŠ Foscari University, 2008.
[29] Martínez, D. y. C. M. El sector informal urbano en bolivia, 1995-2005, Octubre 2009.
[30] Morales, R. El sector informal en bolivia. re‡exiones teóricas y realidad estadística. Superintendencia de Empresas - Bolivia, 2008.
[31] OIT. Panorama laboral. Organización Internacionald el Trabajo, 2004.
[32] Portes, A., Castells, M., and Benton, L.World underneath: The origins, dynamics, and e¤ects of the informal economy. In The Informal Economy: Studies in Advanced and Less Developed Countries. Johns Hopkins University Press, Baltimore, 1989.
[33] Schmitt-Grohe, S., and Uribe, M. Solving dynamic general equilibrium models using a second-order approximation to the policy function. Journal of Economic Dynamics and Control 28, 4 (January 2004), 755–775.
[34] Schneider, F. Measuring the size and development of the informal
econ-omy. can the causes be found and the obstacles be overcome? In Essays on Economic Psychology. Berlin, Heidelberg, Springer Publishing Company, pp. 193-212., 1994a.
[35] Schneider, F. Can the informal economy be reduced through major tax
re-forms? an empirical investigation for austria. Supplement to Public Finance/ Finances Publiques, 49, pp. 137-152., 1994b.
[36] Schneider, F. The shadow economies of western europe. Journal of the Insti-tute of Economic A¤airs, Vol. 17, pp. 42½U48, 1997.
[37] Schneider, F. Further empirical results of the size of the informal economy of
17 oecd-countries over time. Paper presented at the 54. Congress of the IIPF Cordoba, Argentina and discussion paper, Department of Economics, University of Linz, Linz, Austria, 1998.
[38] Schneider, F. The size and development of the shadow economies of 22
tran-sition and 21 oecd countries. Institute for the Study of Labor, 2002.
[39] Schneider, F. Size and measurement of the informal economy in 110 coun-tries around the world. Workshop of Australian National Tax Centre, ANU, Canberra, Australia., 2002.
[40] Schneider, F. The shadow economy and shadow economy labor force: What
[41] Schneider, F., and Enste, D. H. Shadow economies: Size, causes, and consequences. Journal of Economic Literature, Vol. XXXVIII, 2000.
[42] Schneider, F. G., and Buehn, A. Shadow economies and corruption all over the world: revised estimates for 120 countries. Economics - The Open-Access, Open-Assessment E-Journal 1, 9 (Version) (2007), 1–53.
[43] Tanzi, V. The underground economy in the united states and abroad. Lexing-ton (Mass.), LexingLexing-ton, 1982.
[44] Tanzi, V. The underground economy in the united states, reply to comments by feige, thomas, and zilberfarb. IMF - Sta¤ Papers, 33/ 4, pp. 799-811, 1986. [45] Tanzi, V. Uses and abuses of estimates of the underground economy, June
1999.
[46] Tedds, L. The underground economy in canada. McMaster University, 2005.
[47] Torgler, B., and Schneider, F. The impact of tax morale and institutional quality on the shadow economy. Journal of Economic Psychology 30, 2 (April 2009), 228–245.
A
Model
The model is a slightly modi…ed version of Vargas (2009), which considers a repre-sentative agent model, both for consumption as for production in which taxes are applied on labor and output. The production technology has two sectors:
A legal, formal or registered sector in which it is possible to declare - for …scal purposes - income levels lower than the real. In this sector there might be tax evasion.
An unregistered sector, which evades all taxes on labor and product factor. This sector uses a proportion of all capital and labor available for the …rm. Logically, the speci…cation includes the government sector, which provides public goods and services and determines (in this case exogenously) taxes on labor and production factor. Another important feature of the model is that it includes the e¤ect of regulatory quality / control of corruption on the decision of the agents, by integrating them through endogenous coe¢cients of detection probability that …rms and workers perceive. Regard to consumers, they face a utility function that depends on consumption and leisure.
In the remainder of this section we show model conditions.
A.1 The …rms problem
We assume the following speci…cations to represent the technology of …rms in both sectors, o¢cial and underground13:
yO yO A; kO; lO; g and yU yU A; kU; lU; g (A.1) The above equations consider a positive externality in the production functions of the o¢cial and underground sector, they are generated by government spending as in Barro (1992). Constant returns to scale in the three productive factors are assumed, that is capital, labor and government spending. It is assumed that pro-duction functions have positive and decreasing returns in each factor separately, and also ful…ll the Inada conditions.
The …rm’s income for product sales are equal toy=yO+yU (normalizing prices
to 1); however, taxes must be deducted and/or penalties to which the …rm is subject plus costs for the retributions to productive factors. In this way we calculate pro…t of the …rm.
The government charges a tax on formal output yO according to a percentage
aliquot F. Since the government ignores the actual output of …rms, it is possible
1 3The above indicesO and U represent the o¢cial (formal) and underground (informal) sector,
that they declare only a proportion from its total output, where 0< <1. The government …nds, with a probabilityp;…rms declared <1, and applies in this case a proportional penalty on the tax evaded as well (with s >1).
The …rm’s income also comes from its underground operations yU. We assume
that the company - in underground sector - faces a probability of detection (o) and penalties (t), di¤erent from those within the formal sector. In addition, …rm decides the share of labor that goes to the o¢cial sector and implicitly the share of labor it is assigned to the underground sector. Given these elements, the bene…t function of …rms is:
= (1 E)yO+ (1 o t F)yU w l (r+ ) k (A.2)
where E F( +p s(1 ))and k=kO;(1 ) k=kU; l=lO;(1 ) l= lU; kO+kU =k ylO+lU =l .
Under the assumption of competitive markets, a …rm takes the wage w,r capital income and job level l as given, and maximizes its pro…t by equating the marginal productivity of capital to its rent. That is:
r =yO
k (1 E) +ykU(1 o t F) (A.3)
Given that the assumption of competitive markets should ensure the zero pro…t condition. The salary must equal the marginal product of labor to capital level of equation (A.3). That is:
w = (1 E) y
0 k yO
k + (1 o t F) yU k ykU
l (A.4)
Whereykj represents the marginal productivity of capital in sectorj. In addition, …rms choose to declare a proportion of their income from the condition:
@
@ = 0 (A.5)
Finally, …rms determine the proportion of labor and capital will use with each production technology. This means that the parameters and are determined endogenously. For this, the …rm solves the following conditions:
@ @ = 0
@
@ = 0 (A.6)
In particular, the following functional forms are de…ned for production functions:
yO=A(k ) ( l) ( g)1 (A.7)
Furthermore, we must take into account the following constraints:0< <1;0< < 1;0 < < 1;0 < < 1; + < 1; or < ; ' < 1 and < '. The last inequality re‡ects the intensity of the positive externality of government spending on the production function is lower in the underground sector than in the formal sector. Finally, the relevant probabilities of capturing to the …rm p and o can be con-sidered in terms of regulatory quality q. These assumptions are consistent with the empirical evidence that suggests that the detection probability and statutory penal-ties are not signi…cant to explain the size of the informal economy.
p= 1
1 +e (T1+T2q+T3 +T4 F) (A.9)
o= 1
1 +e (W1+W2q) (A.10)
In addition, the regulatory quality index is bounded in the interval (0;1), where higher values represent better regulatory quality. Besides, regulatory quality would positively depend on a proportion ! of government spending g. The last couple of features are re‡ected in the following speci…cations14:
qt=
1
1 +e (qet) (A.11)
e
qt=qt+H(! gt) (A.12)
The variable qt can be understood as an autonomous level of regulatory quality, and encompass all the elements of regulatory quality which are not directly a¤ected by government spending. It can be understood that this variable is associated with cultural elements such as morality or tax consciousness and acceptance of corruption, for example. Empirically, we consider it as a standardized variable.
A.2 The Problem of households, workers and investors.
Consumers seek to maximize their expect utility (U) which in this case depends on consumption (c) and the valuation of leisure (1 l) discounted by a factor to an in…nite period of time:
maxE0
1 X
t=0
tU(c
t; lt) (A.13)
Households use the income (after taxes) they do not consume to accumulate assets (a), according to the following rule of accumulation that takes into account a tax aliquot L proportional to the wage.
1 4The relative weight of the e¤ect of level of self-regulatory quality and government spending on
at+1 at= (1 L)wt tlt+ (1 o t L)wt(1 t)lt+rt at ct (A.14)
Households seek to maximize their utility derived from discounted ‡ow of con-sumption and labor. According to Bellman Optimality Principle (1957), the problem can be expressed as:
V (at) = maxfU(ct; lt) + E[V (at+1)]g (A.15)
Solving the problem we can …nd the …rst order conditions that maximize the utility from the choice of optimal consumption and employment. These conditions are presented in equations (A.16) and (A.17):
1 =Et
Uc;t+1
Uc;t
(1 +rt+1) (A.16)
1 =Et
Ul;t
Uc;t(1 L)wt t+ (1 o t L)wt(1 t)
(A.17)
Since families are the owners of assets, it is possible to even at = kt in (A.14),
then, including relations in equations (A.3) and (A.4) and the identityyt=ytO+ytU
we can reach the following expression, which is simply the resource constraint of the economy:
kt+1 kt=yt gt kt ct (A.18)
In particular, we de…ne a utility function with a coe¢cient of constant relative risk aversion (CRRA) separable in consumption and leisure (1 l):
U(ct; lt) =
c1t 1
1 +h
(1 lt)1
1 (A.19)
Where h 0 and 1= represents the elasticity of intertemporal substitution of leisure.
A.3 Government Restriction.
The government collects taxes based on output and labor. Furthermore, there are revenues related to the penalties charged when tax evaders or informal producers are caught.
From the behavior of …rms is straightforward to de…ne the revenue from activities within the formal sector as:
Using the identity E F( +p s(1 ))we can express (A.20) as:
RO =YO E+w L L (A.21)
While, when the informal sector is discovered the revenue generated equals to:
RU =o t YU F +o t L (1 ) w L (A.22)
With these de…nitions we can specify a combined budget constraint of the gov-ernment as follows:
YO E +w L L+YU o t F +o t L (1 ) w L (A.23)
max ( ; ') G+! G+ (1 max ( ; ') !)G=G=RO+RU (A.24)
B
Related Studies
The following table is a summary of studies measuring the informal economy using di¤erent methodologies, applied to di¤erent countries and di¤erent periods of time.
Country Author Methodology Años Results
Africa, Asia, LA, Central Europe countries, ex URSS and OECD members
Schneider and Enste (2000)
Calculations based on physical inputs, cash demand and modeling approaches.
Averaga from 1990 to 1993
Measuring informal economy in developing, transition and developed countries.
Portugal Dell’Anno, Roberto (2006)
Multiple Indicators and Multiple Causes Model (MIMIC)
1977 - 2004 Measuring Portugal informal economy and policy recommendations to adopt. Canadá Tedds, Lindsay
(2005)
Multiple Indicators and Multiple Causes Model (MIMIC)
1976 - 2001 MIMIC model application to measure the informal economy in Canada over time.
Perú Hernández, Manuel
and De la Roca, Jorge (2006)
Discrepancies in level of consumption among groups -from underreporting.
2000 Right and proper measurement of informal economy and the share of informal PEA in Peru.
Ex URSS, Central and Eastern Europe
Schneider, Friedrich (2002)
Cash Demand and Model MIMIC approach.
1998 - 1999 and 2001 -2002
Factors that cause an increase in the informal economy.
Italia Dell’Anno, Roberto (2003)
Approach using structural equations and MIMIC model.
1962 - 2000 Utilization of two methodologies to measure informal economy in Italy. Compare and contrast.
145 countries Schneider, Friedrich Direct, indirect and Modelistic methods - depending on the characteristics of each country.
1999 - 2003 The increase in tax rates and social security contributions, combined with the growing labor market regulations, boost growth of the underground economy. LA and the
Caribbean countries
Vuletin, Guillermo (2008)
Utilization of Modelistic approach.
Early 2000 Taxes system Strengthening and regulation, along w ith high inflation and a predominance of agriculture in production, are key factors in measuring informal economy size. México Brambila Macias, Jose
(2008)
Error Correction Model 1970 - 2006 It is found a positive correlation bewteen informal sector and economic grow th in the long-run. Brasil Reza Arabsheibani, G
and Carneiro, Francisco (2006)
Three approaches are used: employment contract registers, social security registers and employee caracterization in Brasil using survey households.