BIROn - Birkbeck Institutional Research Online
Ewing, Louise and Karmiloff-Smith, Annette and Farran, E.K. and Smith,
Marie L. (2017) Developmental changes in the critical information used for
facial expression processing. Cognition 166 , pp. 56-66. ISSN 0010-0277.
Downloaded from:
Usage Guidelines:
Please refer to usage guidelines at or alternatively
Developmental changes in the critical information used for facial expression processing
Louise Ewing1,3,4, Annette Karmiloff-Smith1, Emily K. Farran2 & Marie L. Smith1
1Department of Psychological Sciences, Birkbeck, University of London 2UCL Institute of Education, University College London
3ARC Centre of Excellence in Cognition and its Disorders, School of Psychology, University
of Western Australia
4 School of Psychology, University of East Anglia, Norwich
Submitted to COGNITION
Corresponding author:
Louise Ewing
School of Psychology University of East Anglia
Norwich Research Park, NR4 7TJ [email protected]
Resubmission Date: 12th April 2017
Word count: 6001 (including figure captions)
Abstract
Facial expression recognition skills are known to improve across childhood and adolescence,
but the mechanisms driving the development of these important social abilities remain
unclear. This study investigates directly whether there are qualitative differences in child and
adult processing strategies for these emotional stimuli. With a novel adaptation of the
Bubbles reverse-correlation paradigm (Gosselin & Schyns, 2001), we added noise to
expressive face stimuli and presented sub-sets of randomly sampled information from each
image at different locations and spatial frequency bands across experimental trials. Results
from our large developmental sample: 71 young children (6 –9 years), 69 older children
(10-13 years) and 54 adults, uniquely reveal profiles of strategic information-use for
categorisations of fear, sadness, happiness and anger at all ages. All three groups relied upon
a distinct set of key facial features for each of these expressions, with fine-tuning of this
diagnostic information (features and spatial frequency) observed across developmental time.
Reported variability in the developmental trajectories for different emotional expressions is
consistent with the notion of functional links between the refinement of information-use and
1. Introduction
The ability to interpret emotional signals in faces critically facilitates interpersonal
interactions by helping us understand and respond appropriately to those around us. This
capacity is observable from early infancy, with generalized discrimination of facial
expressions from at least 6-7 months (de Haan & Nelson, 1997; Walker-Andrews, 1997), yet
these early skills are far from adult-like (Widen, 2013). Facial expression recognition abilities
improve across childhood and adolescence (e.g., De Sonneville et al., 2002; Gao & Maurer,
2009; Herba & Phillips, 2004), particularly for complex and subtle expressions (Johnston,
Kaufman, Bajic, & Sercombe, 2011; Thomas, Graham, & LaBar, 2007), with different
developmental trajectories observed for different emotions (e.g., Lawrence, Campbell, &
Skuse, 2015; Rodger, Vizioli, Ouyang, & Caldara, 2015).
The mechanisms driving the development of these abilities remain unclear. As in the
face identification literature, debate continues as to whether improvements in expression
processing reflect broad or face-selective development. Some propose that face-processing
mechanisms are mature qualitatively (and perhaps quantitatively, Crookes & Robbins, 2014)
as young as 3–6 years and any development improvement reflects broader perceptual and
cognitive change, e.g., concentration, spatial attention and meta-memory (Crookes &
McKone, 2009; McKone, Crookes, Jeffery, & Dilks, 2012). Consistent with this account,
hallmarks of specialist face processing are observed in the youngest ages tested, e.g.,
configural/holistic processing (de Heering, Houthuys, & Rossion, 2007; Durand, Gallay,
Seigneuric, Robichon, & Baudouin, 2007), adaptive norm-based coding (Burton, Jeffery,
Skinner, Benton, & Rhodes, 2013; Jeffery et al., 2010). Rival proponents of face-selective
development highlight structural and functional change in brain regions associated with
(Golorai, Liberman, Yoon, & Grill-Spector, 2010; Kanwisher, McDermott, & Chun, 1997;
Lobaugh, Gibson, & Taylor, 2006; Thomas et al., 2001) and EEG variability in neural
sensitivity to emotional expressions in children, adolescents and adults (Batty & Taylor,
2006). Still, finding clear qualitative developmental differences has proven challenging (see
McKone et al., 2012 for a review).
In adults, computational models and empirical studies employing reverse-correlation
approaches have revealed that a complex, distinctive pattern of information-use underlies
facial expression processing (e.g., Dailey, Cottrell, Padgett, & Adolphs, 2002; Susskind,
Littlewort, Bartlett, Movellan, & Anderson, 2007). Correct categorizations of basic facial
expressions are characterised by a critical or ‘diagnostic’ subset of visual information that
differs across emotions (e.g., furrowed brow for anger, wide-open eyes for fear) and may be
optimized to disambiguate these categories (Smith, Cottrell, Gosselin, & Schyns, 2005).
Little is known about the information that children use to categorize facial
expressions and crucially, whether they show the hallmark adult sensitivity to available
information and associated flexibility in information-use across emotions. Refinement of
information-use with age and face experience may account for improved processing ability
by helping children learn to focus on the most reliable cues for their judgments (Johnston et
al., 2011). Preliminary (but contradictory) evidence indeed suggests developmental
differences in information-use. Pollux, Hall, and Guo (2014) reported that adults are more
biased than 8-9 year olds to look at the eye region during a free-viewing expression
categorisation task. However, Karayanidisa, Kellya, Chapmana, Mayes, and Johnston (2009)
reported that the value of the mouth region increased significantly with age for 5–12 year
olds during a ‘feature selection’ style expression-categorisation task. As with adults, it is
lower face) that fail to consider the variable importance of different features for different
emotion categories can fully characterise qualitative changes over developmental time.
Differences in children’s reliance upon information from across the range of spatial
frequencies (SF) could also contribute to their outcomes (relative to adults) on face tasks.
For adults, the mid-band (8-25 cycles per face) provides the optimal information for
judgments of face identity (Costen, Parker, & Craw, 1994, 1996; Näsänen, 1999; Ruiz-Soler
& Beltran, 2006) and expression, although the specific diagnostic spectra may vary with
emotion category (Smith & Schyns, 2009) and task particulars (Smith & Merlusca, 2014). To
our knowledge, only two studies have investigated SF biases in children’s expression
processing, with contrasting results. Deruelle and Fagot (2005) used the hybrid faces
technique to explore how 5-8 year olds and adults extract emotion and gender information
from low- and high-passed faces (no mid-band condition). They revealed that all three groups
relied on high SF more than low SF information for expression categorizations (smile vs.
grimace) with the reverse profile for gender categorisations. The second SF study assessed
the drop-off in contrast thresholds associated with adding low-, mid- and high-SF noise to
expressive faces in 10-year-olds, 14-year-olds and adults (Gao & Maurer, 2011). All three
groups relied heavily upon mid- and low -F information to perform emotion categorizations,
with the key developmental difference being a need for greater contrast in the younger
samples to counter the added noise. A crucial need remains for further developmental
investigations of SF biases in facial expression categorisation.
The Bubbles paradigm (Gosselin & Schyns, 2001) provides an elegant methodology
to characterise the SF specific information used by children to categorise facial expressions.
This reverse-correlation technique pinpoints the most critical information for categorical
judgments by presenting sub-sets of visual information via randomly positioned apertures
performance (correct vs. incorrect) with the information presented allows researchers to
establish the critical SF-specific visual information driving performance.
Hitherto the Bubbles technique has predominantly been used with adults (cf.,
Humphreys, Gosselin, Schyns, & Johnson, 2006), in part because bias-free, comprehensive
sampling of a stimulus requires a considerable number of trials. Here, by testing a large
number of participants over a relatively small number of trials we are able to provide the first
full developmental characterisation of information-use for expression judgments. We tested
two groups of children: young (6–9 years) and older (10-13 years), to encompass age ranges
where changes in expression-processing ability occur for four basic expressions: fear,
sadness, happiness, anger (Gao & Maurer, 2009; Rodger et al., 2015), and compared their
performance to that of adults.
The diagnostic information for a particular categorisation is said to represent a bridge
between the visual information that is useful for making the categorisation (termed “available
information”) and internal representations of that category in memory (“represented
information”, Gosselin & Schyns, 2002; Schyns & Oliva, 1997). This framework predicts
that observers will not encode the same information across all contexts, but rather change
their strategy as a function of their current task. Emotion categorisation in adults shows
exactly this, with behavioural (Smith et al., 2005; Smith & Merlusca, 2014) and neural
evidence (Schyns, Petro, & Smith, 2007, 2009) supporting encoding of emotion-specific
diagnostic information from the earliest stages (170ms post stimulus onset). The small
amount of developmental evidence available (e.g., Deruelle & Fagot, 2005) points possibly to
a similarly variable and strategic processing strategy in children. Our study tests directly
whether children draw upon a fixed or varied set of facial features for their categorisations
To the extent that a small number of facial expressions might be critically adaptive for
successful development (e.g., happiness as a cue to approval and a guide to learning, Wu,
Gopnik, Richardson, & Kirkham, 2011) and for survival (e.g., fear as a cue to danger, Tamietto
& de Gelder, 2010), we might expect that even young children will process these particular
emotional expressions in a sophisticated and potentially adult-like manner. For example, we
predict that children, like adults, will make use of the mouth region across SF bands for
happiness, (Smith et al., 2005). For fearful faces, we expect children to make use of the
wide-open eyes, an important visual cue that is sufficient to activate the amygdala even when
presented subliminally (Breiter et al., 1996; Whalen et al., 1998). This cue has important
functions for the sender (faster saccadic reaction times, increased field of view, Susskind et al.,
2008), making it a consistent, reliable cue.
Predictions regarding information-use for judgments of sad and angry expressions are
less obvious. Some studies report that sensitivity to these expressions develops gradually (Gao
& Maurer, 2009; Rodger et al., 2015), which could signal idiosyncratic information-use
profiles that become increasingly adult-like with age. Critically, however, other studies have
identified little or no developmental change in accuracy for recognition of sadness or anger
(Lawrence et al., 2015). Thus it remains an empirical question whether information-use in
young and older children will resemble that of adults for these expressions.
2. Methods
2.1. Participant information
Participants comprised 54 adults (18-43 years, M=26.6, SD=5.0; 16 males), 71
6-9-year-olds (M=8.5, SD=0.9; 35 males, hereafter ‘young children’) and 69 10-13-6-9-year-olds
children and 13 older children were excluded due to poor performance on the emotion
categorisation task (below chance for any emotion). Children were recruited from schools in
London (UK) and Perth (Australia).
2.2 Stimuli
Eight images (two male identities each displaying fear, sadness, happiness and anger)
were extracted from the California Facial Expressions database, which features actors
producing expressions according to the Facial Action Coding System (FACS; Ekman &
Friesen, 1978), verified by a certified coder and normalised for the location of the eyes and
the mouth (Dailey, Cottrell, & Reilly, 2001).
Participants judged the emotional expressions of sub-sampled versions of these
images (for full methodological details, see Gosselin & Schyns, 2001). Specifically, face
images were decomposed into five non-overlapping spatial-frequency (SF) bandwidths of
one octave (120–60, 60–30, 30–15, 15–7.5 and 7.5–3.8 cycles/image; remaining bandwidth =
constant background). For each trial, information was independently sampled from each SF
band via randomly positioned circularly symmetric Gaussian apertures whose number and
size (3 cycles/scale) were adjusted to ensure equivalent information sampling across each
scale. The trial stimulus comprised the sampled information from each band re-combined into
one image that contained high, mid and low SF information in randomly determined
locations (see Smith et al, 2005 for more details and a visual illustration). Sampling density
(i.e., total number of bubbles) was adjusted independently for each participant and expression
to maintain 75% correct categorisation (staircase algorithm). All three age groups
commenced the task with the same number of bubbles (125) to avoid biased information
sampling across groups (a key tenet of the bubbles approach). Our adaptive procedure then
ensured that as the task progressed, when participants performed well, less information was
presented via more bubbles. This calibration ensured that the task remained comparably
challenging for all participants and for all emotional expressions. Stimuli appeared centrally
for 1000ms on a light grey background at a viewing distance of 70cm (subtending a visual
angle of approximately 6.94°x 4.42°).
2.3 Procedure
The task was presented as a game (The Puzzle Bubble Game), completed in
approximately 15 minutes by adults in university testing rooms and 20 minutes by children in
quiet school rooms. The aim of the game was to identify each face’s feelings, which was
made challenging by “cheeky puzzle bubbles” that conceal parts from view1. Responses were
made by the participant via a labelled keyboard press (labels=photographs of the 4
expressions displayed by a third face identity as well as a question mark: ‘I don’t know’
response) or verbally to the experimenter (by the very youngest children). Participants had
unlimited time to respond.
The task consisted of a training and test phase. To maintain attention and motivation,
an experimenter sat with each participant and provided enthusiastic praise and
encouragement throughout. In training, we ensured participants could correctly categorise
each expression (minimum 75% accuracy) when intact and shown for an unlimited time and
when intact and shown for 1000ms. Auditory performance feedback was provided after each
training trial.
The test phase consisted of 8 blocks of 24 trials (192 total). Some children completed
slightly fewer due to time constraints (mean trials completed by young children=185,
SD=16.6; older children=189, SD=8.75). Blocks were separated by generic “keep up the
1 For ease of explanation, we told participants that the bubbles concealed things from view;
good work” screens (odd numbered blocks) and a brief entertaining game called the Puzzle
Bubble Challenge (even numbered blocks). Here, participants guessed the name of a film,
geographical location, or television program depicted in an image initially obscured and seen
through only a small number of bubbles. The task became easier as the experimenter
provided participants with additional clues/information.
3. Results
3.1 Performance metrics
The use of an unbiased equivalent ‘starting point’ for each participant and facial
expression (of 125 bubbles) prevented us fully matching accuracy for children and adults in
the relatively small number of trials. Age-related increases in the accuracy of participants’
emotion categorisations support developmental improvement in facial expression processing
(Figure 1). A repeated measures ANOVA investigating the effect of age (young children,
older children, adults) and expression (fear, sadness, happiness, anger) on percentage correct
during the bubbles task identified a significant main effect of age, F(2,191) = 22.75, p<.001,
ηp2 = .19. Adults (M=75.9, SD=11.6) performed significantly better than older children
(M=72.8, SD=15.0; t(121)=2.79, p<.01), who in turn performed significantly better than
younger children (M=68.1, SD=17.1; t(138)=4.26, p<.001.
There was also a significant main effect of expression, F(3, 573) = 314.49, p<.001,
ηp2 = 0.62. Accuracy was significantly superior for happiness (M=84.9, SD=3.9) compared to
fear (M=75.5, SD=9.6; t(193) = 13.45, p<.001), which was superior to sadness (M=72.1,
SD=12.5; t(193) = 3.53, p <.01), which was superior to anger (M=55.4, SD=14.8; t(193) =
13.45, p<.001). These effects were qualified by a significant age x expression interaction,
F(6, 573) = 9.70, p<.001, ηp2 = .09. This reflected the fact that all comparisons were
adults for sadness, p=.29 c) young children vs. adults for categorising happy, p=.50 and d)
[image:12.595.81.514.137.348.2]fear vs. sad faces for adults, p=.23.
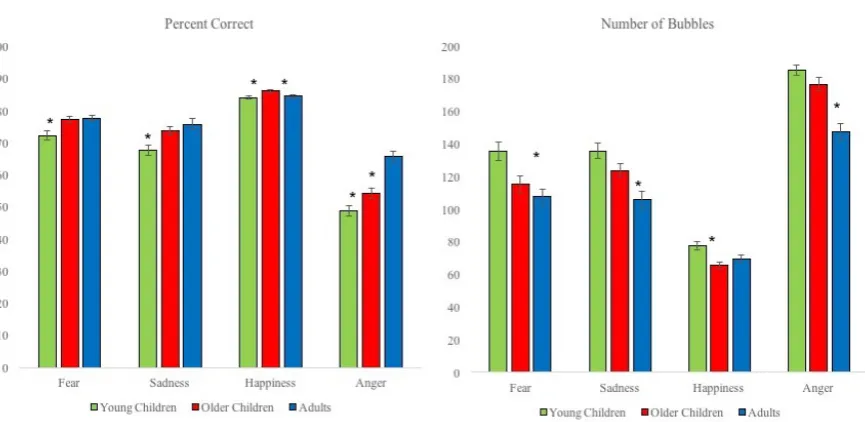
Figure 1. Task difficulty was modulated online to target each participant’s performance
around 75%. Mean accuracy of emotion expression categorisations (on the left) and median
number of bubbles required to achieve this performance level (on the right) for each age
group. Asterisks denote significant group differences (p<.05).
A complementary performance metric is the median number of bubbles required to
reach mean accuracy levels for each emotion. This value provides a direct indicator of task
difficulty with respect to the amount of visual information participants required to achieve a
particular performance level. In line with the accuracy results, a repeated measures ANOVA
confirmed a significant main effect of age, F(2,191) = 19.46, p<.001, ηp2 = .16. Young
children (M=133.6, SD=24.1) required significantly more information than did older children
(M=120.3, SD=20.7; t(138) = 3.47, p<.01), who in turn required significantly more
information than adults (M=107.6, SD=24.6; t(121) = 3.10, p<.01). There was also a
more bubbles to identify anger (M=171.7, SD=35.0) than all three other expressions, ts >16.0,
ps < .001, and fewer bubbles to identify happiness (M=71.1, SD=19.7) than all three other
expressions, ts>16.3, ps <.001. There was no significant difference in the amount of
information required for fear (M=120.6, SD=43.2) and sad expressions (M=123.1, SD=39.8),
t(193) = .78, p=.43. Here again, a small but significant interaction (F(6,573) = 4.67, p <.001,
ηp2 = .04, highlighted the variable nature of these developmental changes across emotion
categories. Younger children always required numerically more bubbles than older children,
but this group difference was significant only for the ‘easiest’ expressions: fear and happiness
(sad p=.06; angry p=.08). By contrast, older children required significantly more bubbles than
adults for only the ‘hardest’ expressions: sadness and anger (fear p=.29, happiness p=.22).
Tension between equating information sampling and performance accuracy across
participant groups is difficult to avoid in this developmental context. However, in a
supplementary analysis we were able to extract a subsample of children from the full cohort
that were well-matched on both key performance metrics for categorisations of fear, sadness
and happiness (in most cases these children were also well matched with the adult group on
categorisation accuracy for each expression). We obtained these groups by excluding the
lowest performing young children independently for each emotion (i.e., different children
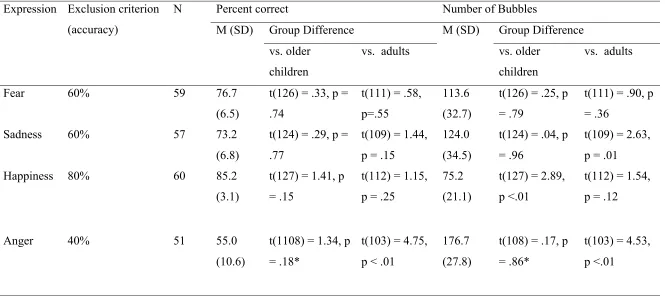
were dropped across conditions). See Table 1 for detailed information about this revised
subgroup of children. For fear and sadness, we excluded those performing below 60%
correct. For happiness – where overall performance was considerably better– we excluded
those performing below 80% correct. For anger – where overall performance was relatively
poor – to obtain matched groups we excluded those children from both the younger and older
child groups whose accuracy was below 40% correct (older children: new N= 59, M =57.8,
3.2 Classification images
Within each age group, and for each expression, we divided trials into two categories:
when the information presented resulted in correct vs. incorrect categorisation (‘don’t know’
was considered incorrect2). The bubble masks associated with correct categorisations for each
emotion were then summed together and the sum of all bubble masks associated with
incorrect categorisations subtracted from them for that emotion to generate classification
images revealing the specific information driving correct vs. incorrect categorisations. To
maximise data collection with this developmental population we sampled information only
from the face images (as per Smith et al., 2005) and not from any surrounding non-face
region. In order to conduct the specially designed corrected statistical tests for classification
images (Chauvin, Worsley, Schyns, Arguin, & Gosslin, 2005) it is necessary to select a
baseline region where one expects to observe no difference in information use. Here the
sampled non-face regions around the face image (e.g. the neck, the hairline) formed this
region. By applying p<.05 peak threshold and cluster size criterion, we established those
regions that were statistically associated with correct categorisation performance, henceforth
termed diagnostic information or features (see Chauvin, Worsley, Schyns, Arguin, &
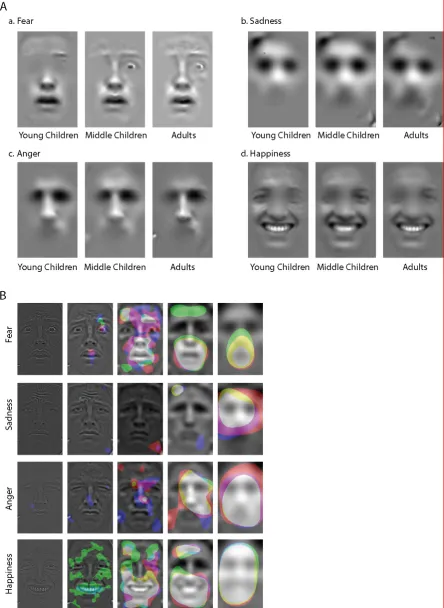
Gosselin, 2005 for statistical tests). Diagnostic regions are presented for each of the sampled
SF bands in green (younger children), red (older children) and blue (adults) in Figures 2-5
panel A, for fear, sadness, anger and happiness categorizations respectively3. To visualise the
overall diagnostic information we also selected a representative emotional face for each
emotion and revealed only the information significantly associated with correct
2 Don’t know responses were used very infrequently by all participant groups: young children
M=1.6%, STD = 2.7, older children M= 1.7%, STD = 2.1, adults M=4.2%, STD = 4.8. 3 Unthresholded classification images are provided in Supplementary Figure 2 for fear and
categorisation performance across the SF scales (see Effective Faces, Figures 2 to 5, panel
B).
The effective images and diagnostic information results reveal both striking
similarities and differences in the specific cues that drive expression judgments in
participants of different ages. All three groups shift their information processing strategies
across categories to extract the most useful visual features for different emotions, e.g.,
switching from using the widened eyes for fear, smiling mouth for happiness, downturned
mouth for sadness, tensed brow-ridge for anger. There is no indication that children (or
adults) use a fixed strategy dependent on any feature; rather all groups modify their
information-use to target informative visual cues. Importantly, the visual information
employed by adults is very much in line with a number of published studies using the same
method but with larger trial numbers and different stimulus sets (Smith et al, 2005; Schyns,
Gosselin & Smith, 2007; Smith & Merlusca, 2014), which validates the use of this task with a
relatively lower number of total trials than has been used in previous studies.
Crucially, the profile of information use observed in the better matched-subsample of
young children closely aligned with our findings with the full cohort. This convergence
strongly suggests that developmental differences in information use during expression
categorizations do not simply reflect discrepancies in observer accuracy with age. There was
a clear and close resemblance between the information used by the higher performing
subsamples of young children, and by the main cohort for categorisations of fear, anger and
happiness (see Figures 2 to 5, panel C). In the case of sadness, some differences emerged,
e.g., there was no longer strong evidence for use of wrinkles on the forehead, instead the left
eye and brow brought young children more in line with older children and adults, and the use
of mouth cues was slightly more tightly focused in this higher performing group. Crucially
reliance upon piecemeal cues from the higher spatial frequency bands rather than more
integrated, holistic information use from the mid-band, and little consideration of the right
eye. The alignment between the profiles of information observed with the higher performing
subsamples and the full cohorts of young and older children reported above serves to allay
potential concerns that developmental differences in information use during expression
categorisations simply reflect discrepancies in observer accuracy with age.
To formalise the differences in diagnostic information across the three groups, we
directly compared the classification images for each emotion and spatial scale (i.e. young vs.
older children, young children vs. adults and older children vs. adults). To this end, we
simply subtracted the non-thresholded, but already z-transformed, classification images
generated above (for each spatial scale and emotional expression), for the comparison
conditions of interest (e.g. young vs. older children). We then applied the same rigorous
statistical tests (p<0.05 threshold and cluster criterion) to these newly highlighted diagnostic
(difference) regions to establish where group differences in profiles of information use were
significant. Our use of the non-thresholded classification images reflects our desire to ensure
that significant differences are not over represented as a result of regions ‘just missing’ a
statistical threshold. To visualise these differences, we again selected a representative
emotional image and reveal only the information that is used significantly more by one group
than another (see Figures 2-5, panel D). Note that we used the classification images from the
high performing subset of younger children to limit any unfairness in direct comparison
resulting from discrepancies in performance accuracy with our original groupings.
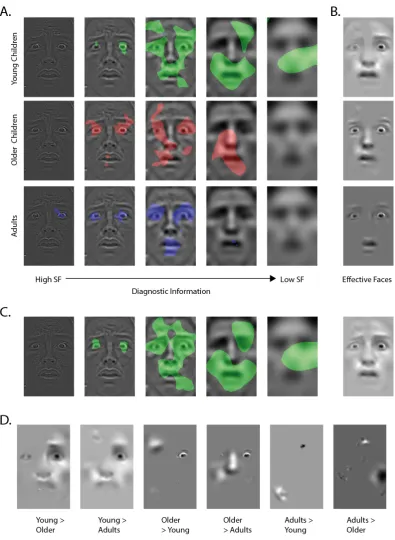
For the categorization of fearful expressions (Figure 2) there are clear differences
across the groups in the diagnostic features underlying correct categorisation. As expected,
the wide open eyes and opened mouth dominate the diagnostic information across all age
key features with age. The most striking age-related statistical differences are in the use of
lower spatial frequency information from the eyes, nose and mouth – by young children,
which is largely absent from the adult profile. The extent to which the older children made
statistically more use of the nose than adults is also borne out in the difference images
(Figure 2D), alongside their strong reliance on the high frequencies of the right hand side eye.
The difference in the use of the right eye in SF Band 1 between adults and children is not
significant, however, indicating that children’s use of this information was present but at
below-threshold levels.
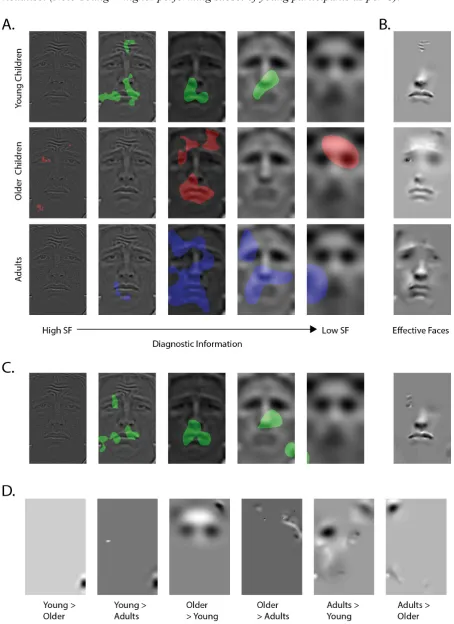
For the harder emotional categories (sadness, anger), there are marked age-related
statistical differences in information-use (Figures 3 and 4). While all age groups made use of
the downturned mouth for sadness, only older children and adults rely significantly on
information in the eye region (Figure 3 A, B). It is interesting to note, however, that the
particularly high performing subset of young children do show a clear significant association
between performance and the left eye, but this still differs from the profile of older children
and adults (Figure 3C). Difference images confirm that the adults use eye information (in
particular the right side eye) significantly more than young children. Similarly, the older
children make more use of the left side eye than do the younger children, but we note that this
difference does not reach significance.
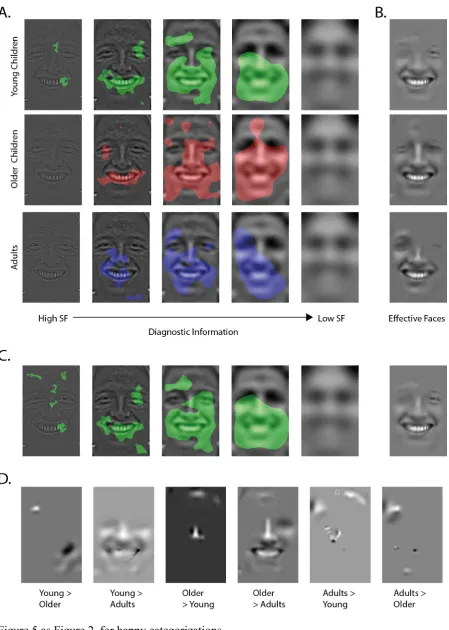
For the most ‘difficult’ angry faces, both the younger and older children focused
solely on the pinched eyes and furrowed brow. Unlike adults, these groups made no use of
the highly informative information in the taut mouth. High performing subsets of both
younger and older children also fail to show any evidence of a significant use of mouth
images (Figure 4D) 4. Finally, for happiness (the expression for which children’s performance
is best for accuracy and number of bubbles), the pattern of diagnostic information observed is
very similar for all groups.
Finally, following Smith et al, 2005, in a supplementary analysis we submitted a
model observer to the same categorization task as completed by our participants to
benchmark the available information in the current experiment (see Supplementary Methods).
Importantly we matched the model parameters with that of each participant group
categorizing each emotional expression i.e. equating performance accuracy and number of
information samples during the task in a series of separate models. Results reveal strikingly
similar information to be significantly associated with correct performance for each
emotional expression across the participant group specific models (see Supplementary Figure
3). Thus, the underlying differences in the amount of information provided (number of
bubbles) and categorization performance accuracy had only minimal impact in changing the
information available to perform the emotion categorization task across participant groups
(and not in any way that mirrored the observed human differences in information use).
Although model observers could be considered a powerful benchmark against which
to track developmental differences in the current context, our primary interest in this work is
to track the development of human information processing with increasing age. Computer
models do not necessarily represent the apex of such development in the same way as real
adults, and the differences between human and model observers have previously been shown
4 Please note that it was not possible to match the performance of younger or older
children to adults for their anger categorisations leaving a residual performance difference of 10% for younger children compared to adults. The use of the z-transform should minimise any resulting unfairness driven by the performance differences when directly comparing information use across the groups (Figure 4D), however this cannot be entirely ruled out. Note too, however, that the differences are not one-sided as one might expect should adults have an unfair advantage due to their improved
to provide important insights in their own right (Smith et al, 2005). The most appropriate
[image:19.595.73.469.151.692.2]benchmark, therefore, remains that of adult human observers performing the same task.
sub-sample of young children. D. Information that is used significantly more by one group than the other (p<0.05), extracted from a sample image and combined across SF scales to visualise. (Note Young = higher performing subset of young participants as per C).
Figure 4. as Figure 2, for anger categorizations. (Note Older = higher performing subset of
older participants as per C).
Figure 5 as Figure 2, for happy categorizations.
The current study constitutes the first direct investigation of information-use during
emotional expression judgments across developmental time. Our unique application of the
influential ‘Bubbles’ reverse correlation paradigm with typically developing children and an
adult comparison sample has revealed an intriguing mix of parallel and contrasting face
processing strategies across age groups. Moreover, the complex profiles of information-use
we observed for fear, sadness, happiness and anger in young and older school-aged children
appear to be broadly linked with their strengths and weaknesses in processing ability for
these different emotion stimuli.
We identified clear developmental differences in expression-processing abilities
across age groups. Participants’ emotion-categorisation accuracy improved with age, as did
their processing efficiency (as measured via the amount of visual information required to
achieve performance outcomes: number of bubbles). This evidence of age-related
improvement in expression processing is theoretically important because at least one recent
study struggled to find evidence of developmental differences in face abilities when task
difficulty levels are equated (e.g., Crookes & Robbins, 2014). In itself, this finding
constitutes a strong challenge to any claims of quantitatively mature face perception in early
development.
Across expressions participants showed consistently stronger categorisation accuracy
for happy faces, followed by fear, sadness, and then anger. The relatively strong performance
observed for fearful faces contrasts with much of the extant adult expression processing
literature (e.g., Palermo & Coltheart, 2004; Tottenham et al., 2009), where this is one of the
more difficult expression to categorise. It is difficult to draw strong conclusions about the
specific design element or combination of elements driving this difference, given the many
differences across studies (e.g. . Moreover ‘Bubbles’ technically addresses a question
simply assessing emotion recognition, the reverse correlation approach is designed to
pinpoint the visual information significantly associated with accurate stimulus
categorisations, i.e., revealing the information that participants rely upon consistently when
deciding if a face looks scared, sad, happy or angry. Thus the current results indicate that
participants found it relatively easy to draw out the visual cues pertinent to making fearful
judgments, which is not strictly the same thing as finding these judgments effortless.
When we examine the specific information driving participants’ expression
categorisations, similarities between the children and adults emerge – even when the groups
were matched for processing ability. For example, young children, older children and adults
all modulated their processing strategies to draw upon different features when categorising
fear, sadness, happiness and anger, in order to target the most informative visual cues. The
features that were significantly used by participants for each expression were broadly similar
across age-groups. Young children, older children and adults all significantly used the
widened eyes for fear, smiling mouth for happiness, downturned mouth for sadness, tensed
brow-ridge for anger. These distinct processing profiles constitute important new evidence of
strategic information-use from 6 years and are consistent with categorical (cf. continuous)
perception of emotion in all three age groups (Cheal & Rutherford, 2011; de Gelder,
Teunisse, & Benson, 1997).
Profiles of information-use were by no means identical, however, across age groups.
For the most part, information-use became increasingly more targeted across developmental
time. Young children and, to a lesser extent, older children relied upon a wider range of
visual features and information for their judgments compared to adults. These extra cues may
have introduced additional noise to result in impaired, rather than improved performance
shift reflected quantitative refinement rather than qualitative differences in the diagnostic
information relied upon by participants.
Young and older children’s profiles of information-use were broadly adultlike for
judgments of fear, happiness and sadness, but not anger. There instead, we observed
qualitative differences in features driving correct categorization judgements, e.g., use of the
mouth region was significantly reduced (essentially absent) in both child groups. Perhaps
importantly, children’s categorization accuracy was also particularly poor for this expression:
anger was the only emotion for which percentage correct could not be statistically matched
across age groups. This result – along with the subtler improvements in performance
observed as children’s information-use became more refined for the other expressions -
provides additional support for the notion that information-use optimization is functionally
important for face perception. If strategic information use aids efficiency, then then it follows
that quantitative and (perhaps particularly) qualitative divergence from the mature profile
would come at a cost to performance.
The developmental shifts observed during this experiment support a role for
experience in participants’ outcomes on the bubbles task. From a long-term perspective,
increased opportunities to interpret emotional expressions displayed by different faces that
are associated with age and life experience might have contributed to these developmental
differences in participants’ sensitivity to the most diagnostic cues for these judgments. It is
pertinent to note that the current study did not collect information about the cultural
background of individual participants, which is known to impact upon how adults view,
interpret and extract information from faces (e.g., Blais, Jack, Scheepers, Fiset, & Caldara,
2008; Jack, Caldara, & Schyns, 2012; Jack, Garrod, Yu, Caldara, & Schyns, 2012). An
and when these cultural differences emerge, and whether they are refined/amplified – as we
might expect - with increases in age and (own-race) face experience.
It is also possible that from a short-term perspective (e.g., within the current
experiment), older children and adults may have been better cognitively equipped to ‘tune in’
to the most useful stimulus properties of the exemplars presented across the 192 trials of the
experiment. Presentation of two identities modelling each expression meant that participants
gained considerable exposure to these particular exemplars and it is possible that this could
have impacted on the results. The convergence between the current results and previous adult
findings (e.g., Smith et al., 2005), however, provide little reason to think the current results
would not generalise, e.g., to larger and more diverse stimulus sets. Nevertheless, information
use during expression categorisations can vary as a function of task demands (Smith &
Merlusca, 2014), making this issue an interesting open question for future research.
The current study represents an important step forward in our understanding of how
children read and understand facial displays of emotion. Characterising information-use
during expression-categorisation judgments is an important endeavour in its own right
because children’s abilities in this domain are inextricably linked with their successful social
and cognitive development (Widen, 2013). Future studies that investigate the development of
information processing on a finer grained level (e.g. at every year of development) may
provide further important insights, although such work would require intimidatingly large
samples of children. Equally, our findings crucially open the door for future research with
other populations by providing a normative baseline against which we can compare profiles
of information-use in conditions such as Williams syndrome or autism spectrum disorder,
where face processing represents a relative strength and weakness respectively.
This work confirms also that the application of the Bubbles paradigm is not limited to
here with a relatively small number of trials (total) converge nicely with those from studies
with much more exhaustive testing sessions (Smith et al., 2005; Smith & Schyns, 2009;
Smith & Merlusca, 2014). Though perhaps surprising at first glance, we note that stable
Bubbles solutions have also been reported with modest trial numbers in individual level
analyses associated with EEG studies (e.g., Schyns, Petro, Smith, 2007; 2009). Nevertheless,
it is exciting to show here that with minor adaptations, this approach can be used to
investigate information processing strategies in children as young as six years of age.
We have known for some time that expression-reading abilities are far from adult-like
during childhood, yet few have investigated whether there are differences in how children
perceive and process such stimuli in such a detailed manner. With this powerful paradigm,
we have identified sophisticated information-processing strategies in school aged children
that tend to qualitatively resemble those of adults. After pinpointing the diagnostic
information for categorisations of fear, sadness, happiness and anger, it is clear that
children’s interpretation of emotion information is far more complex than any simple
affective distinction based on a small fixed set of features (e.g., is that face happy vs. not
happy). This study reveals a complex profile of strategic information-use from the youngest
ages tested, which becomes increasingly refined across developmental time, broadly in line
Supplementary Material
Acknowledgements
This research was supported by a grant from the Leverhulme Trust: RPG-2013-019 awarded
to MLS, EF and AKS. Additional support was generously provided by Gillian Rhodes and
the Person Perception Node of the Australian Research Centre of Excellence in Cognition
and its Disorders. We thank Michael Papasavva, Cathy Wong, Charles Wigley and
Marguerite Cullity for assistance with data collection as well as the children, their parents and
the schools for the time and effort expended in participating in these studies.
References
Batty, M., & Taylor, M. (2006). The development of emotional face processing during
childhood. Developmental Science, 9, 207 - 220.
Breiter, H. C., Etcoff, N. L., Whalen, P. J., Kennedy, W. A., Rauch, S. L., Buckner, R. L., . . .
Rosen, B. R. (1996). Response and habituation of the human amygdala during visual
processing of facial expression. Neuron, 17, 875 - 887.
Blais, C., Jack, R. E., Scheepers, C., Fiset, D., & Caldara, R. (2008). Culture shapes how we
look at faces. Plos ONE, 3(4), e3022.
Burton, N., Jeffery, L., Skinner, A., Benton, C., & Rhodes, G. (2013). Nine-year-old children
use norm-based coding to visually represent facial expression. Journal of
Experimental Psychology: Human Perception and Performance, 39, 1261-1269.
Chauvin, A., Worsley, K., Schyns, P., Arguin, M., & Gosselin, F. (2005). Accurate statistical
tests for smooth classification images. Journal of Vision, 5, 659 - 667.
Cheal, J. L., & Rutherford, M. (2011). Categorical perception of emotional facial expressions
in preschoolers. Journal of Experimental Child Psychology, 110, 434 - 443.
Costen, N., Parker, D., & Craw, I. (1994). Spatial content and spatial quantisation effects in
face recognition. Perception, 23, 129 - 146.
Costen, N., Parker, D., & Craw, I. (1996). Effects of high-pass and low-pass spatial filtering
on face identification. Perception and Psychophysics, 58, 602 - 612.
Crookes, K., & McKone, E. (2009). Early maturity of face recognition: No childhood
development of holistic processing, novel face encoding, or face space. Cognition,
Crookes, K., & Robbins, R. (2014). No childhood development of viewpoint-invariant face
recognition: Evidence from 8-year-olds and adults. Journal of Experimental Child
Psychology, 26, 103 - 111.
Dailey, M., Cottrell, G., Padgett, C., & Adolphs, R. (2002). EMPATH: A neural network that
categorizes facial expressions. Journal of Cognitive Neuroscience, 14, 1158 - 1173.
Dailey, M., Cottrell, G. W., & Reilly, J. (2001). California facial expressions, CAFE.
Unpublished digital images. University of California, San Diego, Computer Science
and Engineering Department.
de Gelder, B., Teunisse, J. P., & Benson, P. J. (1997). Perception of facial expressions:
Categories and their internal structure. Cognition and Emotion, 11, 1- 23.
de Haan, M., & Nelson, C. (1997). Recognition of the mother's face by six-month-old infants:
A neurobehavioral study. Child Development, 68, 187 - 210.
de Heering, A., Houthuys, S., & Rossion, B. (2007). Holistic face processing is mature at 4
years of age: Evidence from the composite face effect. Journal of Experimental Child
Psychology, 96, 57 - 70.
De Sonneville, L., Verschoor, C., Njiokiktjien, C., Op het Veld, V., Toorenaar, N., &
Vranken, M. (2002). Facial identity and facial emotions: Speed, accuracy, and
processing strategies in children and adults. Journal of clinical and experimental
neuropsychology, 24(2), 200-213.
Deruelle, C., & Fagot, J. (2005). Categorizing facial identities, emotions, and genders:
attention to high-and low-spatial frequencies by children and adults. Journal of
Experimental Child Psychology, 90, 172 - 184. doi:10.1016/j.jecp.2004.09.001
Durand, K., Gallay, M., Seigneuric, A., Robichon, F., & Baudouin, J. Y. (2007). The
development of facial emotion recognition: The role of configural information.
Ekman, P., & Friesen, W. V. (1978). Facial action coding system: A technique for the
measurement of facial movement. . Palo Alto, California: Consulting Psychologists
Press.
[dataset] Ewing, L. (2017, May 10). Cognition Archived Data 2017. Retrieved from
osf.io/gk4vx
Gao, X., & Maurer, D. (2009). Influence of intensity on children's sensitivity to happy, sad,
and fearful facial expressions. Journal of Experimental Child Psychology, 102(4),
503-521.
Gao, X., & Maurer, D. (2011). A comparison of spatial frequency tuning for the recognition
of facial identity and facial expressions in adults and children. Vision Research, 51,
508 - 519.
Golorai, G., Liberman, A., Yoon, J., & Grill-Spector, K. (2010). Differential development of
the ventral visual cortex extends through adolescence. Frontiers in Human
Neuroscience, 3, 1 - 19.
Gosselin, F., & Schyns, P. (2001). Bubbles: a technique to reveal the use of information in
recognition tasks. Vision Research, 41(17), 2261-2271.
Gosselin, F., & Schyns, P. (2002). RAP: A new framework for visual categorisation. Trends
in Cognitive Sciences, 6, 70 - 77.
Herba, C., & Phillips, M. (2004). Annotation: Development of facial expression recognition
from childhood to adolescence: Behavioural and neurological perspectives. Journal of
Child Psychology and Psychiatry, 45(7), 1185-1198.
Humphreys, K., Gosselin, F., Schyns, P., & Johnson, M. (2006). Using "Bubbles" with
babies: A new technique for investigating the informational basis of infant perception.
Jack, R. E., Caldara, R., & Schyns, P. G. (2012). Internal representations reveal cultural
diversity in expectations of facial expressions of emotion. Journal of Experimental
Psychology: General, 141, 19 - 25.
Jack, R. E., Garrod, O. G., Yu, H., Caldara, R., & Schyns, P. G. (2012). Facial expressions of
emotion are not culturally universal. Proceedings of the National Academy of
Sciences, 109(19), 7241 - 7244.
Jeffery, L., McKone, E., Haynes, R., Firth, E., Pellicano, E., & Rhodes, G. (2010).
Four-to-six-year-old children use norm-based coding in face-space. Journal of Vision, 10, 1 -
19.
Johnston, P., Kaufman, J., Bajic, J., & Sercombe, A. (2011). Facial emotion and identity
processing development in 5- to 15-year-old children. Frontiers in Pschology, 2, 1 - 9.
Kanwisher, N., McDermott, J., & Chun, M. (1997). The fusiform face area: a module in
human extrastriate cortex specialized for face perception. Journal of Neuroscience,
17, 4302 - 4311.
Karayanidisa, F., Kellya, M., Chapmana, P., Mayes, A., & Johnston, P. (2009). Facial
identity and facial expression matching in 5-12 year old children and adults. Infant
and Child Development, 18, 404 - 421.
Lawrence, K., Campbell, R., & Skuse, D. (2015). Age, gender and puberty influence the
development of facial emotion recognition. Frontiers in Psychology, 6, 1 - 14.
Lobaugh, N., Gibson, E., & Taylor, M. (2006). Children recruit distinct neural systems for
implicit emotional face processing. Neuroreport, 17, 215 - 219.
McKone, E., Crookes, K., Jeffery, L., & Dilks, D. (2012). A critical review of the
development of face recognition: Experience is less important than previously
Näsänen, R. (1999). Spatial frequency bandwidth used in the recognition of facial images.
Vision Research, 39, 3824 - 3833.
Palermo, R., & Coltheart, M. (2004). Photographs of facial expression: Accuracy, response
times, and ratings of intensity. Behavior Research Methods, Instruments, &
Computers, 36, 634 - 638.
Pollux, P., Hall, S., & Guo, K. (2014). Facial expression training optimises viewing strategy
in children and adults. PLOS ONE, 9, e105418. doi:doi:10.1371/
journal.pone.0105418
Rodger, H., Vizioli, L., Ouyang, X., & Caldara, R. (2015). Mapping the development of
facial expression recognition. Developmental Science, 1 - 14.
Ruiz-Soler, M., & Beltran, F. (2006). Face perception: An integrative review of the role of
spatial frequencies. Psychological Research, 70, 273 - 292.
Schyns, P., & Oliva, A. (1997). Flexible, diagnosticity-driven, rather than fixed, perceptually
determined scale selection in scene and face recognition. Perception, 26, 1027 - 1038.
Schyns, P., Petro, L., & Smith, M. L. (2007). The N170 Peaks when Diagnostic Visual
Information Integration Ends. . Current Biology, 17, 1580 - 1585.
Schyns, P., Petro, L., & Smith, M. L. (2009). Transmission of facial expressions of emotion
co-evolved with their efficient decoding in the brain: behavioral and brain evidence.
PLOS ONE, 4, e5625.
Smith, F., & Schyns, P. (2009). Smile through your fear and sadness: Transmitting and
identifying facial expression signals over a range of viewing distances. Psychological
Science, 20, 1202 - 1208.
Smith, M. L., Cottrell, G., Gosselin, F., & Schyns, P. (2005). Transmitting and decoding
Smith, M. L., & Merlusca, C. (2014). How task shapes the use of information during facial
expression categorisations. . Emotion, 14, 478 - 487.
Spezio, M., Adolphs, R., Hurley, R., & Piven, J. (2007). Analysis of face gaze in autism
using "Bubbles". Neuropsychologia, 45, 144 - 151.
Susskind, J., Lee, D. H., Cusi, A., Feiman, R., Grabski, W., & Anderson, A. K. (2008).
Expressing fear enhances sensory acquisition. Nature Neuroscience, 11, 843 - 850.
Susskind, J., Littlewort, G., Bartlett, M., Movellan, J., & Anderson, A. (2007). Human and
computer recognition of facial expressions of emotion. Neuropsychologia, 45, 152 -
162.
Tamietto, M., & de Gelder, B. (2010). Neural bases of the non-conscious perception of
emotional signals. Nature Reviews Neuroscience, 11, 697 - 709.
Thomas, K., Drevets, W., Whalen, P., Eccard, C., Dahl, R., Ryan, N., & Casey, B. (2001).
Amygdala response to facial expressions in children and adults. . Biological
Psychiatry, 49, 309 - 316.
Thomas, L., Graham, R., & LaBar, K. (2007). Development of emotional facial recognition
in late childhood and adolescence. Developmental Science, 10(5), 547-558.
Tottenham, N., Tanaka, J. W., Leon, A. C., McCarry, T., Nurse, M., Hare, T. A., . . . Nelson,
C. (2009). The NimStim set of facial expressions: Judgments from untrained research
participants. Psychiatry Research, 168, 242 - 249.
Walker-Andrews, A. (1997). Infants' perception of expressive behaviors: Differentiation of
multimodal information. Psychological Bulletin, 121, 437 - 456.
Whalen, P. J., Rauch, S. L., Etcoff, N. L., McInerney, S. C., Lee, M. B., & Jenike, M. A.
(1998). Masked presentations of emotional facial expressions modulate amygdala
Widen, S. (2013). Children’s interpretation of facial expressions: The long path from
valence-based to specific discrete categories. Emotion Review, 5, 72 - 77.
Wu, R., Gopnik, A., Richardson, D., & Kirkham, N. (2011). Social cues facilitate perceptual
Figure Legends
Figure 1. Task difficulty was modulated online to target each participant’s performance
around 75%. Mean accuracy of emotion expression categorisations (in blue) and median
number of bubbles required to achieve this performance level (in red) for each age group.
Asterisks denote significant group differences (p<.05).
Figure 2. A. The diagnostic information (i.e. information that is significantly associated with
performance driving fearful categorizations, for young children in green, older children in red
and adults in blue. B. Only the diagnostic information extracted from each SF scale of a
sample image and recombined to visualise the information used by each participant group to
complete their successful face categorizations. C. As A and B for the high performing
sub-sample of young children. D. Information that is used significantly more by one group than
the other (p<0.05), extracted from a sample image and combined across SF scales to
visualise.
Table 1. Descriptive statistics for matched subsample of young children.
Expression Exclusion criterion (accuracy)
N Percent correct Number of Bubbles
M (SD) Group Difference M (SD) Group Difference vs. older
children
vs. adults vs. older
children
vs. adults
Fear 60% 59 76.7
(6.5)
t(126) = .33, p = .74
t(111) = .58, p=.55
113.6 (32.7)
t(126) = .25, p = .79
t(111) = .90, p = .36
Sadness 60% 57 73.2
(6.8)
t(124) = .29, p = .77
t(109) = 1.44, p = .15
124.0 (34.5)
t(124) = .04, p = .96
t(109) = 2.63, p = .01
Happiness 80% 60 85.2
(3.1)
t(127) = 1.41, p = .15
t(112) = 1.15, p = .25
75.2 (21.1)
t(127) = 2.89, p <.01
t(112) = 1.54, p = .12
Anger 40% 51 55.0
(10.6)
t(1108) = 1.34, p = .18*
t(103) = 4.75, p < .01
176.7 (27.8)
t(108) = .17, p = .86*
t(103) = 4.53, p <.01
Supplementary Materials
Ideal Observer Model
Following the approach outlined in Smith et al (2005), the original investigation of expression processing using the Bubbles approach, we submitted a model observer to the same categorization task as that completed by our three groups of participants. The model Pearson correlated the pixel intensity values of individual face stimuli (i.e., with randomly positioned Bubbles sampling information from across the 5 spatial frequency bands) with the entire (intact) stimulus set and made its categorization choice as the emotion category of the image giving the highest correlation (winner-take-all). We matched the performance of the model with that of each participant group categorizing each emotion (percentage correct) by adding an adjustable density of evenly distributed white noise. Importantly we conducted separate models for all participant groups and emotion categories with the defined
information sampling density (number of bubbles) set to match that of each group. Bubbles analysis proceeded identically to that of the human participants. Figures 1A and B, below, detail the results of the model observer that can be considered to be one benchmark of the information available to perform the task. Although the human participants had the option of a “Don’t know” response, these were made very infrequently (young children M = 1.6%, older children = 1.7%, adults = 4.2%) and under the instruction that they only be used in a situation where it was not possible to perform the task at all (as opposed to not decide on a decision). Therefore, to all intents and purposes, ‘Don’t know’ responses in fact simply reflect incorrect categorization decisions in the participants and therefore did not try to include such a response for the model observer.
Smith, M. L., Cottrell, G., Gosselin, F., & Schyns, P. (2005). Transmitting and decoding facial expressions. Psychological Science, 16(3), 184-189.