ECONOMIC P~ESBARCH INSTITUTE
The Irish Economy in 1964 and 1965
by.
C.
B. V. Leser
July 196 5
Paper No. 27
The Irish Bcono-my in 1964 and 1965~
by C. P.. V. L~ser*
Introduction
Since &96i it has been the practice to
incorporate in The Economic Research Institute’s publication series an evaluation of recent Irish economic developments at annual intervals. At the same time an attempt was made to forecast the major
national accounts totals for the whole o£ the current : year by the time about half the year had elapsed and data for the first quarter at any rate were available. It was hoped thereby to fill a gap in our existing
knowledge o£ economic conditions, since only a limited amount of short-term economic analysis was being
undertaken in,this country.
The situation has recently changed. The Central Bank Quarterly Bulletins have now become a vehicle for information arising out of studies made which deal with the relationships between monetary and
national accounts aggregates, and it has now moved into the-field of forecasting for 1965 (Banc Ceannais n.a!~hEi.reafln~ 1965)., ~, Moreover~ official projection’s
fo.r.,.~:he cur:rent year which have always-’been made in thec Department of Finance at the beginning of each
,yoar.. have, in 1965, been published f’or’the first time (Second. Programme fOr Bconomic Expansion~"l955). The ’ Economic Research Institute has also moved further into the field of short-term economic analysis by compiling a number of quarterly economic series and by computing
seasonally adjusted data ,for series exhibiting marked seasonal patterns.
In the light of these developments, it seems worthwhile to reconsider the role which this annual review should play. A review of 1964 still seems
appropriate~ but to avoid duplication it seems desirable to.concentrate on comparisons of previous forecasts with actual developments and an international comparison. Furthermore~ rather than attempt a competing forecast
for the national accounts in 1965~ the author feels it worthwhile to..give his. current line of thought regarding the use of econometric models in short-term forecas.ting. and to apply these considerations to an examination Of the official forecasts made. "
2. The year i964 at home and abroad.
. It is officially,estimated that gross national product in real terms in 1954 was about 4.2~ higher than
in 1963,. The main contribution to this risecame from industryi the v Qlume of industri.al production increased by 9..8.~ for manufacturing and by 9.6~ for all transportable goods industries between 1963 and 1964 as. a,.whole. Bu-t: ~
agriculture~ with an estimated 4% increase in volume of ..
.. ’ .. ~.
net outp.ut, in that period .also.made a substantial
contribution to the growth rate~ whilst the c:on~ributi0n of the services sector appear,s to have been negligibie. :.
: ..::::~ ¯ ¯ .
The author of ...this paper is a Research Pr0fessor of The
Economic ~esearch .Institute.- The paper has been accepted for publication by the Institute. The author is.
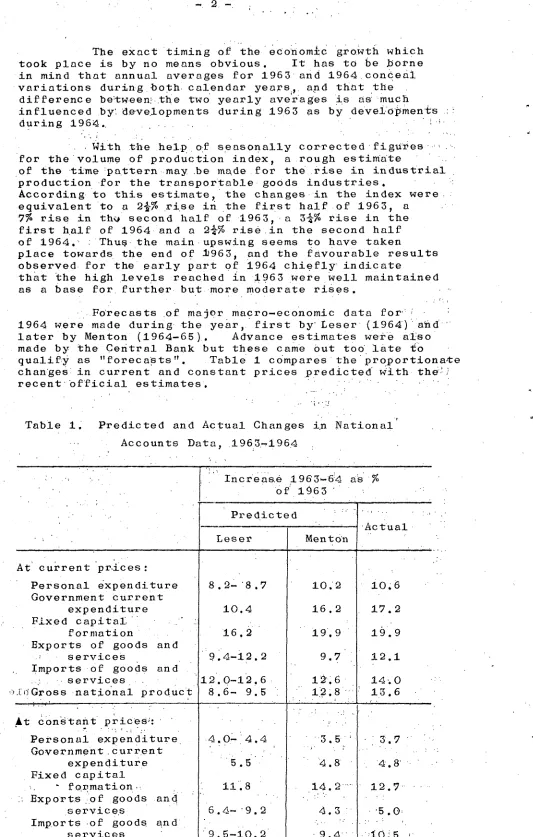
The exact timing o# the ~conom~c growth which
took place is by no means obvious. It has to be Borne
in mind that annual averages for 1963 and 1964 con6eal
variations during .both¯ calendar yea.rs, and that the
difference be;tween! the two yearly averages is as much
influenced by: de.velopments during 1963 as by devel:Opments :
during 196;4.. ¯
With the help of seasonally corrected figuPes
for the volume of production index, a rough estimate
of the time :pattern may be made for the rise in industrial
production for the transportable goods industries.
According to this estimate~ the changes in the index were
equivalent to a 2{-% rise in the first half of 1963, a
7% rise in th~ second half of 1963, a ~ rise in the
first half of 1964 and a 2~% rise in the second half
of 1964.. Thu~ the main upswing seems to have taken
place towards the end of ~963, and the favourable results
observed for the early part of i964 chiefly indicate
that the high levels reached in 1963 were well maintained
as a base for further but more moderate rises.
Forecasts of major macro-economic data for~ "
1964 were made during the year, first by Leser (1964) a~d
later by Menton (1964-65). Advance estimates were also
made by the Central Bank but these came out too late ~o
qualif:y as "forecasts". Table 1 compares the pr0Portiona~e
changes in current and constant prices Predicted With the.:)
recent Official estimates. " ’
[image:3.576.24.557.26.863.2]¯ [,. -:
Table I. Predicted and Actual Changes in National
Accounts Data, 1963-1964 :
At current pr.ices:
Personal expenditure
Government current
expenditure
Fixed capital.
formation
Exports of goods and
services
Imports of goods and
services
¯ ,.[dGross national product
At 0nstant prices;:
Personal expenditure
Government. current
expenditure
Fixed capital
fo.~mation ¯
.. Exports of goods and
s ervi c e.s
Imports .of goods and
services
Gross national product
Increas.e 196’3-6!4 as %
of 1963
Predicted
Leser
Ment0n
8.2- 8.7
10.2
10.4
16.2
¯
16.9~
19.9
:914-i2.2
9.7
12. 0-12.6 ¯
12’. 6
-8.6- 9.5 "
112.8
¯ .- ,i . ,!
) ¯ .
4.0-:4.4
¯
5.5
¯5.5
: ii: 8
14.2 ...
¯ , . , ,
6.4- ¯9.2
4.3
:9.5-io. 2
9.4
4.2- 4.9"
3
-The forecast made by this writer during
mid-1964 was based on a direct estimate of the implied
changes’ in price indices for imports and gross national product, and of the volume changes in government
expenditure, fixed investment and exports; t.he remaining figures were derived by means of econometric equations, taking some account of special circumstances. The main fault of the prediction was that the price increase,
particularly for home produced goods and services, was considerably underestimated. In consequence, most increases in value terms were underestimated, though the estimates for the increases in real terms were not
too far out. The exception was export.s; in this field the optimistic forecast turned out to be correct
in value terms, though too much of the export growth was attributed to volume changes and’ too little to rising export prices. On the whole, the oitturn in constant prices was reasonably close to the more
conservative alternatiye of the two predictions giv.en.
The prediction given by Menton was made towards
the end of the year and thus succeeded far better in assessing the effect of price changes upon the :national
accounts dat.a at current prices, though the foreign trade totals Were somewhat underestimated. The prediction errors in the changes at constant prices were of the same Order of magnitude as those in the earlier forecast. A wider range of data than those
shown in’ Table .~ .were predicted.
The rise in the value of agricul’tural output
between !963 and 1964 was also. somewhat underestim.ated in the predic’tion made by Attwood "and Ross (1964). Tlle value of liyestock and livestock products disposed
of during the year, as well as. the value of increases in livestock numbers, turned out higher than predicted; on the other hand, crops were" generally less in quantity than in 1963 and did not show the expected value increase.
All in all, gross agricultural output value appears .to. have increased by 12.7~ and net output by 14.7°./o, instead
of by 9.2Y~ and 10.1~o respectively as predicted.
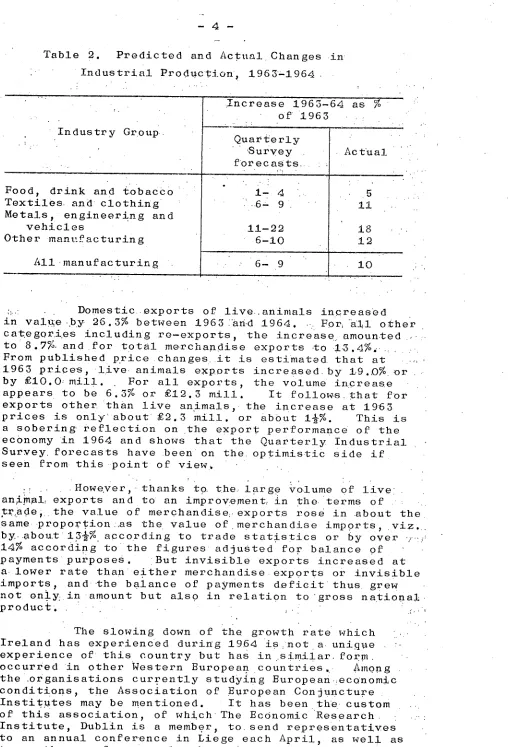
For manufacturing industries, the Quarterly Industrial S.urvey conducted by The Economic Research Ins titu.te derived, at various times during the year, .a forecast for the increase in production between 1963
and 1964 by weighting the quantitative prognostics . furnished by various firms according to the importance
of the industry. The resulting predictions varie’d
during the year between a 6~ and a 9~ incr.ease and erred
somewhat on the low side, since .the actual increase for all manufacturing came to almost $0~. The tendencyI towards a sl!ght underestimation applied to .all broad industrial groupings as seen from Table 2; the actual
increases are derived as weighted aver.ages from published volume index numbers. .
Forecasts for changes in industrial exports were also given in the Quartorly Industrial Survey and
varied between .a i~ and a 5~ increase, the figures for individual industry groups showing even larger variations.
The true picture.is not self-evident owing to tile
exceptionaily large price rises and to some uncertainty as to what constitutes industrial exports. The
official, classification includes a number of.- processed foods with a substantial industrial Content among
Table 2. Predicted and Ac.tual Changes in
Industrial Production, 1963-1964
Industry Group.
Food, drink and ±obacco Textiles and clothing Metals, engineering and
vehicles
Other manufacturing
All manufacturing
Increase 1963-61 as % of 1963
Quarterly ~Survey forecasts,
i- 4
.6" 9 .
6- 9
Actual
-5
11 .
18 12
10
::. Domestic .exports of live..animals increased
in val~e .bY 26.3~ between 1963 ian.d 1964. . For~ all o~her
cat:egories including re-exports, the increase amounted ,. to 8.7~, and for total merchandise exports .to 1.3.49: . ....
¯ From published price changes it is estimated that at ., 1963 prices, live animals exports increased by 1:9.O~ or . by £i0.0~ mill.. For all exports, the volume in:crease
appears to be 6.3~ or £12.3 mill. It follows that for
exports other than live animals, the increase at 1963 prices is on12"~ about £2 3 mill¯ or about i~o. This is a sobering’ reflection on the export performance of the economy in 1964 and shows that the Quarterly Industrial Survey. forecasts have been on the optimistic side if seen from this point of view~
.... However,, thanks to-the, large volume of live[ an~m~l~ exports and to an improv:ement, in the/terms of ¯ ~ ,
.tr~ade, the value of merchandise;.exports rose in .abont the same .proportion.~as the value of merchandise lmpQrts, viz.., by., abou.t 13½%. according to trade statistics or by over ,/.;~ 14~ according to the figures adjusted for balance .of
payments purposes. But invisible exports increased at a. lower rate than either merchandise exports or invisible
imports, and.-the balance of payments d.eficit thus, grew not on’.ly: in amount but also in relation to "gross national.
product. ; . :..
The slowing down of the growth rate which Ireland has experienced during 1964 is:not.a, unique :.. experience of this country but has in..simi!ar, form. occurred in other Western European countries ¯ Among
the ,organisations currently studying European.~economic conditions, the Association of European Conjuncture Institutes may be mentioned. It has been the. custom
of this association, of which¯ The Economic Research. .. ..: Institute, Dublin is a member, to.send representatives
to an annual conference in Liege each April, as well as to another conference elsewh@re,in, autumn, and among
other.things to draw up .a s~atem~n$ which has been.
geneDa!ly, agreed upon. This year’s resolution, adopted .... ate.the Liege conference on 29,and 30. April 1965, appears ’ to have succeeded particularly well in expressing the
pertinent c.onclusions; and as .it .is not readily available in publishedform, it .seems iworthwhile~ tO :quote i.t in
full, translated fr.om the original Frenc.h: ,. ~
i ’
i~The economic upsurge in Western Europe has
cbn~inued during 1964 but has, on the Whole> slowed down. This development is largely the result of more Or less restrictive policies which the
governments of several countries were obliged to adopt in. their struggle against either inflationary tendencies or a disequilibrium in their balance
of pay. men ts .
"In Italy, a slight recovery took place at
the end of the year. In France, there was a slight drop in activity during the second halfi of
1964. The British economy has experienced, after several months of uncertainty, a certain acceleration
in its expansion towards the end of 1964. In Western German’y, the economic expansion continues
until the present; this also applies to most other countries,. though with a slowing down of the growth
¯ rate.
"From now on till the end of 1965, it seems that in many countries demand will be the chief limiting factor for expansion. This is the case
in Italy although.conditions show an’ improvement, and also in France where a recovery’is expected during the later part of the year. For Great Britain, the impact of the recent budget will no
doubt permit, no more than a moderate growth of [
home demand..
"However, in some cases the expansion will be. ..,
[ .’.
mainl.y limited by ¯supply which is tighter than in _ 1964. Neve.rthele.ss thi.s permits a continuation
of economic .growth., notably in. Western Germany.
"In the cours.e of these developmental the
European countries will encounter certain important problems. On the one hand, new wage rises, often
combined with a smaller rise in productivity, will cut into the enterprises’ profit margins. On the
other hand, funds available for investment will be limited owing to restrictive monetary policies, and
to measures taken by the United States to redress " their balance of payments. Thus enterprises will find themselves in a vulnerable financial position.
HThus, econOmic policy will require delicate handling. Where demand is weak but tensions
persist, a progressive relaxation of restrictions may be envisaged but without compromising a Still unstable equilibrium. Where the demand maintains its pressure, the authorities will have to contain. ¯ the monetary expansion without preventing ~he
. necessary structural alterations.
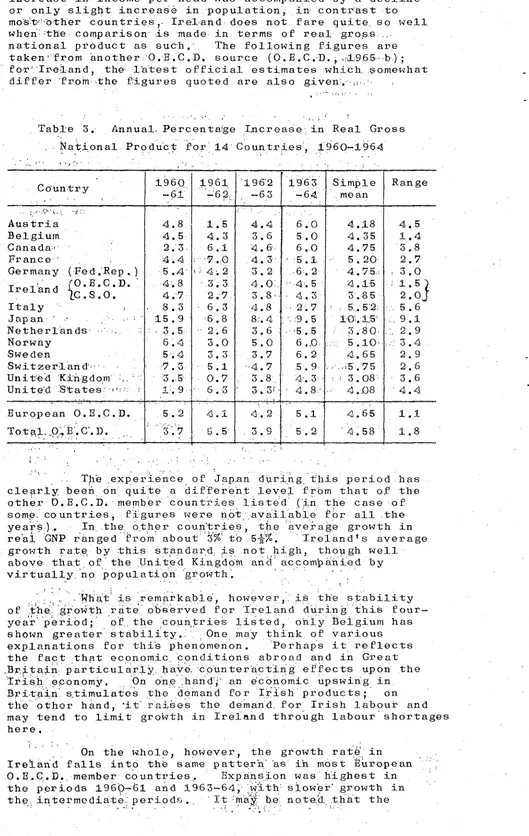
How does Ireland compare with other countries?
According to one O.E.C.D. publication: "For some years, Ireland has ranked among the!fastest growing member
countr.ies of O.~.c.D., measured by the growth of GNP per . head which has averaged over 4 per. cent a year in real terms since 1958". (O,E.C.D., 1965 a, .p.5.) Since the
"In conclusion, ~he overall growth rate of
the WesternEuropean countries which was particularly
increase in income per head was accompanied by a decline
or only slight increase in population, in. contr’ast to
mo~sLtr~bther countries,. Irel=and does not fare quite¯ so well
when" :the comparison is made in terms of real gross ...
national product as such. The following figures a1:e
taken"from another:O.E.C.D, source (O.H.C.-D. ; ,-.i~965,~-b.) ;
~o~"Ir.e;l.and, the..l’atest official estimates which somewhat
differ ’fr:om~..the f:igures quoted are also given:.. ,..
¯C o’un,t r y
Austria
Bel glum
Canada:, "
France~ ,
Germany (.Fed.’Rep.)
rO.B.C D.
rel nd tc.s.o:
Italy ’
Japan, ,
,L ¯. :
Netherlands- .¯":,
::
Norway
Sweden
Switzerland’..
Unit.e[d KiflgdonY .,, = ’
Unite:d S%ates-,’::: :
European O.E.C.D. i
Total ,0%~’, C’. D.
[image:7.574.32.561.61.897.2]i
Table 3. Annual¯ Percenta~ge Increase: in Real Gross
National Produc.t for 14 Countries, .!960-1964
196Q. 1961 196"2 19’63 Simple
:
-61 ... :’~62’., -63
-64 ",mean
4.8
4.5
2.5
4~,4
5.4
¯ 4:.8
4.7
8.5
t5.9
:. 3.5
6;4
5.4
7.5
:3.5
&:. 9
1.5
4.3
6.1
¯
3.3
2.’7
6.3
6.8
- 2:6
3.0
3.3
5.1
0.7
" 6.3
Range
: .. ,.°., ¯ ., .4.4
6.0
4.18
3.6
5.0
4.35
4.6
6,0
4.75
4.3
: :5.$
5,20
3.2
.6:. 2
4.75:
4.0:
: 4:.5 i
:4.1:5
3.8,
4,3
3.85
4.8
2.’7
’ : 5.52:
5.6
8:.4
,:9,5
101i5:
,. 9.1
3.6
.-’5.5
.:. ~.80.
:, 2.9
5.0
6.D, :::
5.10,:
. 3.7
6.2
4.65
¯ .4.7
5.9
: ,,i5~,75
3.8
4’.3
~ : 3.O8
3,3!- ~ 4.8.’ . 4.D8
, :.. ~ ~:., :+ . ...
4.2
5.1
¯ 3.9
5.2
4.5
1.4
3.8
2.7
~3.0
2:
The experience of Japan during this period has
clearly, been on quite a differeht level frbm that o~ the
other O.E.C.D. member countries listed (in the case of
some. countries, figures were n.ot .av.aii"ab!e for all the
yea~:).. In the other countries th.e average growth in
¯ . - 9l:~; " ’ "
re’al GNP ranged ~ro’m’ about 3’%~ t’o 5~%.
Ir elandVs average
growth ra,te by .this st andar.d: is. not.,high, though well
above that of the United Kingdom and’ ac.c0m~nied by
virtuallyno population growth.
What is iremarkabie however i.s t~e stability
:; ;- : ;: " :- ." -: ¯ . ~.. . , . : . ~ .. . ¯ . . 9 , " - , .of the. growth rate observed for "Ireland during"this
four-yea’r: period; 09.. the coun,tries listed, oh!y Belgium has
shown greater stability.. One. may think of various
explanations for thi’s phenomenon. Perhaps it reflects
the fact th.at economic, conditions abroad and in Great
Br.~tain. particular iN.. have.:counteracting e~fects upon the
’Irish .economy. On on:e :hand’S’ an e’conomic upswing in
Bri.tain s, timulates the demand for Irish products; on
t~ie"other hand, ’it raises the demand for irish labour and
may tend to limit growth in Ireiand through labour Shortages
here.
On the ~hole, however, the growth rat~; in
Ireland falls into the same patterh as in most European
O.R.C.D. member countries. Expan6ion was highest in
the periods 1960-61 and i963-64,-olw/th: siower" growth in
the intermedia:te.iperiods~. It:ma~ b.e note, h~ .tl~at the
"
’ ¯
" ¯ .i., ’ - .: ~, -.: . :
" ~::
7
-timing was q~ite different in Canada and the United
States, where the period 1961-62 showed the most favour-able result. The same applies to France, but this is probably only a coincidence.
The forecase growth rate in 1964-65 for the European 0.E.C.D. members as a whole is 4.0~ and for all O.E.C.D. members 4.3~. This prediction reflects the slowing down in the rate of economic expnnsion observed in the second half of 196~ and an expected continuation
of this trend.
3. Econometric models and short-term forecasts.
The application of econometric models to
short-term forecasting, that is to say, forecasting up to one year ahead, has been frequently discussed, recently with application to this country by Menton (1964-65). Some of the discussion has been on the subject of econometric versus other forecasting methods. It is quite clear that short-term forecasting by means of
non-econometric methods is possible, and that in many instances such forecasts have given satisfactory results. If
therefore, one wishes to dismiss econometric models from the realm of short-term forecasting, there is nothing more to be said. If, on the other hand, one believes that econometric models can make a useful contribution to the problem, then the question arises what kind of models can make the most useful contribution and in which circumstances.
The principle of model buikding for an
economy as a whole consists in selecting a number of
endogenous variables characterising economic conditions, the movements in which are to be explained by an equal number of numerical relationships. These relationships are mathematically formulated equations connecting the endogenous variables with each other, with a number of exogenous variables which are taken as determined outside
the economic system analysed here, and ~{ith lagged variables - past values of endogenous or exogenous
variables - which obviously may be taken as given. The
numerical values of the constants appearing in the relationships are estimated by means of statistical methods on the basis of past observations.
For forecasting purposes, the equations are arranged in such a form that predicted values for the
endogenous variables can be successively derived from currentexogenous and lagged variables and from
prediction values for current endogenous variables which have already been obtained. The published figures for lagged variables are then inserted, together with the best estimates for the current exogenous variables that the forecaster can make on the basis of any information
that is available. Predicted values for the current endogenous variables are then obtained as solutions of the prediction equations.
Difficulties arise particularly in connection with the use of current exogenous variables. ~stimates
for these variables cannot be expected to be perfectly accurate but must always carry a margin of error. The
econometric equations themselves are subject to error, whether on account of estimation errors inherent in any
formulation of equation¯s,¯ or~on aceou.nt of changes in the str~ttu’~e~ of the economic system. If inaccurate values
of ex~enb:d~ v.a.ri.ab’!es are. substitute~ into "these equations, the errors may well be multiplied in their effect upon the predictions for the endogenous variables.
* .~ "’ Offe may..escape some Of the difficulties if the
model is fol-mulated in such a way as to contain no
current exogenous variables but only current endogenous
and-lagged variables. A model of this kind, which attempts to explain quarterly changes in personal
consumption, in gross private domestic investment, and in government expenditure plus net foreign investment for the United States in terms of the past alone, was constructedby Oallaway and Smith (1961).
.... ~ . ¯¯Whilst a model of this kind makes ~orecasting one .period .ah~ead.an easy matter, it is clear that a price has. to be paid for this ¯simplification of the
task. Thi.s is shown up by relatively low coefficients of determination in the Oallaway-Smith’.mode!~ amounting to 23, 40 and ~2 respectively in’the three equations. If the fit of the equitions to past .dat9 is not a good
0.ne, they cannot be expected to have a high predictive pbwer for~ ~h~--,fhture~’ ].:]!fid~ed~itwoul-dbe surprising ". if it were otherwise, as the imp!ic.ation would be a very high degree 0f determinism in our economic affairs.
The use of current exogenous variables in the’
equation system seems justified in so far as the variables:.o
are truly exogenous, exerting an influence upon the .-~
endogenous variable but not in turn being influenced by thein. In practice it is not always easy to find an
adequate number of such variables when dealing with macro-economic systems; and the relationships which
exist between the endogenous variables and those variables introduced as exogenous for practical reasons are Often more complex than simple one-way cause-effect relations. Numerical relationships of this kind which are established
may thus have only a limited theoretical value; and it would seem appropriate to judge their usefulness by the practical criterion of their predictive power, indicating the ~extent to which they can help in making forecasts.
In the new approach which is followed here, the distinction between endogenous and exogehous
variables is side-tracked as not being of prima.ry importance. Instead, a distinction is made between
variables predicted on the basis of available information
and va.riables predicted with the help of econometric relationships; ~in these r, elationships, the former set of variables act as’pl~edictor variables for the latter
set ...
No implication. of any cause-effect relationship:.
is th.en co.nta~fned~in the .eq’Uations, but merely one of
ass oci.ation.
; ; " The problem then boils down to finding suitable[:.
predictor variab.le.s, which one may. reasonably hope to be able tO predict fairly accurately by extrapolation or
other simple assumptions, and which at. the same¯ time ’ ~ can make a substantinl contribution¯ towards explaining the changes in the variables which are to, be predicted by.... . - . ; " t " ..
the,,model. As there is usually some information available
about all the vhri@bles, in the system, the: choice of
predi[ctor variables may not be simple and may. permit many
alternatives... ...";" . ". ¯ ¯ ¯ ..
In the model for. ireland t0 be developed here, the problem is taken as involving the forecast one year
9
-the figdres for -thepast year are known in at’ least
P r0visionai form- of"the foliowing national accounts
totals at current .PriCes :
C
personal expenditure.
.
G
.government current expenditure
!
gross fixed investment.
X
expor.ts of goods and services
M
imports .of goods and services
Y
gross national product
The following variables, at current prices, may also be
introduced:
B
s tockbuilding
D
final demand
which’.~ , is defined here as excluding stockbuilding so that
D = C + G + I + X
=
M + Y- B
The variab~ other than B may be converted’into
year-to-year percentage changes written as c, g, i~ xj m, y and
d respectively; thus
c
= 100 (C - C-1)/C-1 etc.
Also the price changes p
national.product may be
m
for imports and py for gross
obtained by the formulae
Pm = 100 (m - m’)/(lO0 + m’)
py = i00 (y- y’)/(lO0 + y’)
t
where mt and y’ are percentage changes for imports or
gross national product at constant prices. Pm and py.
then represent the changes in the implied, price
indices for the national accounts totals.
The change d in final demand is chosen as the
main .predictor variable. The justification for this
choice lies .in the fact that some general indication of
the way final demand is moving is usually available at
the beginning of the year, even though there is no
concrete evidence, for the nume.rical change .in an,y,one
. ¯
of its components. Alternative indicators ’could., o.f
course, have been chosen as for example, the change, s in."
total marked supplies S; defined as .-,
,
:. S
= M ÷ .Y
.
¯
= D+ B
’.’, .
Furthermore, the difference py - pm.!’is.
introduced into the’ eqUations¯ fpr m and y,. as import
Finally, a lagged expression is introduced into each equation; except in the investment equation, the
term cbhsists in a difference between two lagged percentage
changes. These expressions are in the nature of " "
adjustment variables, indicating an adjustment in the opposite direction after a divergence between variables which display a considerable degree of long-term stability
in their relation between each other. For example, an abnormally large increase in consumption as compared with the increase in gross national product in one year may be expected to be followed by a relatively small increase in
the following year, and vice versa.
In the equation for i, the lagged term i f does -i
not represent an adjustment but reflects the cyclical nature of investment in the face of long-term decisions,
thus predicting a large increase ~or the current year from a large increase in the past year.
Data for year-to-year changes from 1948/49 to 1962/63 have been c6mputed from those given by the C:.S.O.
(1964). With their help, the following six equations have been estimated for the predicted changes by
ordinary least squares:
Cp = 1.12 + 0.640 d - 0.157 (c_! - y I) + k g’lD" ’:0.61+: 1.1’50 d - 0.076-(’g..1 -"~" 1]":k~k
ip = -2.41 + 1.041 d + 0.563 i I +~k
Xp -0.39 +. 1.139 d 0.04.3 (X_l - m i) + k
m = -3.45 + 1.808 d - 0.895 (p P Y
[;
yp = 1.33 + 0o700 d + 0.374 (py
- pm) - 0.410 (m_i-d_l) + k
-pm) -- 0.356 (y l-d~.l) + k
Bffectively, the equations are used only to
estimate five differences bet~een the rates of increase in value, since c g i and x must be consistent with
the inserted value’ ’fo~ d.p Consistency is ensured by
the addigi~e correction term k which is the same in all ~quations but varies from year to year. For the 15 years of the observation period, k varies between -1.3 and +!.0.
A coefficient of d equal to I would indicate
that the variable concerned tends to increase
propqrtion-ately with a" higher rate of increase for final demand as ~ whole. The: differences from ! obtained here are not statistically significant but are in the expected
direction. They show that, for example, imports are highly sensitive in the short run to changes in final demand, whilst ,gross national product and consumption are some~qhat ine].astic in the short run. Since t~e ..
national product price rondo to incroase more rapidly than the import price the difforenco between expansion
rates in imports and grooo national product is not as large as would appear to be impiied by the coefficients of d.
The coefficients of i_l and the coefficients of the adjustment Var’iablos also have the oxpect~d sign; > thb~gh fo~ co:nsumption,’government expenditure and exports the nlumerical values are smaller than
11
-Since the individual variables are components
of the explanatory variable d one should expect to find
reasonably high correlations in spite of the extremely
simple nature of the equations. In fact, the
co-efficients of determination obtained in the various
equations lie between o410 for Xp and .774 for yp.
The year-to-year change 1965/64 was not used
in the estimation of the equations but may be used as a
check on their validity; this may serve here as an
illustration of the computational procedure.
From the Second Programme (1965) we obtain
for 1964 the following current price¯ data:
D_I = 597 + 99 + 146 + 32 = 1,164
D -D_i = 63 + 17 + 29 + 39 = 148
thus for 1965/64
d
=" i00 x 148/1,164 = 12.7
Furthermore we have
m’ - m = 48/344 - 34/354 =
3.5
I + m’/I00
y’ - y
=
369/334
-
1.105
=
i12/8~6 - 3i/737
=
9.4
i + y’/1OO ="
768/737
’= 1.042
thus:
Py - Pm = 9.0
- 3.2
=
5.8
.The lagged terms which refer to 1962/63 are:
c-I - Y-1
--
6~8
-
6.zl
=
0.4
g-1 - Y-1
=
8.8
"-
6.~
=
2.4
i 1
=
13.2
X_l - m 1
=
9.2
-
11.6
=
-2.4
m_l - d_l
=
i!.7
-
8.4
=
3.3
Y-1 - d_l
=
6.4
-
8.4
=
-2.0
Substituting all these figures into the
equations, we obtain the following results:
¯ ¯ ": ,,,,
9.2 + k
13.8 + k
18.2 + k
14.2 + k
13.0 + k
But f, rom the 1963 data it follows that .:.
+
gp +
± + 322 x)/l 161i
12.7
p
p
P
since .this is %he increase in total final demand.
Sub-stituting the expnessions for Cp, gp, i and x we find
~. .. ...
,.
p
P
that
..:
12.i ’+ k = 12.7
~-.i ~?’~ " ’~.:¯ ’-’ k ’--
0.6
: . .
Thus the likely expansion rates
consistent with a i~.7~
increase in total final demand
Which the model gives
may be compax:ed with the actual
estimates as follows
c = 9.8
P
gp = 14.zi
i = 18.8
P
x = 14.8
.p
m = 13.6
"pVp = 13.7 -.
c = 10.6
g = 17.2.
i = 19.9
x = 12.1
m = 14.0
y = 13.6
The results of-the regression equations .are in reasonably
good agreement with the actual figures, particularly so
for imports and gross national product.
The~e is no difficulty in. converting the
results into totals at current prices if desired. In
this manner a theoretical figure for stockbuilding is
also::0’bta~i’ned, though:this :cannot be’ expeoted to be
highly accurate as it is merely derived as a residual.
In this case ,
C = 656
-p
G =
11~
- , p.I =
173
p
X = 370
P
D = 1,312
p
C =
660
G
=
116
I =
175
X
=
361
D
=
1,31~
These totals are equal by definition
1~ ;
=
391
" "
M’.,,=
P
Y =
939
. .
P
S =
1,330
-,
P
-} ,
Z92
Y = 938
S = 1,330
¯ ):[:,’r,
These totals are not equal by ¯definition but happen to
coincide exactly so that the figure obtained for
stock-building is also exactly right" in this instance:
B =
18
B =
18
,, . . i"
,’,.’.’i..;’ ’ ’’
~. National accounts for 1965. ,
The econometric model developed here may now be applied to a cdnsideration of prospects for the current year. In ordinary circumstances, this would require an estimate of changes in total final demand and of the difference between changes in import prices and national prodflct p’rice; the model then yields
estimates for changes in final demand components, imports and gross’national product at current prices. With the further help of individual p~ice projections, changes at constafit prices could also be obtained. It would, of course, be possible to make different
estimates based off alternative assumptions. Also it would be possible to adjust the results of the prediction
equations for the purposes of an actual forecast, to make allowance for special.factors ,such as the Dritish impopt surcharge. ,
In thiscase, official 19.65 projections have already been publ:ished for the major nati, onal.accounts ""
data. The task th-us-consists,: in the first instance,. in ascertaining whether the forecast values are
con-sistent with the model equations and wha~ the differences are. In so far as substantial discrepancies are
observed the problem will ~hen: be ,to see whether some reconciliation of estimates is possible.
In the first instgnce, the numerical values
of the lagged terms may be inserted, these are:
c-i - Y-i = 10.6. - I~.6 = -3.O
= 17.2 - lg.6 = 3.6
g-1 - Y-1
i = 19.9
-1
x - m
-1 -1 = 12.1 - 14.0 = -1.9
d = 14.0 - 12 7 = 1.$
m-1 -1 "
¯
i
Y-1 - d-1 = 13.6 - 2.7 = .9,
, .
The prediction equations then simplify to ~he .form
c = I;59 + 0.6~0 d P
gp = -0.88. + 1.’150 d . .
i = 8.79. + :1.041 d P
x = -0.3~ + 1.139 d ,,
P
m = -3.98. + 1,808 d - 0,895 (p P
yp = !.01. + 0,700 d + 0.374 (p
: . : + k
: + k
’ + k
+ k
-: p\) + k
y m"
-’ pm) + k Y
Now the projections imply ’that
d = 7.9
Py - Pm ,i.1 - 2.3 1.8.
.~ i ..i
which come~s .to. -0,8, ~e~"o.bt:a~in ~h~e~ ,following pr, edic~ed
values wh.ic~N.:,may, be. compared, with .the official
pro-jections.:: . -. .~ . . :-~ ¯ ,. ; .... ,rr
" ’ ,..:
C - .=.
5.8
; C, =
,. p . H
... g.,.= , :7.,4 ....
g =
i..-i’.;
=- i6.2
~ ....
P
1, ," ...: . j4 ¯
¯
.
.. :i
..
¯ m = 7.9
,, ,~p
yp = 6.4
6:.0:.
. ’. "7 "".-i -= ".14.3..J
X =
,:5.,8
In =
5.1.
y =
8.3
Thus the pattern of.’i, ffinal .demand Which ±s
on .th:e ha’sis of the model implies a iarg.er
x t =:: ,4.6
P
" ’ m ! =
P
5.3
yp ’, - 2 ..3
c ’ = 2.0
,p
g " =.~ 3.6
P
:i ’ =. i.i.7 "
P
c’t’ = g.9 ...
g’ = 2.3
i". = 9.9
x’ = 2.5.
.mv. = ~ . 7
y’ = ~i.O
The contrast between the two sets of figures
is more striking when seen in real terms than when seen
in money terms. Both sets of figures implicitly
assume an expansion rate in real terms of 4.2~ for total
final demand, combined with a ~.6~ price increase. But
that is~to Say, pr:ice rises~ /ge:envisagNd to lie
bet~ee~~-2¼% for imports and 4% for in ves~men$ and national
product. If these price changes a’re appi’ied to deflate
the predicted value changes in the same waY as the
actual ones, the following picture "is obtained for
volume changes predicted by the model and derived from
official’projections.
¯ "" ’’ , - X.
Pc
=
3.7
pg
=
3.6
= L~.OPi .... i,
PX =
g .2
?.p = 2.g
m
p ,=
4.1
Y
as
expected’
increase i’n:gdvernment expdnditure, inve:stment, and ’; ’
exports and::/ smaller increase in’ c0nNumpti0h"::a’tl’~
currefftpr:iCes than tha~i’envi:s’ag:ed’ i:n~~e ~offih;i~!: ... ’:<
projections. Furthermore, th’e~ati0~s~ sugg.ests a
larger increase in value Of iilbbrts!.ai~"a smaller ....
increase in value "of gross nNtibi~i~:~P~bduct ~han the" ::
published figures.
. ..
15
-the econometric model suggests that a real growth of 2¼~o rather than 49 for gross national product would be :compatible with the assumptions made~ whilst :an
inc~eas4 in import volume of over ~0 is envisage, d in place ’of one Under 3~. Real personal consumption would be expected to increase by2~ instead 0f4~,
with cor ge.sponding modifications for other final demand components.
Ndw it is clearly realised that the model equations must not be taken as exact laws, and the predictions derived thereby cannot aspire to perfect "
accuracy. They just describe, as fa~ as possible, an average experience over the post-war observation period; but each year there have been deviations f~om
that experience} which to some extent tend to produce adjustments in the opposite direction in the following year, Moreover, whilst it is intended to maintain .the basic idea and basic form of the prediction model for some time, the exact mathematical expressi0.ns are subject to modification. It may be possiSle to
improve some of the equations by specific~tion~cl~anges,
i.e. by using somewhat different or additional
variables; and with changes in the’basic observation
period the ffumerical estimates will be revised.
It seems reasonable to expect, in present circumstances, a lower increase in the value of
exports in relation to the increas,e in total final demand. ~ith fixed investment als0 being relatively
somewhat lower, consumption expendit:ure must conversely be relatively .higher. This may well have some bearing
on the ratio of imports to gross national product, imp!ying a somewhat smaller increase in imports and a
somewha~ larger growth of home production than the experience of the past would suggest.
The considerations would suggest for a.n actual forecast adjustments to the results of the econometric model in the direction of the official projections. It is, however, doubtful whether these
adjustments should be as large as .those implied hy the published projections. One of: several things ma~
happen, depending, to some extent on the performance of exports.
On the assumption of an increase in total final demand at current prices by ~I04 mill., the model, suggests an increase in exports of goods and
servlhes by ~29 mill., whilst¯ the .Official ’projections envisage an increase by ~I mill. In the first four months of the year, the level of merchandise exports was disappointingly low, even allowing for the effect
of. the British import surcharge and, perhaps, even
more so, the expectation and: subsequent announcement. : of a reduction in the surcharge rate. A considerable improvement will be necessary to reach even: the ’ moderate official target, to say nothing 0f surpassing it. Unless this is done, the prospect of reaching
the target of a 4~’.increase in real gross national¯ product is not very bright.
If, however~ exports continue to lag, it would appear that a considerably smaller increase in
final demand than glO,& mill. should be envisaged. This would imply lower figures for the i’ncrease in
which even with a £I04 mill. final demand increase are higher than the model projections of £60 mill. and
~38 mill. respectively. Alternatively, if there should
be a sustained boom in consumer demand, it could well lead to inflationary pressure and a greater price rise than the ~.7~ foreseen for personal consumption; this
might well be zl-5~._ i In this case, although the value
increase in gross national product might be near to
official expectations, the volume increase would fall below 4~.
Tlie pure model prediction~ Which makes no allowance for special factors gives an increase in imports of goods and services by £Zl mill. and thus a
rise in the balance of payments deficit by £2 mill. to
£33 mill. If the figure for exports has. to be revised downwards, it seems reasonable to revise the figure for imports in the same direction but to a smaller: extent so that the balance of payments "of deficit may well be ~ven greater. " The official projection of a rise in imports by £20 mill. only may therefore well be an underestimate, and the anticipated £~0 mill. balance of payments deficit may be mildly optimistic.
The Central Bank projections for 1965 are not given in the same detail but postulate a balance of payments deficit which is reduced to £2~ mill.,
accomPanylng an increase in gross national produc’t at current prices by £80 miil. or 8.6% over 1954. To some extent these figures represent targets which should be
aimed :at rather than forecasts of what is actually going to happen. Nith the desirability of securing a high growth rate in combination with a balance of payment near equilibrium one can but concur. Whether such a
desired state can and will be reached in the near future is another~ question.
The truth of the matter is that we do not know yet ho~g to achieve a substantial rate of economic expansion whilst koeping the rise in prices and the
balahce Of payments under control within desired limits. The recent experience of our nearest neighbour co’untgy
has not been ~particularly encouraging in this" respect.
Ireland faces particular difficulties, owing to vulneraSility of exports and to strong dependence upon imports. There may as yet be structural weak-nesees in the country’s industry in so far as there is
insufficieht linkage, and an increased demand in any one sector does not produce a sufficiently high multiplier effect upon the economy but tends to overspill into
imports. This may change in time, but a transformation of industrial structure does not happen overnight. In the meantime, some "strains and stresses must be accepted as the price to pay for economic growth.
5. Final ¯remarks.
The conclusions reached here must remain
very
17
-The limitations of econometric methods for short-term forecasting purposes have been pointed out.
Nevertheless, it must be reaiised that forecasting is only one of several objec:tives and applications of these methods. ~conometric model building ~rie6 to
explain how the economy works; and it is on this
account that an econometric.approach to Irish economic problems is felt desirable, side by side with other approaches.
The modeidescribed here represents only one of many possible ones. It may be modified in the ligh~ of further knowledge gained, and it may be
supplemented by other models’.’ In particular, econo-metric studies may be made on tl~e basis of quarterly data, the importance of which for short-term economic analysis needs, little explanation. On the other hand, relationships of a more long-term character also
deserve further study.
When all is said and done, however, it still seems worthwhile to derive some, conclusions" frDm the model given here. As pointed out, it throws some doubt upon the official projections. In particu!~r, it suggests a somewhat larger balance of payments deficit than the projec,ted £30 mill., and a somewhat lower increase in real gross national product over 1961 t~an ~. . . .
At the same time, these possibilities must be viewed with a sense of p roportion~ A moderate balance of payments deficit, if largely brought about by
deliberate investment from abroad, does not spell economic disaster but may be a natu2al and to some
extent desirable feature. Some slowing down in the growth rate would be no more than in accordance with expected developments in other countries; when
circumstances again permit a big ,spurt in exports, .the prospects for economic expansion will be enhanced
~eferences.
At,wood, B. A. and ~[oss, M., (1964) Forecast of Agricultural Output !966, Appendix to Economic
~esearch Institute Paper No 21, Dublin.
Bane Ceannais na hEireann (1965), Faisneis ~aithiuilt Aibrean 1965.
Central Statistics Office (1964), National income and expenditure 1963, Dublin.
. Galla~4a~$, L.B. and. Smith, P.E. (1961), "A
q~arterly econometric model of the United StateS", Journal of the American Statistical Association,
Vol. 5G, pp.379-383.
Leser, C.E.V. (±964), The Irish Econemy in 1963 and 196~, Economic Research Institute, Paper No 2X, Dublin.
Menton:, B. (:!98~]~65), "Short-term economic
forecasting", Journal of the StatiGtical and Social : Inquiry Society of Ireland, llSth session (in press).
Organisation of ~conomic Cooperation and
Development (1965 a), ’Economic Surveys - Ireland, Paris.
do. (~.65~q b), "Economic Prospects in 1965"
O.~.C.D. Observer, No 14, February 1965, pp:,i2"i3.