13
Chapter
2
Radiometric Correlation to Sulphur and Iron Content at BM-179 Kalan-West
Kalimantan Uranium Ore
Rachmat Sahputra1,a
1Department of Mathematics and Science Education, Tanjungpura University Ahmad Yani Street in Pontianak, Indonesiaa[email protected]
Abstract. The research aims to determine the correlation radiometeric against sulphur and iron content and its association with uranium content of BM-179-Kalan-West Kalimantan’s uranium ore. The sample selection method using a ROS tool–NF-SPP; enrichment of sulfide minerals using flotation preparation; Iron content determination using with AAS-Spectr-AA-20(λ=248.3 nm) analysis; uranium content through spectral uranyl- Br-PADAP(λ=574 nm) analysis; sulphur content determined by ESCHKA modification method. Results of the study is a linear correlation between the radiometric uranium content to follow the equation y1=3,5408x+1867.3; sulphur content decreased with radiometric increasing with the equation y1 =-0,8345x+18926; iron content decrease to radiometric increase with the equation y2=-1,351x+31261. Increased sulphur content followed by iron content increase with trendline y1= 1,3175x2 + 5601. The results can be found that the ore will have a high uranium content with a minimum sulphur content in radiometric≥4000 cps, and a high uranium content with a minimum iron content at radiometric≥6000 cps.
Keywords: BM-179-Kalan uranium ore, ESCHKA, radiometric correlation, iron, sulphur.
I.
Introduction
BM-179 uranium ore is an ore sampel from the tunnel at a depth of 179 meters that are in Kalan, Ela Sub- district, Melawi District, West Kalimantan Province. The ore is precisely located in the hill Eko-remaja sector. To reach this location can be reached by air or land as far as ± 500 km to the East from Pontianak to Nanga Pinoh City, followed by ground vehicle through the timber company road along ± 70 km to the south.
Uranium ore from the Eko-Remaja-Kalan sector is still not used by the Indonesian government for various purposes related to energy, whereas in this sector have a high enough uranium reserves with a reserve of about more than 12409 tonnes of U3O8[17].
BATAN has made exploration tunnel along the 618 meters at the Eko-remaja sector for the purposes of research and development of nuclear energy. BATAN has succeeded in processing BM-179 ores becomes "yellow cake" (U3O8) at various stages of processing, starting from the physical preparation, leaching, solid-liquid separation, purification and precipitation.
14
Research related to the physical chemistry characteristics of the transition and sulfide elements present in the BM-179 Kalan-West Kalimantan uranium ore has not been widely known and yet to be published. Therefore, this study was intended to determine the radiometric correlation against sulphur and iron content and its relevance to the content of uranium in BM-179 Kalan-West Kalimantan uranium ore.By knowing the correlation between the elements content present in the BM-179 Kalan uranium ore, the next benefit of the data results obtained can be used to assist decision-making related to uranium exploration in Kalan-West Kalimantan and streamline all phases of exploration and exploitation activities in the future.
Implementation of this study to analyze and find correlation to the content of potential elements such as uranium, iron and sulfide through ROS (radiometric ore sorting) on BM-179 Eko-remaja Kalan West Kalimantan uranium ore.
The method used for the sample selection used ROS (radiometric ore sorting) by means of SPP-NF, for the enrichment of sulphide mineral conducted with flotation preparation method, to determine the iron element content is analyzed by atomic absorption spectroscpy (AAS) method, and to observe the uranium content used spectrophotometers, as well as for the sulphur content determination is used gravimetric method.
II.
Procedure
2.1. Equipment and material experiment
The equipment used is a furnace, metal / glass pipe / heat-resistant rubber, condenser, thermometer, oven, ph-meters, glassware (test tube, beaker Glass, measuring cup, erlenmeyer, pipette, etc.), heater, grandsaw, jaw crusher, disk milk, mortar grinder, -65 mesh sieve, flotation apparatus, goach cup, spectrophotometers, AAS.
Materials used are examples of BM-179-Eko remaja-Kalan uranium ore, oxygen gas, pure sulphur, litmus paper, Whatman filter paper # 42, ascorbic acid, triethanolamine, ethyl xantat 10%, NKY-SNB, fine oil , coarse filter paper, asbestos, methyl isobutyl ketone, HNO3, concentrated sulphuric acid, TOPO, Fe2(SO4)3, U3O8and H2O2, amyl xanthat, Na2CO3, ZnO, BaCl2 10%, 2,5N KOH, HNO3 (6: 1), HF concentrated, universal litmus paper, alcohol, 2.5 N HNO3, ascorbic acid 5%, 2% NaF, Br-Padap 0.05%, concentrated HClO4, HCl (1: 1), the standard elements of the brand Titrisol (U, Fe), asetilene.
1) Flotation preparation: A total of 500 grams of BM-179 ore with mesh size 65, added water to produce pulp percent solid 30%, included in the German Wedag flotation tool using rpm 1400. Pulp stirred while at pH 8 with 10% sodium carbonate. Furthermore added promother xanthat reagent much as 0.15 mL Ana amyl and fronther pine oil as much as 0.05 mL and left stirred for 5 minutes. Float concentrate separated carefully at the reservoir. The time of separation is done 10 minutes. Furthermore, the concentrate was filtered, the solids are heated in an oven and weighed and analyzed further.
15
2.2. Iron analysis using an atomic absorption spectroscpy1) Preparation of standard solution: Fe standard solution is made of standard elements Titrisol brands. Standard Fe dissolved in 1000 mL volumetric flask with distilled water.
2) Analysis of iron: Created standar solution series in 0; 0.5; 1; 2; and 5 ppm of iron standard solution parent, measured by AAS Varian Spectr AA-20 Plus using Fe lamp
56-100027-00 No.JT574 series, photomultiflier 421.8 volts, the wavelength of 248.3 nm, slit width of 0.2 nm , flate-asetilene air, asitilene flow of 1.5 L / min with a flame oxidation.
2.3. Product Specification and Controls
1) Preparation of solution: (a) TOPO weighed 19.28 grams of TOPO dissolved in Cyclohexane, diluted to 1 liter, so get 0.05 M TOPO solution; (b) 5% solution of ascorbic acid; (c) Complex solution I: 25 grams titriplex IV, 5 grams NaF and 65 grams sulfosalicilat acid dissolved in 800 ml of distilled water while stirring. Added NaOH solution is added gradually until pH = 8.35, then the solution is diluted to 1000 ml with aquadees; (d) Solution Complex II. One part of complex solution diluted with one part distilled water, then the pH is set to be 8.35 with 40% NaOH; (e) buffer solution pH=8.35: as much as 149 grams (134.04 ml) of triethanolamine dissolved in 800 ml of distilled water, neutralized with HClO4to pH 8.35 and kept overnight, next day pH was adjusted back to 8.35 with HClO4, diluted with distilled water to 1 liter; (f) Br-Padap 0.05%: Br-Padap 0.5 grams dissolved in one liter of alcohol.
2) Analysis of Uranium: (a) Weighed 2 g sample of ore that has been finely ground, put in a teflon beaker. Added 30 ml HClO4+ HNO3 (6: 1), and concentrated HF. The solution was slowly heated on a hot plate for 1 hour while closed. Then dried at temperature 250 °C to form a paste. Paste dissolved with 2.5 N HNO3, put in a 50 mL volumetric flask; (b) 1 mL pipette inserted into the shake flask, added 2 mL 5% ascorbic acid, 2 mL 2% NaF and 5 mL of 0.05 N TOPO. The mixture was shaken for 2 minutes, then allowed 5 minutes to separate the organic phase from the aqueous phase well; (c) pipette 2 ml of the organic phase, put in a 25 mL volumetric flask, then added 1 ml solution of complex II, 1 ml of buffer solution pH 8.35, and 2 ml of Br-Padap 0.05%. At each addition of the reagent, the solution was shaken well. After 10 minutes, added alcohol so that the solution exactly 25 mL. Uranyl spectrum-Br-Padap measured with a spectrophotometer at a wavelength of 574 nm, blank worked as an example.
2.4. Sulphur Determination by the modification ESCHKA method
16
III.
Equations
Absorbance was measured using Atomic Absorption Spectroscopy using the equation:
A = -log T (1)
Where
A = Absorbance T = Transmission
Beer's law states that the absorbance is directly proportional to the thick solution I dI
− ∫ n dS
Io I = ∫0 S (2)
Where
I = Reduction intensity
S = cross-sectional area that absorbs particles
Absorptivity and molar absorptivity measured by the equation:
A =*b.*c (3)
Where:
A = Absorbance
= constant absorption b = bold solution
c = concentration of the solution
In the settlement equation using non-homogeneous linear equation:
a1x1 + ... +akxk = b (4)
With a1, ... , ak value of R, to be able to determine menentukan x1, ... , xk with values of R, and, if present, will give an answer. The results are obtained if b belongs to the ideal value generated by a1.
Sulphur content can be obtained from the determination of the weight of BaSO4 prior with ESCHKA modification method, further calculations are:
Contents of (SO4)2- (in %) = [((SO4)2- / BaSO4) x Weight BaSO4x 100%] / Heavy example.
Contents of S (in %) = [Weight Atom S / Molecular Weight (SO4)2-] x % (SO4)2- (5)
IV.
Results and Discussion
The content of sulphur and iron elemental in BM-179 Eko-remaja ore is a major potential element in addition to the uranium. Analysis results of the lowest radiometric elemental average for 75 cps sulphur content was obtained 23452 ppm and an iron content is 40309.6 ppm whereas the uranium content is 470 ppm, whereas for the highest radiometric average of 10000 cps was obtained at sulphur content is 11450 ppm, the iron content is
17
Iro
n
(p
pm
)
Co
nt
en
to
fS
ul
fu
ra
nd
Iro
n(
pp
m
)
The results showed that the higher the radiometric of BM-179 Kalan ore have greater uranium content, while the sulphur and iron content showed that the higher the radiometric BM-179 ore containing lower sulphur and iron content.
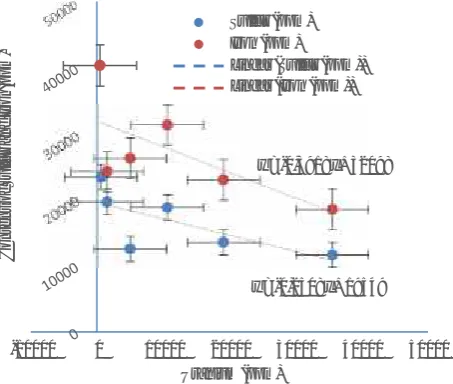
Such correlations can be presented in Figure 1 where the x-axis is the uranium content and the y-axis is the sulphur and Iron content.
Sulfur (ppm) Iron (ppm) Linear (Sulfur (ppm)) Linear (Iron (ppm))
y = -0,3918x + 32098
y = -0,2508x + 19549 -10000 0 10000 20000 30000 40000 50000
[image:5.595.194.421.147.339.2]Uranium (ppm)
Fig 1. Graph uranium content of the sulphur and iron in BM-179 Kalan-West Kalimantan uranium ore
Figure 1 shows that the rise in uranium content will be followed by a decrease in sulphur and iron with trendline follow linear line equation y1 = -0,3918x + 32098, where y1zz is the iron content and x is uranium content with a constant of iron content is 32098 ppm, whereas for the content sulphur follow trendline follow linear line equation y2 = -0,2508x + 17328, where y2 is sulphur and x is uranium content with the constant of sulphur content is 19549 ppm.
Correlation between sulphur and iron content in BM-179 Kalan West Kalimantan uranium ore show the relationship is directly proportional, meaning that the higher sulphur content and the higher the iron content contained in the ore. The relationship between sulphur and iron can be presented as Figure 2.
50000 45000 40000 35000 30000 25000 20000 15000 10000 5000 0
Iron Linear (Iron)
y = 1,3175x + 5601
[image:5.595.185.422.511.697.2]0 5000 10000 15000 20000 25000 30000 Sulphur (ppm)
18
Th
e
co
nt
en
to
ft
he
El
em
en
ts
(p
pm
)
Figure 2 shows that the higher sulphur content will be followed by an increase in iron content by following the trendline linear line equation follows y1 = 1,3175x2 + 5601, where y1 is the iron content and x2 is the sulphur content, with constant of iron concentration is 5601 ppm.
The linear equation indicates that, in the BM-179 Kalan West Kalimantan uranium ore has a tendency relationship between the sulphur and iron content is the iron content has 1.3175 times larger than the content of sulphur. This indication may give the hypothesis that the BM-179 uranium ore has an iron compound which is quite high. There are many possibilities existing iron compounds, in addition to combining with sulphur to form
pyrite and iron (II) sulfide, can also form oxides in the form of hematite, limonite and magnetite, or to form carbonate compounds such as siderite, but it can form compounds such as silicates like taconit. Existing sulphur compounds can also be fused with uranium to form uranyl disulfide.
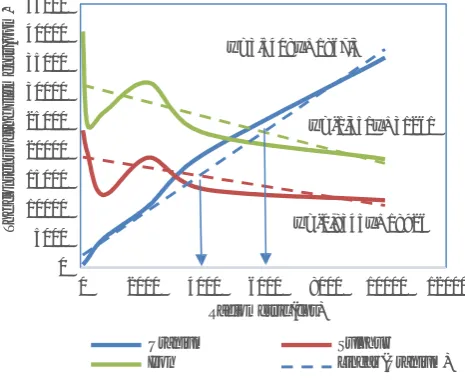
Radiometric relations with uranium content, sulphur and iron can be presented as Figure 3 below.
45000 40000 35000 30000 25000 20000 15000 10000 5000 0
y = 3,5408x + 1867,3
y = -1,351x + 31261
y = -0,8345x + 18926
0 2000 4000 6000 8000 10000 12000 Radiometric (cps)
[image:6.595.183.416.247.437.2]Uranium Sulphur Iron Linear (Uranium)
Figure 3. Graph relations of radiometric (cps) with a content of uranium, with sulphur and iron, and with sulphur and uranium.
Figure 3 shows that the content of uranium radiometric direct proportion to the equation y = 3,5408x + 1867.3, where y is the content of uranium and x is large radiometric, the higher radiometric information will be higher levels of uranium. Sulphur content follows the equation y=-0,8345x + 18926 against radiometric number, the higher radiometric provide information that will be even lower sulphur content. And Iron content to follow the equation y = -1,351x + 31 261 to the number of radiometric, meaning that the higher radiometric provide more information to low iron content. Figure 3 also provides information that intercept uranium and sulphur content shown on radiometric 4000 cps, so as to obtain a high uranium content in BM-179 Kalan West Kalimantan ores to minimize sulphur is at radiometric greater than or equal to 4000 cps. Intercept between uranium and iron content shown on radiometric 6000 cps, so as to obtain a high uranium content in the BM-179 Kalan West Kalimantan ore with an iron lies in the radiometric far greater than or equal to 6000 cps.
19
V.
Conclussion
The higher radiometric of BM-179 Kalan West Kalimantan uranium ore showed increased levels of uranium, therefore radiometric of BM-179 is directly proportional to the uranium content follows the equation y = 3,5408x + 1867.3, where y is the content of uranium and x is large radiometric.
The lower the sulphur content with increasing radiometric follow the equation y = -0,8345x + 18926. The iron content reduction of the radiometric will follow the equation y=-1,351x + 31261. The higher sulphur will be followed by an increase in iron content by following linear trendline equation y1= 1,3175x2+ 5601, where y1is the iron content and x2is the content of sulphur, with constant iron content is 5601 ppm.
High uranium content in BM-179 Kalan West Kalimantan ores with to minimize sulphur is at radiometric greater than or equal to 4000 cps, high uranium content to minimize iron can be obtained at radiometric greater than or equal to 6000 cps.
Apendix
Appendix of results radiometric data of the analysis correlation with uranium, sulphur and iron content in bm-179 kalan west kalimantan uranium ore
The elements are analyzed in this study are the elements that are considered potential of major mineral include: sulfur, iron and uranium. Data analysis has been done may look like Table 1. Appendix A.
Table 1. Appendix A. The results of radiometric data and the uranium content, sulphur and iron in BM-179 Kalan-West Kalimantan ore
No
Central point Radiometric (cps)
Uranium Sulphur Besi
(ppm) (ppm) (ppm)
1 75 470 23452 40309,6
2 225 1421 19648 24374,6
3 750 4919 12373 26413,7
4 2250 10595 18781 31552,3
5 4000 19213 13413 23055,7
6 10000 35842 11450 18489,2
References
[1]. Douglas A. Skoog; Donald M. West; F. James Holler; Stanley R. Crouch, “Fund amentals of Analytical Chemistry”, 8th Ed, 2003
[2]. Dean Calloway,“Beer-Lambert Law”, J. Chem. Educ., 1997, 74 (7), p 744.
[3]. Herman A. Liebhafsky and Heinz G. Pfeiffer; “ Beer's law in analytical chemistry”, J. Chem. Educ., 1953, 30 (9), p 450
[4]. D. F. Swinehart,“The Beer-Lambert Law”, J. Chem. Educ., 1962, 39 (7), p 333
[5]. Ingle, J. D. J.; Crouch, S. R.,”Spectrochemical Analysis”. New Jersey: Prentice Hall, 1988. [6]. L. Liua and I. Neretnieksa,“Sensitivity Analysis of Uranium Solubility Under Strongly Oxidizing
20
[7]. Owen T. Butler,; Warren R. L. Cairns; Jennifer M. Cook and Christine M. Davidson, “2014 Atomic Spectrometry Update–A Review Of Advances In Environmental Analysis”, Journal Anal. At. Spectrom., 2015.[8]. Geoffrey R. Loftus,; Martin A. Oberg,; and Allyss M. Dillon, “Linear Theory, Dimensional Theory, and the Face-Inversion Effect”, Psychological Review by the American Psychological Association, Vol. 111 (4), p.835- 863, University of Washington, 2004
[9]. Gribble,C.D.,“Rutley’s Elements of Mineralogy”, 27 -th Edition, London:Unwin Hyman, 1988. [10]. John Emsley, “Nature’s Building Blocks: An A-Z Guide to the Elements”, 2nd Edition, New
York: Oxford University Press, 2011.
[11]. Klein, Cornelis and Cornelius S. Hurlbut, Jr., “Manual of Mineralogy”, 20th ed., Wiley, 1985. pp. 307–308 ISBN 0-471-80580-7
[12]. Burns, P.C., and Finch, R, “Reviews in Mineralogy, Uranium: Mineralogy, Geochemistry and the Environment.”, Mineralogical Society of America, Vol. 38, U.S.A.:Washington D.C., 1999, ISBN 0-939950-50-2
[13]. Anthony, John W.; Bideaux, Richard A.; Bladh, Kenneth W. and Nichols, Monte C. (ed.). "Uraninite, Handbook of Mineralogy”, Mineralogical Society of America, US: Chantilly, VA, 2011, ISBN 0-9622097-2-4.
[14]. Affandi, K.; Susilaningtyas; Tjokrokardono, S. dan Sastratenaya, A.S., “Laporan Internal Bidang Pengembangan Teknologi PPBGN: Status Pengolahan Bijih Uranium Eko remaja Kalan”, Jakarta: BATAN, 2001.
[15]. Rifrandiyah, E.; Pudjianto R., “Laporaan Hasil Penelitian BATAN 1992/1993: Penentuan Kondisi Optimal Pelindihan Bijih Uraium Tipe BM-179 (TS-IV)”. Jakarta: BATAN, 1993.
[16]. Affandi, K., “Scientis Exchange Program 1992/1993: Pretreatment and extraction of Uranium from Refractory Uranium Minerals”, Japan: PNC, Ningyo Toge Works, 1993.