Full Length Research Article
A COMPARISON OF ARTIFICIAL NEURAL NETWORK AND DECISION TREE FOR
PROFITABILITY IN TECHNOLOGY SECTOR
Mehmet Nuri İNEL, *Serkan ETİ and Hakan YILDIRIM
Department of Quantitative Methods, Marmara University, Istanbul
ARTICLE INFO ABSTRACT
Profitability is always amain consideration for businesses. Business and academicians have researched in order to determine the factors affecting profitability due to the importance of this issue. In this study, return on assets is modeled and compared with two different methods. Artificial Neural Network and Decision Tree are established with financial Statements of technology sector on BIST (Borsa Istanbul). The two models were evaluated in the study. Their strengths relative to each other were determined.
Copyright©2016, Mehmet Nuri İNEL et al. This is an open access article distributed under the Creative Commons Attribution License, which permits unrestricted use, distribution, and reproduction in any medium, provided the original work is properly cited.
INTRODUCTION
A main purpose of business is to get the profit. Therefore, it is important to know the profit and profitability. For business, to explain and modeling profitability is gaining importance day by day due to increasing competition. Factors which are explaining profitability are wanted to know. In the study, we will be modeling profitability with artificial neural network and decision tree methods. We have used financial data for two models. Financial analysis searched relationship between items in financial statements. Nissim and Penman made analysis with 38-year data of manufacturing business is traded on the New York Stock Exchange. In this study, the impact on profitability of the commercial and financial debt was investigated (Nissim and Penman, 2001). Between profitability and dept / equity ratio was shown to be a negative correlation (Eritos and Neokosmides, 2002).Stock price estimates with artificial neural network. As a result of this study, artificial neural network's modelling is better result than linear regression (Tektaş and Karataş, 2004). The natural logarithm of total of sales was found to have a positive effect on profitability (Chen and Zhau, 2005).
*Corresponding author: Serkan ETİ,
Department of Quantitative Methods, Marmara University, Istanbul.
Return on equity's analysis was made by regression on technology companies traded in Turkey stock exchanges and NASDAQ. In result of this study, return on equity is affected most profit margins and asset turnover (Ege and Bayrakdaroğlu, 2007). Analysis was made over tourism companies. In this analysis, asset size, market share, capital, receivables turnover, stock turnover and asset turnover in effect on return on assets was examined (Karadeniz and İskenderoğlu, 2011).Companies are classified according to industry and service sectors using CHAID algorithm with financial data (Albayrak and Yılmaz, 2009). Dreiseitl and Ohno-Machado established was compared logistic regression and neural network's modelling (Dreiseitl and Ohno-Machado, 2002). Profitability is classified to be well or bad with financial performance. In this study, decision tree analysisis used (Koyuncugil and Özgülbaş, 2008). Decision tree, linear regression and artificial neural networks were compared on a same sample (Kim, 2008). Artificial neural networks are used to estimate the stock price. Studies have shown that the more successful performance than regression analysis (Karaatlı, Güngör, Demir and Kalaycı, 2005). A study has examined the financial situation of small company how they can do their own financial statements (Bodur and Aktan, 2006). Profitability of service and industrial companies is worked and found that profitability is affected 18 variables (Albayrak and
ISSN: 2230-9926
International Journal of Development Research
Vol. 06, Issue, 07, pp.8417-8421, July,2016
DEVELOPMENT RESEARCH
Article History:
Received 15th April, 2016 Received in revised form 26th May, 2016 Accepted 14th June, 2016 Published online 31st July, 2016
Key Words:
Profitability, Financial Ratios, Decision Tree,
Akbulut, 2008). Share certificates in insurance sector have been estimated with artificial neural networks. In particular, a high degree of success has been estimated for first month (Akcan and Kartal, 2011).
Technology sector in the world and turkey
Companies have been active in different areas like as industrial, service, technology, etc. Together with development of technology, companies began to benefit from advanced technology and equipment. Technology sector which is conducting activities on these technologies began to gain importance with each passing day. The sector has become a growing sector in the world and Turkey. Technology sector in the Turkey reached 83.1 billion TL by 18 percent growth in 2015. Research is expected to grow between 15-20% for this sector in Turkey (TUSIAD report, 2015). In 1980, the developments in information and communication technology offered many opportunities to business community. The share of trade of technology sector showed a very rapid increase until the 2000s. After the 2001 crisis, the sector recovered and time of sector was observed to 19% growth rate over. In the 21st century, developments have gained speed. Technology has increased importance of development due to current developments in this sector and other sectors. Information and technology became important to all sector in world countries, especially in economy (Bulu, Eraslan and Kaya, 2006; Aydın, 2012).
Financial structure
According to the Turkish Language Institution, profit is pecuniary gain provides shopping, advantage and benefit. As economic and financial, profit is entrepreneurs' part gets from production. As trade, mean of profit is difference between cost price and sale price. Profitability is also situation of profitable according to the Turkish Language Institution (TDK, 2016). Profit is an amount in currency but profitability is a rate (Bekir Baykara, 1994). Financial analysis includes process that is establishment, measured and interpreted of relationship among items in the financial statements. Analysis provides making predictions about future of a company by examining performance of this company in history and current period. Financial analysis is selection, evaluation and interpretation of financial data in process of investment and financial decision-making (Aydın, Şen and Berk, 2012; Drake, 2016; FinansalYönetim, 2012). When studies on profitability are investigated, several different variables are reached. Some of those, are obtained from financial statements, are selected. In table 1, the variables and formula of the variables in the study are given from literature (Korkmaz and Karaca, 2014; Oruç, 2009; Karadeniz and İskerdoğlu, 2011; Eriotis, Frangouli, Ventoura-Neokosmides, 2002; Tugas, 2012; Akhtar, 2004; Kısakürek and Aydın, 2013; Omran, 2004; Akbulut, 2011; Okuyan, 2013; Chen and Zhao, 2005; Karaca and Başcı, 2011). There are 17 variables in table. One of them is the dependent variable of the study.
METHODS
We have used financial data for two models. There are ten companies in technology sector on BIST. We select nine
companies and take the financial data of their 2007-2015 years. Because a company's financial data is not attainable and homogeneous data set is being necessary. Decision tree and neural networks were compared on same sample. In the next chapter we will touch these two methods and their results will be discussed.
Artificial neural network
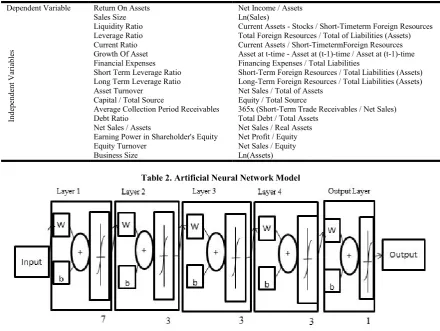
Artificial neural network is a computer-based system which is modeling and matching output and input sets. On the basis of artificial neural network are neurons. Neurons are connected to each other with updatable weights. Neural cells have basically input data from output or other neural, weights, activation functions and output. Artificial neural networks are also created by combination of these neurons. Artificial neural network consists input, output and secret layers (Akcan and Kartal, 2011; Haykin, 2005; Altman, Marco And Varetto, 1994). According to network structure, there are two type artificial neural networks: feed-forward and feed-back. In the feed forward-neural networks, input and input's weights are calculated and then, the results of this function are transferred to next layer. The process is stopped when it arrives on secret layer. However, it is sometimes connected to the previous layer in feedback neural network. An output of feedback neural network is connected other every neuron's input (Haykin, 2005). In this study, profitability model have been established with artificial neural networks by MATLAB R2015. Data set have been partitioned 80 to 20 percent for testing and learning stages.16 samples of the 81 pieces in data are separated by systematic random sampling for testing. Network is selected as feed-forward in MATLAB. It was determined five layers for neural networks model in the study, so that first layer has seven, another layers have three neurons. This is the most optimal as a result of the experiment. Tansig function is selected because there are negative values in the data. For the output of the model and actual values are compared, when the model results and actual values are graphed, R-squared value is found as 0, 9257 (Uğuz, 2016).According to this value, compatibility of the model can be said to be very good.
Decision tree
Step 1: For each independent variable X, Y dependent variable taking into account, category-pair has less important or largest p-value is found.
Step 2: is compared with the predetermined value.
Step 3: P-values are calculated with suitable Bonferroni correction for variables.
Step 4: Adjusted argument with the smallest p-value is chosen
[image:3.595.76.521.71.415.2]as the most important variable and compared with .
Table 3. Graphic of Artificial Neural Networks Real and Estimates Values
In this study, decision tree model was established with SPSS 20. Decision tree analysisused eight of sixteen independent variables. These variables picked in the decision node. The variables are net sales/ asset ratio, current ratio, liquidity ratio, earning power in shareholder's equity, financial expense ratio, sales volume, average collection period of receivables and shareholder's equity turnover ratio.
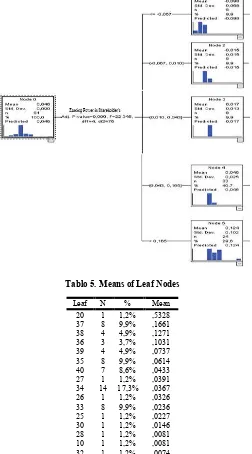
CHAID algorithm used earning power of equity for main part. This variable was made with five sections. In decision tree, the leaf nodes are obtained after one or more decision node(s). Finally, decision tree analysis obtained by CHAID algorithm has twenty eight leaf nodes. The average value for each leaf
node is predictive value in this partition. Example, 20thleaf
node can be reached by looking two variables. These variables are earning power in shareholder's equity and sales size. If earning power in shareholder's equity is greater than 0,165 and sales size is less than 15,259, the leaf node is obtained. The predictive value of this leaf node is 0, 5328 for return on assets. The number of samples in this leaf node (N) is 1 and this is 1,2% of the data set. Similarly, other leaf nodes can be examined. For other leaf nodes, it is possible to look another decision nodes and variables. There are 28 leaf nodes in total in the decision tree analysis. The predictive values of these leaf nodes are given in the table 5.
RESULTS AND DISCUSSION
[image:3.595.78.519.80.411.2]A main purpose of business is to get the profit. Therefore, it is important to know the profit and profitability. For business, to explain and modeling profitability is gaining importance day by day due to increasing competition. In this study, decision tree and neural networks have been focused. Decision tree analysis used CHAID algorithm in the model and it is used in eight variables in the partitioning process. CHAID algorithm is determined to earning power in shareholder's equity first partitioning and divided into five main categories.
Table 1. Dependent and Independent Variables and Theirs Formula
Name Of Variable Formula Of Variable
Dependent Variable Return On Assets Net Income / Assets
Indep
endent
Vari
ables
Sales Size Ln(Sales)
Liquidity Ratio Current Assets - Stocks / Short-Timeterm Foreign Resources Leverage Ratio Total Foreign Resources / Total of Liabilities (Assets) Current Ratio Current Assets / Short-TimetermForeign Resources Growth Of Asset Asset at t-time - Asset at (t-1)-time / Asset at (t-1)-time Financial Expenses Financing Expenses / Total Liabilities
Short Term Leverage Ratio Short-Term Foreign Resources / Total Liabilities (Assets) Long Term Leverage Ratio Long-Term Foreign Resources / Total Liabilities (Assets) Asset Turnover Net Sales / Total of Assets
Capital / Total Source Equity / Total Source
Average Collection Period Receivables 365x (Short-Term Trade Receivables / Net Sales) Debt Ratio Total Debt / Total Assets
Net Sales / Assets Net Sales / Real Assets Earning Power in Shareholder's Equity Net Profit / Equity Equity Turnover Net Sales / Equity
Business Size Ln(Assets)
[image:3.595.38.293.533.652.2]Table 4. First Partitioning with CHAID Algorithm
Tablo 5. Means of Leaf Nodes
Leaf N % Mean 20 1 1,2% ,5328 37 8 9,9% ,1661 38 4 4,9% ,1271 36 3 3,7% ,1031 39 4 4,9% ,0737 35 8 9,9% ,0614 40 7 8,6% ,0433 27 1 1,2% ,0391 34 14 17,3% ,0367 26 1 1,2% ,0326 33 8 9,9% ,0236 25 1 1,2% ,0227 30 1 1,2% ,0146 28 1 1,2% ,0081 10 1 1,2% ,0081 32 1 1,2% ,0074 31 1 1,2% ,0070 29 1 1,2% ,0069 13 1 1,2% ,0038 9 1 1,2% -,0105 14 1 1,2% -,0113 12 1 1,2% -,0220 15 1 1,2% -,0275 11 1 1,2% -,0297 24 2 2,5% -,0307 8 1 1,2% -,0320 23 5 6,2% -,0964 7 1 1,2% -,2397
After that, these five main branches were branching with the help of other variables. It was the most suitable tree model of return on assets. When we look at the decision tree model, variable criteria are different according to followed path. As it can be analyzed on two variables in decision tree analysis, it can be analyzed on more than variables. There is no reduction in the number of independent variables in the neural networks analysis. Therefore, all of the variables are used in the model.
When installing the model of artificial neural networks, the number of layers and the number of neurons in these layers must be determined. In this study, as a result of tests, five-layer model is chosen as the most suitable which is including four secret layers and one output layer. Due to the lack of a fixed number of layers and precise rules, making tests are required to determine neural network model. It is not possible to give meaning of weight in layers. This avoids also the interpretation of the model. But it is successful to obtain values close to the actual values. In process of decision making, if reduction of dimension is not needed or wanted, artificial neural networks may be preferred. In this method, all variables can take position. If reduction of dimension is needed or wanted, decision tree analysis would be more appropriate. This analysis comes to the forefront partitioning. When decision maker wants to give more importance to the partitioning, he could see it as preferable. Decision tree analysis is expressed profitability with eight variables, but artificial neural networks are with sixteen. Decision treeanalysis allows reduction on variables, but artificial neural networks cannot. It uses all variables. Decision tree analysis is simple to interpret. It can be interpreted on leaves and branches. However, artificial network model can't be interpreted and explained. Results of neural network are very close to actual values. This can chosen reason of neural network. Artificial neural network is successful about results. As a practice, technology sector was discussed. Testing applied to other sectors is expected to be subject of future studies. Decision tree analysis was used CHAID algorithm in this study. Using algorithms running on continuous data except CHAID is expected to be subject of future studies. Similarly, using feed-back network model in artificial neural network is expected to be subject of future studies.
REFERENCES
Akbulut Ramazan, 2011. İMKB’de İmalat Sektöründeki İşletmelerde İşletme Sermayesi Yönetiminin Kârlılık Üzerindeki Etkisini Ölçmeye Yönelik Bir Araştırma, İstanbul Üniversitesi İşletme Fakültesi Dergisi, Vol 40, No 2
Akcan Ahmet, Kartal Cem, 2011. İMKB Sigorta Endeksini Oluşturan Şirketlerin Hisse Senedi Fiyatlarının Yapay Sinir Ağları İle Tahmini, Muhasebe Ve Finansman Dergisi Akhtar Shumi, 2004. Australian Multinational And Domestic
Corporations Capital Structure Determinants.
Aktan Bora, Bodur Bora, 2011. Oranlar Aracılığı İle Finansal
Durumunuzu Nasıl Çözümlersiniz?, Journal of Yasar
University, Cilt 1, Sayı 1.
Albayrak Ali Sait, Akbulut Ramazan, 2008. Kârlılığı Etkileyen Faktörler: İMKB Sanayi ve Hizmet Sektörlerinde İşlem Gören İşletmeler Üzerine Bir İnceleme, ZKÜ Sosyal Bilimler Dergisi.
Albayrak Ali Sait, Yılmaz Şebnem Koltan, 2009. Veri Madenciliği: Karar Ağacı Algoritmaları Ve İMKB Verileri Üzerine Bir Uygulama, Süleyman Demirel Üniversitesi İ.İ.B.F. Dergisi, C.14, S.1
Altman Edward, I.,Giancarlo Marco and FrancoVaretto 1994. Corporate Distress Diagnosis: Comparisons Using Linear
Discriminant Analysis and Neural Networks, Journal Of
Aydın İsmail, 2012. Bilişim Sektörü ve Türkiye' nin
Sektördeki Potansiyeli, International Journal of New
Trends in Arts, Sports and Science Educatio, Vol 1, Issue 1 Aydın Nurhan, Şen Mehmet ve Berk Niyazi, 2012. Finansal
Yönetim-1, 1.Baskı, Eskişehir
Baykara Bekir, 1994. Döner Sermayeli İşletmelerde Kâr ve Kârlılığın Anlamı, Mali Hukuk Dergisi
Bayrakdaroğlu, Ali, Ege İlhan, 2007. "Teknolojik Gelişme,
İMKB ve NASDAQ’da İşlem Gören Teknoloji
Şirketlerinin Finansal Analizi", 6. Bilgi Ekonomi ve Yönetim Uluslararası Kongresi, İstanbul
Bulu Melih BULU, Eraslan İ. Hakkı, Kaya Hüseyin KAYA 2006. Türk Elektronik Sektörünün Rekabeçilik Analizi, İstanbul Ticaret Üniversitesi Sosyal Bilimler Dergisi, Vol 5, No 9
ChenLong, ZhaoXinlei, 2005. Profitability, Mean Reversion of Leverage Ratios, and Capital Structure Choices
Drake Pamela Peterson, 2016. Financial Ratio Analysis, http:// educ.jmu.edu/~drakepp/principles/module2/fin_rat.pdf Dreiseitl Stephan, Ohno-Machado Lucila, 2002. Logistic
Regression And Artificial Neural Network Classiffication
Models: A Methodology Review, Journal Of Biomedical
Informatics, Vol. 3
Eriotis Nikolaos, P., ZoeFrangouli,
ZoeVentoura-Neokosmides, 2002. Profit MarginAndCapitalStructure:
An Empirical Relationship, The Journal of Applied
Business Research, Vol. 18, N.2
Finansal Yönetim, 2012. Sermaye Piyasası Faaliyetleri İleri Düzey Lisansı Eğitimi
HaykinSimon, 2005. Neural Networks A Comprehensive Foundation, 2. Baskı, India: Pearson Prentice Hall.
Karaatlı Meltem, Güngör İbrahim, Demir Yusuf ve Kalaycı Şerefcı, 2005. Hisse Senedi Fiyat Hareketlerinin Yapay Sinir Ağları Yöntemi İle Tahmin Edilmesi, Balıkesir Üniversitesi Bandırma İktisadi ve İdari Bilimler Fakültesi Akademik Fener Dergisi, Cilt.2, Sayı.1
Karaca Süleyman Serdar, Başcı Eşref Şeref, 2011. Hisse Senedi Performansını Etkileyen Rasyolar ve İMKB 30 Endeksinde 2001-2009 Dönemi Panel Veri Analizi, Süleyman Demirel Üniversitesi İ.İ.B.F. Dergisi, Cilt 16, S3 Karadeniz Erdinç, İskenderoğlu Ömer, 2011. İstanbul Menkul Kıymetler Borsası’nda İşlem Gören Turizm İşletmlerinin
Aktif Kârlılığını Etkileyen Değişkenlerin Analizi,
Anatolia: Turizm Araştırmaları Dergisi, Cilt 22, Sayı 1 Kass G.V., 1980. An Exploratory Technique For Investigating
Large Quantites Of Categorical Data, Applied Statistics,
V.29, No 2
Kim Yong Soo, 2008. Comparison of thedecisiontree, artificialneural network, andlinearregressionmethodsbased on the number and types of independent variables and
sample size, Expert Systems with Applications, Vol 34
Kısakürek M. Mustafa, Aydın Yüksel, 2013. İşletmelerde Sermaye Yapısı ile Kârlılık Arasındaki İlişkinin Analizi: 1992-2011 Yılları Arası Finansal Krizler Odaklı BİST’te Bir Uygulama, C.Ü. İktisadi ve İdari Bilimler Dergisi, Cilt 14, Sayı 2
Korkmaz Özge, Karaca Süleyman Serdar (2014) Üretim İşletmelerinde Firma Kârlılığının Finansal Belirleyicileri ve BİST İmalat Sanayi Uygulaması, Ege Akademik Bakış, Cilt.14, Sayı.1
Koyuncugil Ali Serhan, Özgülbaş Nermin, 2008. İMKB'de İşlem Gören Kobi'lerin Güçlü Ve Zayıf Yönleri: CHAID Karar Ağacı Uygulaması, Dokuz Eylül Üniversitesi İ.İ.B.F. Dergisi, Cilt 23, Sayı 1
Magerman David M. 1995. Statical Decision-Tree Models For Parsing, Association for Computational Linquistics, Stroudsburg: USA
Nissim Doronand Stephen H. Penman, 2016. Financial Statement Analysis of Leverage and How It Informs About Profitability and Price-to-Book Ratios, http://papers. ssrn.com/sol3/papers.cfm?abstract id=292725 2001 Okuyan H. Aydın, 2013. Türkiye’deki En Büyük 1000 Sanayi
İşletmesinin Kârlılık Analizi, Business And Economics
Research Journal, Vol. 4, Number 2
Omran Mohammed, 2004. Linear Versus Non-linear Relationships Between Financial Ratios And Stock Returns: Empiricial Evidence From Egyptian Firms, Review of Accounting And Finance, Vol. 2, No 2
Oruç Eda, 2009. İMKB’de İşlem Gören İşletmelerin Hisse Senedi Getirileri İle Çeşitli Finansal Göstergeleri Arasındaki İlişki, Hitit Üniversitesi Sosyal Bilimler Enstitüsü Dergisi, Sayı 1-2
Quinlan, J.R. 1986 Induction Of DecisionTrees, Machine
Learning, Vol. 1, No 1
Sonia Singh, Priyanka Gupta, 2014. ComparativeStudy ID3, Cart And C4.5 Decision Tree Algorithm: A Survey,
International Journal Of Advanced Information Science and Technology, Vol. 27 No 27
Tektaş Arzu, Karataş Abdülmecit , 2004. Yapay Sinir Ağları ve Finans Alanına Uygulanması: Hisse Senedi Fiyat Tahminlemesi, Atatürk Üniversitesi İ.İ.B.F. Dergisi, Cilt 18, Sayı 3-4
Tugas Florenz, C. 2012. A Comparative Analysis of the Financial Ratios of Listed Firms Belonging to the Education Subsector in the Philippines for the Years
2009-2011, International Journal of Business and Social
Science, Vol. 3, No 21
Ture Mevlut, Tokatlı Fusun, Kurt Imran, 2009. Using Kaplan-Meier Analysis Together With Decision Tree Methods (C&RT, CHAID, QUEST, C4.5 and ID3) In Determining
Recurrence-free Survival Of Breast Cancer Patients, Expert
Systems With Applications, Vol. 36, No 2
Türk Dil Kurumu, 2016. Bilim ve Sanat Terimleri Sözlüğü, http://www.tdk.gov.tr
TUSIAD Report, 2015. http://www.tubisad.org.tr/Tr/News/ Sayfalar/tubisad-pazar-verileri-2015-raporu.aspx
Uğuz Sinan, 2016. Yapay Sinir Ağları Matlab Uygulaması, https://ybssoftware.files.wordpress.com/2011/03/ysa_uygul ama.pdf