ISSN: 1992-8645 www.jatit.org E-ISSN: 1817-3195
SEAT BELT DESIGN BY GRAPHIC APPROACH
1FRIH ABDERRAHIM, 2CHALH ZAKARIA, 1MRABTI MOSTAFA, 2OUAHI MOHAMED 1
Laboratory of computing and interdisciplinary physics
2
Laboratory of Engineering Systems and Applications Sidi Mohammed Ben Abdellah University Fez, Morocco.
E-mail: [email protected]
ABSTRACT
An observer can reconstruct or estimate in real time the current state of a real system using available measures, without prior knowledge of the initial conditions, to have complete and accurate information on system status. In addition, it allows estimating the unmeasurable states of a system, also replacing expensive or difficult to maintain sensors. For example the slip sensor.... For this aim, we will conceive full-order Luenberger observer on a linear system using a graphical approach to model it and that will be easy to handle thereafter, the causal properties and structural analysis of the bond graph tool are implemented for the synthesis of the observer. As a result, the calculation of the gains of the Luenberger observer is based on graphical procedures. Also to give a comparison between the measured values and estimate to demonstrate the importance and efficiency of the proposed approach. Simulation tests on a design of the seat belt field shows the performance of the observer Luenberger linear graph developed in order to measure and estimate the state unmeasurable.
Keywords: Bond Graph, Luenberger Observer, Belt Field, Performance, Estimate.
1. INTRODUCTION
The knowledge of the system is essential for control, but the lack of online instrumentations (the state is not fully accessible to measurements) requires the synthesis of observers whose role is to estimate all or part of the state. For deterministic linear systems, the Luenberger observer is the most used [12]. These types of linear observers are designed such that the difference between the system states and the estimated ones is asymptotically stable. The approach based on observers is one of the most used techniques to determine the unmeasurable states.
In this paper we will use the Bond graph tool [14], [11], [1], [5], [4], for the synthesis of observers in the case of linear systems, while, we have already worked on this approach [6], [2], [7], [3] . Much research are on the construction of the observers Bond Graph model-based, except the calculation of the gain, is determined by classical methods using the state equations.
Karnopp [10] used Bond Graph to construct the observer architecture and to calculate the equations of state. The calculation of the observer’s gain is executed by using the equations of state and pole
placement techniques [18]. In 2004, [15] proposed a bond graph approach for the observer synthesis which are destined for the control of linear systems (proportional integral, great gain). Other researchers developed by Hadji and Rahmani [9], suggest a full order observer of Luenberger for a mobile omnidirectional robot (Robotino). This method needs a structural analysis (observability, redundancy, structural laws) and a formal calculation.
The first part of this paper presents modeling of the crash test, the second part presents the definition of the full-order observer (Luenberger), as well as the design of a Bond Graph observer, and the third part presents the study of the design of the Luenberger observer and proportional integral observer for seat belt. Finally, Simulation testing by 20−sim software.
2. BUILDING OF BOND GRAPH MODEL OF CRASH TEST
ISSN: 1992-8645 www.jatit.org E-ISSN: 1817-3195
[image:2.612.89.298.144.282.2]considers the vehicle at the time shock against the wall (Figure1).
Figure 1: Vehicle crash test
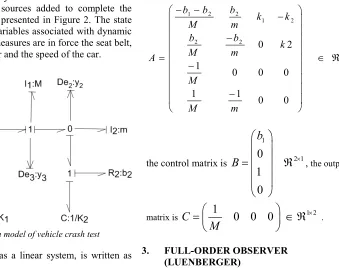
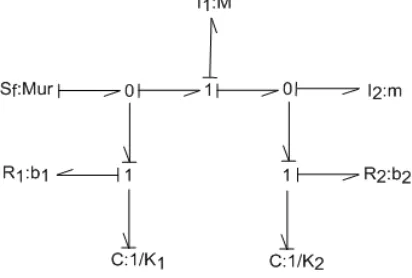
[image:2.612.167.506.379.649.2]The bond graph model of the system «seat belt» is obtained by following the build procedure of the given model in [14], [11], [1] and [4]. 1-junction is associated with each variable speed (the car speed...). And 0-junction for relations between a given speed. The sources added to complete the bond graph model presented in Figure 2. The state variables are the variables associated with dynamic elements and the measures are in force the seat belt, force in the bumper and the speed of the car.
Figure 2: bond graph model of vehicle crash test
The system starts as a linear system, is written as follows:
(1)
x
Ax
Bu
y
Cx
=
+
=
&
In order to determine the gains of the matrices A
and B, we use the following definition.
Definition: The causal path gain is determined by the product of the gains of all the elements
contained in the path.
0 1
i i
( 1)
n n(m )
ki( )
lj(2)
ij e
i j e
E
= −
+∏
∏
r
∏
g
-
n
0: Number of inversions in the direction of the half arrows at the 0-junction when following the flow variable along the path.-
n
1: Number of inversions in the direction of the half arrows at the 1-junction when following the flow variable along the path.-
m
i: modulus ofTf
i ,k
i= +
1
or−
1
depending onTf
i causality.-
r
j: modulus ofGy
j,k
j= +
1
or−
1
depending onGy
j causality.-
g
e: gain of the eth passive element (impedanceor admittance).
The state matrix is written:
1 2 2
1 2
2 2
2 2
0 2
1
0 0 0
1 1
0 0
b b b
k k
M m
b b
k
M m
A
M
M m
×
− −
−
−
= ∈ ℜ
−
−
the control matrix is
1
2 1
0
1
0
b
B
×
=
ℜ
, the output
matrix is
C
1
0
0
0
1 2M
×
=
∈ ℜ
.3. FULL-ORDER OBSERVER (LUENBERGER)
ISSN: 1992-8645 www.jatit.org E-ISSN: 1817-3195
initial conditions
x
(0)
, the inputu t
( )
andx
ˆ(0)
are estimated.
The Luenberger observer for building full-order observers considers a linear time invariant system is modelled by the following equation:
(1)
x
Ax
Bu
y
Cx
=
+
=
&
With
A
∈ ℜ
n n×,
B
∈ ℜ
n p×,
C
∈ ℜ
m n× ; y refers to the system measured outputs.The Luenberger observer (figure 3) for model 2 is of the form:
ˆ
ˆ
(
ˆ
)
(3)
ˆ
ˆ
x
Ax
Bu
K y
y
y
Cx
=
+
+
−
=
&
where the term
K
(y y)
−
ˆ
represents a linear output injection. The dynamic model of the estimation error,e
= −
x
x
ˆ
, obtained for the observer is then:(A KC) e
(4)
e
&
=
−
[image:3.612.94.295.409.539.2]so, the observer design problem sums up to calculate the gain values
K
, such as the dynamic of error.Figure 3: Diagram of the observer Luenberger
4. OBSERVER DESIGN BY BOND GRAPH APPROACH
This section describes the procedure to synthesize Luenberger observer using a Bond Graph approach. The algorithm is defined as follows:
– Step 1: checking the existence of any redundant outputs
the existence of redundant outputs is the first condition to check for the observer construction. The advantage of this step is to eliminate redundant output in order to reduce the calculations. Indeed
the selection of the non-redundant outputs allows the computing of the gain
K
with minimal size. This condition can be verified by calculating the row of the observation matrixC
(difference between the number of detectorsDe
andDf
, and the detectors which cannot be dualized in the bond graph in integral causality).– Step 2: checking the observability of structural model From a Bond Graph point of view proposed by Sueur and Dauphin-Tanguy [19], a bond graph model is structurally observable, if the following two conditions are satisfied:
1) There exists at least a causal path linking each
I
and
C
-element in integral causality and a sensorDe
orDf
in the bond graph in preferred integral causality.2) All
I
andC
-elements in integral causality in the bond graph in preferred integral causality accept a derivative causality when a preferred derivative causality is assigned on the bond graph model. If it is not satisfied directly, a dualisation of someDe
orDf
has to be performed in order to transform the remaining integral causalities.– Step 3:Linear injection of the output:
Introducing
K y
i(
−
y
ˆ
)
in the dynamic elements of the Proportional observer model.The bond graph model of the observer is composed by the initial model of the system to which the term
ˆ
(
)
i
K y
−
y
is added. The letter is defined using modulated flow sources for anI
-element and modulated effort sources for aC
-element (fig 4 and fig 5). [image:3.612.362.507.561.647.2]ISSN: 1992-8645 www.jatit.org E-ISSN: 1817-3195
Figure 5: Linear output injection in the Luenberger observer: Case of an C-element
– Step 4: Calculation of the observer gain the calculation of the observer gain can be done using two techniques. The first consists on the calculation of the state equations from the bond graph model and the determination of the gain
K
pby the classical methods [10]. The second is based on the formal calculation of the characteristic polynomial
P
(A KC)
−
directly from the bond graph model of the observer by using the causal paths and loops [15].The Luenberger observer gain is obtained by identifying the polynomial characteristic of the observer
P
(A KC)
−
to the desired polynomial( )
d
[image:4.612.316.522.336.475.2]P s
in order to fix the poles of the observer.Figure 6: Algorithm to build and calculate the observer gain from bond graph model
5. STUDY OF THE DESIGN OF A PROPORTIONAL OBSERVER TO THE SEAT BEL
For the design of a graphical observer (BGO), the steps below must be verified:
Step 1 Checking the existence of redundant outputs: The interest to eliminate the redundant outputs and to avoid the calculations. However, this step is canceled in this study case, since the model has only a single detector.
Step 2 Verification of structural observability: The bond graph model in integral causality (BGI) and bond graph derivative causality model (BGD) (Figures 7 and 8).
Figure 7: Bond Graph Model of the seat belt in integral causality
Figure 8: Bond Graph Model Of The Seat Belt In Derivative Causality
As it is mentioned previously, the structural observability can be easily obtained by structural analysis of the bond graph model. Note that, on the BGD, all the dynamic elements admit a derivative causality, so the model is structurally observable.
Step 3 Construction of the bond graph observer (BGO): The observer Bond Graph model is obtained from the initial bond graph model with a linear output injection, applied by adding the
ˆ
(
)
i
[image:4.612.94.299.420.563.2]ISSN: 1992-8645 www.jatit.org E-ISSN: 1817-3195
Figure 9: Bond Graph Model of PO "seat belt"
Step 4 : Gains calculation
K
p: The state variables for this system, (Figure 8), are associated to two inductive I-elements and two capacitive C-elements in integral causality. The order of model is, therefore, equal to 4. The polynomial characteristic of the state matrix(A)
is extracted from the gain calculation of the state equation (2). So, the polynomial characteristic associated with the matrix A of this system is defined as:4 2 1 2 3
2
2
1 2 2 1 2 2 2
1 2 2 1 2 2 2 1 2
( )
det(SI A) S
(
)
.
(
) 3
(5)
.
.m
.
A
b
b
b
P s
S
m
M
k
k
b b
b
b
k
S
M
m
m
M
M m
M
k b
k
b
b
b k
k k
S
M m
m
M
M
M m
+
=
−
=
+
+
+
+
+
+
−
+
+
+
+
+
+
The poles of the system are respectively:
1 2
3 4
4.4463 13.36 ,
4.4463 13.36
(6)
7.2837 6.912 ,
7.2837 6.912
S
i S
i
S
i S
i
= −
+
= −
−
= −
+
= −
−
To calculate the gain
K
p (Figure 9), with choosing the observer poles to be a little faster than those in the model.The values of the desired poles are respectively:
1 2 3 4
6,
7
(7)
9,
10
d d d dS
S
S
S
= −
= −
= −
= −
Which give the desired polynomial characteristic as follows:
4 3 2
( ) S
32S
379S
19685S 3780 (8)
d
P s
=
+
+
+
+
The determination of the Luenberger observer gain
p
K
is based on the coefficients of the obtained polynomial characteristicP A K
(
−
pC)
by using Rahmani’s theorem [17] on the observer bond graph model.Theorem
The value of each coefficient αi of the polynomial characteristic
P s
A( )
,n n i
i n i n
(S)
S
S
...
S
(9)
A
P
=
+
α
−+
+
α
−+
α
Is equal to the constant term (without the Laplace operator S) of the ith causal cycles order of the total gain families in the bond graph model. The gain of each causal cycles family must be multiplied by
( 1)
−
d if the family consists of d disjoined causal cycles.4 3 2
( )
( )
( )
S
32S
379S
19685
3780
(10)
A KC d
P
S
P S
S
−
=
=
+
+
+
+
The identification terms between
P S
d( )
and(A KC)
(S)
P
− leads to the gain valuesK
p1=
12810
,2
75271.7
p
K
=
,3
800
p
K
=
, and4
1763
p
K
=
.6. SIMULATION
The initial conditions of the BG model’s states in integral causality are considered null. We use 20−sim software for Simulation tests, parameter values [13] are defined in Table I
Table 1: Parameters values of the model. M (car) = 1400 (Kg)
m(mannequin) = 100 (Kg) k1 = 3.105 (N/m) K2 = 1.104 (N/m) b1 = 16000 (Ns/m)
b2 = 1200 (Ns/m) VMur = 0 (m/s)
In this part, let us consider that the friction parameter for the BGO have a variation of −10% in comparisons with the parameters of the BG model.
[image:5.612.354.477.541.622.2]ISSN: 1992-8645 www.jatit.org E-ISSN: 1817-3195
bumper and force in the seat belt) are indistinguishable.
Figure 10: Estimation Of Car Speed
Figure 11: Estimation Of Force In The Bumper
Figure 12: Estimation Of The Force In The Seat Belt
The estimation errors are null as it is shown in figures 13, 14 and 15. Therefore, it improves the
efficiency and effectiveness of the Proportional observer bond graph.
[image:6.612.89.530.78.685.2]Figure 13: Error Of Car Speed
Figure 14: Error Of Force In The Bumper
ISSN: 1992-8645 www.jatit.org E-ISSN: 1817-3195
7. CONCLUSION
In this paper, we have presented the proportional observer for design of the seat belt based on the bond graph approach. This method is applied for the construction of a full-order observer in the case of linear systems, exclusively based on the causal manipulation exploited on bond graph representation. The major interest of this approach lies in the fact that the bond graph model has a true physical direction and gives access to many flow and effort variables.
The proposed observer on a model of the seatbelt, however, it requires a precise knowledge of system parameters to guarantee a good estimate. Graphic reason, the proportional observer is limited, Future work will be concentrated on the synthesis of a proportional integral observer to ensure more robustness against disturbance
REFRENCES:
[1] Breedveld. P. Essential gyrators and equivalence rules for 3-port junction. Journal of The Franklin Institute, 318(2) :77–89, 1984.
[2] Chalh.Z, Andaloussi.C, Hihi.H, and Frih.A. Approche graphique pour l’analyse des systèmes LTV. Colloque International sur le Monitoring des Systèmes industriels, Proceedings CIMSI 2014.
[3] Chalh.Z, Frih.A, Mrabti.M, and Alfidi.M. Bond graph methodology for controllability of LTV systems. International Journal of Modelling, Identification and Control, 24, N˚.3 :257–265, 2015.
[4] Dauphin-Tanguy.G. Les bond graphs. Hermés Science Editor, 2000.
[5] Dauphin -Tanguy.G, Borne.P, and Lebrun.M. Order reduction of multitime scale systems using bond graph, the reciprocal system and the singular perturbation method. Journal of the Franklin Institute, 319(1/2): 157–171, January/February 1985.
[6] Frih.A, Chalh.Z, Mrabti.M, and Alfidi.M. Graphical approach for the analysis of LTV systems. 6th Conference on Computational Engineering in Systems Applications,CESA 2015 Proceedings, 2015.
[7] Frih.A, Chalh.Z, Mrabti.M, and Alfidi.M. Modélisation par l’approche bond graph : Application et simulation sur le système photovoltaïque. Congrès International de Génie Industriel et Management des Systèmes, Proceedings CIGIMS 2015.
[8] Granda.J. "Class notes: Computer modeling and design of dynamic systems". Department of Mechanical Engineering, California State University, Sacramento,USA., 2003c.
[9] N. Hadji and A. Rahmani. Observer for an omnidirectional mobile robot. ICBGM, April, 2010.
[10] D. Karnopp. Bond graphs in control : Physical state variables and observers. Journal of The Franklin Institute, 308 (3) :221–234, 1979. [11] Karnopp.D.C and Rosenberg.R.C. System
dynamics : A unified approach. John Wiley, New York, USA, 1975.
[12] D Luenberger. Observers for multivariable systems. IEEE Transactions on Automatic Control, n˚ :11 :190–197, 1966.
[13] Ouahi.M, Stéphant.J, and Meizel.D. Redefining automotive supervision using new sensor technology. international Symposium on Advanced Vehicle Control, 2010.
[14] Paynter.M. Analysis and design of engineering systems. MIT Press, Cambridge, MA, U.K, 1961.
[15] C.Pichardo-Almarza, A. Rahmani, G. Dauphin-Tanguy, and M. Delgado. Bond graph approach to build reduced order observers in linear time invariant systems. Proceedings of 4th MATHMOD, Fourth International Symposium on Mathematical Modeling, 2003. [16] Pichardo-Almarza.C, Rahmani.A, Dauphin-Tanguy.G, and Delgado.M. Using the bicausality concept to build reduced order observers in linear time invariant systems modelled by bond graphs. Proceedings of European Control Conference,ECC’03, 2003c. [17] A. Rahmani. Etude structurelle des systmes
linaires par l’approche bond graph. thése, 1993. [18] Rahmani.A, Sueur.C, and Dauphin-Tanguy.G. Pole assignment for systems modelled by bond graph. Journal of the Franklin Institute, 331, N˚3:299–312, 1994.