ISSN: 1992-8645 www.jatit.org E-ISSN: 1817-3195
389
WAVELET DECOMPOSITION LEVELS ANALYSIS
FOR INDONESIA TRADITIONAL BATIK CLASSIFICATION
1
FIKRI BUDIMAN, 2ADANG SUHENDRA, 3DEWI AGUSHINTA, 4AVINANTA TARIGAN
1
Department of Computer Science, University of Dian Nuswantoro, Semarang, Indonesia
2,3,4
Department of Computer Science, University of Gunadarma, Depok, Indonesia
ABSTRACT
Indonesia traditional batik is a non-material cultural heritage which has patterns that basically divided into batik ‘keraton/pedalaman’ and ‘pesisir’. An appropriate content-based image recognition method is needed to recognize the pattern of Indonesa traditional batik in a large image database. The results of this research can be used to recognize batik ‘keraton’ and ‘pesisir’ based on feature of wavelet energy and standard deviation, with 122 images as training dataset and 120 images as test datasets.
Classification using binary non-linear support vector method, with feature extraction of discrete wavelete Transform (DWT) which was tested for wavelet types of Daubechies 1 - 5 with decomposition first level, and Daubechies 2 with decomposition 1st to 5th level. The Best result is obtained by Daubechies 2 decomposition thirth level with an accuracy of 96.7%. The result is better than the previous researches with the same datasets and classification method. The previous researches conducted using feature extraction method with fractal feature obtained an accuracy at 91.6%, and that which used GLCM with 20 parameters obtained an accuracy at 80%.
Keywords: Image Retrieval, Traditional Batik, Decomposition Wavelet, Feature Extraction,Classification.
1. INTRODUCTION
The process of making batik in Indonesia using closing wax technique to hold the color with canting and cap has been recognized by UNESCO since October 2, 2009 as an oral cultural heritage non-material/intengible hereditary. Indonesia traditional batik patterns have meaning of philosophy of Indonesa life community identity. Traditional batik patterns are generally differentiated into batik pedalaman (keraton) and pesisir. Batik keraton is one of arts in Yogyakarta palace and Solo palace which represents a philosophy based on spiritual disciplines [1]. The pattern of Batik keraton Solo-Yogyakarta is influenced by the Hindu-Javanese culture. Batik pesisir grows in the northern regions of Java such as Pekalongan, Cirebon, Kudus, Lasem, Banyumas, and Madura. The development of batik pesisir does not follow the pattern rule of batik keraton. The batik pesisir pattern is more naturalist and is influenced by cultural mixture of migrants from Netherlands, China, Arabia, and India [2].
The previous researchs of images extraction and classification in a large database to recognize Indonesia traditional batik pattern has reached the
output of recognizing some types of pattern without knowledge of understanding the information of the history based on hereditary cultur. The previous researchs which have been done with limitation of recognizing types of pattern of ceplok, kawung, nitik, lereng, semen, and buketan [3]-[6], are not yet described as pattern of keraton or pesisir motives. The method which is used in previous researchs is extraction of wavelet transform whithout including the comparison result based on every wavelet transform decomposition level.
ISSN: 1992-8645 www.jatit.org E-ISSN: 1817-3195
390 the success rate of the classification in every wavelet transformation decomposition level used to extract its features. The method of wavelet transformation is suitable to analyze multiresolution images with domain transformation on a scale that varies [8], and this method can make the changing process of the data signal which are a combination of time and frequency into the form of wavelet coefficients which are easier to be analyzed, and to be used to extract image features that have signals or data that a-periodic or intermittent and full of noise [9]. The same classification method used by sulistiyawati [7] is used in this research. The classification method is non-linear binary support vector with Gaussian/Radial Basis function (RBF) which is a kernel function. Virmani [8] used this method to identify liver disease imagery, and the result of using wavelet feature space descriptions was classified with the RBF, because it has the ability to produce the hyperplane that is good for mapping a data feature spaces non-linear training. Classification using Support Vector Machine (SVM) that works using the principle of Structural Risk Minimization (SRM) to produce a good generalization with the field separator can minimize average error on the training data [10]. In the research of classification for texture image of pollen conducted by fernandez et al [11], SVM shows better than the method of classification of Multi-Layer Perceptron, Minimum Distance Classifier, and K-Nearest Neighbor.
In this research, the image of batik is converted to grayscale using method of Otsu, then the features extraction is conducted with Discrete Wavelet Transform (DWT) up to fifth levels of decomposition. The features of each level which is a unique value of every image of batik is an energy value and standard deviation values [12]. Those values are calculated from subband wavelet coefficients at each level of transformation. The values of energy and standard deviation from each level as features are used to classify using non-linear binary support vector method in order to recognize the difference image of batik keraton and pesisir. The rate success of classification on each level wavelet transformation is tested using the confusion matrix measurement technique. The technique is also used by Sulistiyawati [7] for similar research, so the extraction results using GLCM method, Fractals, and the wavelet transformation can be compared to SVM method. Content Batik Based Image Retrieval (CBIR) research using wavelet transformation conducted in this research is a base for building Batik Ontology Base Image Retrieval (OBBIR) which can solve the
problems of semantic gap by mapping the low-level features of batik with spectrum-based to high-level ontology concept [13].
The comparison of decomposition levels in feature extraction using wavelet trasnformasi to get low-level features of Indonesian traditional batik using Support Vector Machine classification is required for this initial research.
2. MATERIALS AND METHOD
2.1. Wavelet Transformation
Wavelet is a method that can be used to define the image of the space multiresolution, by differentiating the intensity of the image into sub part of the spectrum which is a combination of time and frequency. In this research, the feature extraction using Discrete Wavelet Transform (DWT)-2D is used to obtain the unique characteristics of each two-dimensional image of batik. The method works by transforming the image decomposition into four sub-sections (subband) of new image, and by doing down sampling so that each subband sampling has half size of the previous image. Image transformation is performed to obtain information extraction features contained in an image with greater clarity. Transformation is done with a low pass filter and a highpass filter that evolved from the mother wavelet, develop into the type of wavelet: haar/db1, daubechies (db2,3,4,...,n), coiflets, symlets, discrete mayer, and biorhogonal. Rangkuti et al [4] have tested the use of the type of wavelet to recognize the pattern, and the results shows that Daubechies(db2) is better than the type of haar, coiflets, and biorhogonal. The differences in the results of the use of wavelet type db1 / haar, db2, db3, db4 and db5 are tested in this research.
The decomposition result for the first subband containts approximation coefficient of the original image, which is the decomposition result with low frequency with the calculation of low pass towards the rows and followed by a lowpass towards the column. This subband is known as LL(lowpass-lowpass)/
C
A(coefficients aproximation). Subbandimages 2, 3, and 4 are the result of decomposition with high frequency. The second subband LH/CH(coefficients horizontal details) is calculated
by the low pass towards the rows and highpass towards the column. It contains subband edge image coefficients in a horizontal direction. The third subband HL/CV(coefficients vertical details)
ISSN: 1992-8645 www.jatit.org E-ISSN: 1817-3195
391 in a vertical direction. The fourth subband HH/CD(coefficients diagonal details) with the high
pass to the rows and columns of the high pass contains information coefficient edge image in a diagonal direction.
LL
HL
=
C
AC
V [image:3.612.103.291.159.219.2]LH
HH
C
HC
DFig. 1. Discrete wavelet transformation scheme 1st level
LL2 HL2
LH2 HH2
HL1
LH1
HH1
(a)
LL3 HL3
HL2
LH3 HH3
LH2 HH2
HL1
LH1
HH1
[image:3.612.313.504.182.438.2](b)
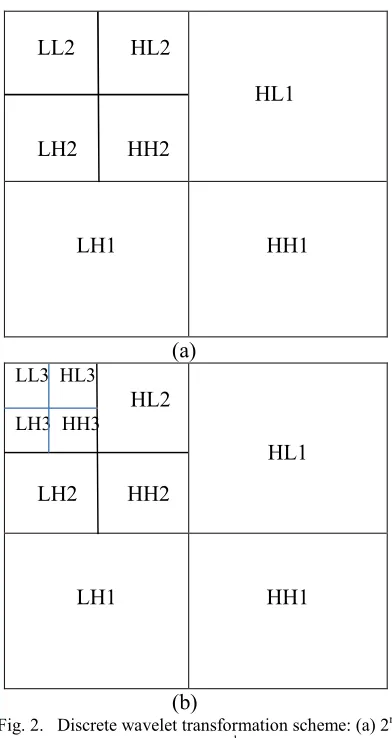
Fig. 2. Discrete wavelet transformation scheme: (a) 2nd level dan (b) 3rd level
Decomposition for 2nd, 3rd, and next level which uses previous subband LL as the initial image uses matlab function of ‘wavedec2’ [14]. For example for the decomposition of 3rd level with the type of wavelet db2: [c,s] = wavedec2(‘batik.jpg’,3,’db2’). The wavelet coefficients values for each subband is coherent saved as vector (1x245686koefisien) in
the variable c, with sequence
c=[CA(3)|CH(3)|CV(3)|CD(3)|CH(2)|CV(2)|
CD(2)|CH(1)|CV(1)|CD(1)], and the variable 's ' to
save the dimensions of the subband image in the following order: approximation (55x73pixel), 3rd level (55x73pixel), 2nd(108x144pixel), 1st (214x285 pixel), and the original image ‘batik.jpg’ (426x567pixel).
batik.jpg
Fig. 3. Discrete wavelet transform scheme 3rd level for batik.jpg
The matlab function can be used to elaborate the value of the wavelet coefficients in the form of a matrix for each subband at the vector c [15][16]: ‘appcoef2’ for coefficients aproximation(CA), and
‘detcoef2’ for the coefficient in detail to CH, CV,
and CD, for example:
CA3=appcoef2(c,s,'db2',3);
CA3 in the form of a matrix of size 55x73 contains the approximation coefficients in the decomposition 3rd level, and [CH3,CV3,CD3]=detcoef2('all',c,s,3); CH3, CV3, CD3 in the form of a matrix of size 55x73 contains the coefficient for CH, CV, CD in the decomposition 3rd level.
2.2. Fiture Image Dataset
[image:3.612.95.291.244.613.2]ISSN: 1992-8645 www.jatit.org E-ISSN: 1817-3195
392 best combination as image features. Standard deviation (std) is used as a feature of every image, since it can show the distribution of gray intensity. The lower the value of std makes the distribution become more equitable.
Energy value as a feature image which is higher or larger indicates the variations of white texture element (texel) more dominant and the spread of degrees of grayscale/ image structure is increasingly irregular. The smaller value shows the variation of the Black-colored texel more dominant and the spread of grayscale degrees is getting regular.
Each subband has 2 features values: energy value and standard deviation value. There are 4 subband in 1st level c=[CA|CH|CV|CD], so the number feature
value of each image is the length of vector features: 2 x 4 = 8. 2nd Level has 7 subband c= [CA(2) | CH(2)
| CV(2) | CD(2) | CH(1) | CV(1) | CD(1)]. The length
of vector feature is 2x7=14. 3rd level has 10 subband c=[CA(3) | CH(3) | CV(3) | CD(3) | CH(2) |
CV(2) | CD(2) |CH(1) | CV(1) | CD(1)], so the vector
feature is 2x10=20. 4th level has 13 subband c=[CA(4) | CH(4) | CV(4) | CD(4) |CH(3) | CV(3) |
CD(3) | CH(2) | CV(2) | CD(2) | CH(1) | CV(1) |
CD(1)], the feature vector is then 2x13 = 26. 5th
level has 16 subband c=[ CA(5) | CH(5) | CV(5) |
CD(5) | CH(4) | CV(4) | CD(4) | CH(3) | CV(3) | CD(3) |
CH(2) | CV(2) | CD(2) | CH(1) | CV(1) | CD(1)], the
feature vector is then 2x16 = 32.
Calculation of the energy value of each subband is as follows [17], with parameters of 'Es' (energy at a specified subband calculated CA/CH/CV/CD), ‘Cs’(matrix coefficients in subband calculated CA/CH/CV/CD), c(the value of the coefficient vector for the whole of the subband):
Es = 100*∑x,y(Csx,y.^2) / ∑n=1: m(cn.^2)
The formula of the standard deviation (Std) for subband with parameter ‘Cs’ (coefficient matrix on subband calculated CA/CH/CV/CD), ‘r’ is the average value of ‘Cs’, and ‘n’ is the amount of data the ‘Cs’:
Std = ( ∑x,y(Csx,y – r)2 / (n-1) )½
122 batik image as training data which consist of 50 batik keraton and 72 batik pesisir, show that in 1st level (each picture has eight feature values), training dataset are obtained with matrix 122x8. In 2nd level (each image has fourteen feature values), training dataset are obtained with matrix 122x14. In the next level, the matrix size of training dataset are 122 x the number of each image features value. 120 batik image which consist of 55 batik keraton and 65 batik pesisir are used as test dataset. The matrix size of features value in n-level for test data sets is: 120 x the number value of the feature to the n-level.
In 1st level with c=[ CA | CH | CV | CD], then the
storage of features value of each image is one row in the matrix 122x8 (the training dataset), and 120x8 (test dataset) is: feature=[ EsCA StdCA EsCH
[image:4.612.314.533.167.350.2]StdCH EsCV StdCV EsCD StdCD ].
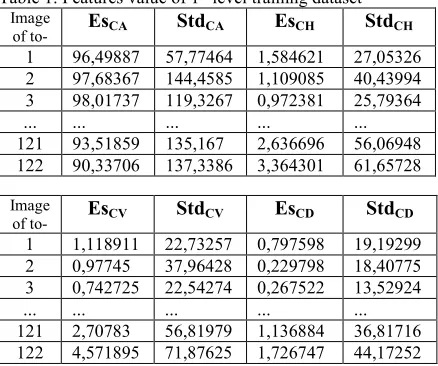
Table 1. Features value of 1st level training dataset
Image
of to- EsCA StdCA EsCH StdCH
1 96,49887 57,77464 1,584621 27,05326 2 97,68367 144,4585 1,109085 40,43994 3 98,01737 119,3267 0,972381 25,79364
... ... ... ... ...
121 93,51859 135,167 2,636696 56,06948 122 90,33706 137,3386 3,364301 61,65728
Image
of to- EsCV StdCV EsCD StdCD
1 1,118911 22,73257 0,797598 19,19299 2 0,97745 37,96428 0,229798 18,40775 3 0,742725 22,54274 0,267522 13,52924
... ... ... ... ...
121 2,70783 56,81979 1,136884 36,81716 122 4,571895 71,87625 1,726747 44,17252
3. RESULT AND DISCUSSION
In this research, classification is conducted using non-linear binary support vector method with kernel function Gaussian/Radial Basis function (RBF) for training dataset and test dataset. For initialization, classification is done for dataset 1st level with type wavelet of db1(haar), db2, db3, db4, and db5. Results of the classification is positive and negative observations class, with positive=1 and negative=0, and the accuracy level of image recognition is measured in the test dataset is measured using confusion matrix techniques, which are divided into classes: positive data (true positive/TP; false positive/FP) and negative data (true negative/TN; false negative/FN) .
ISSN: 1992-8645 www.jatit.org E-ISSN: 1817-3195
393
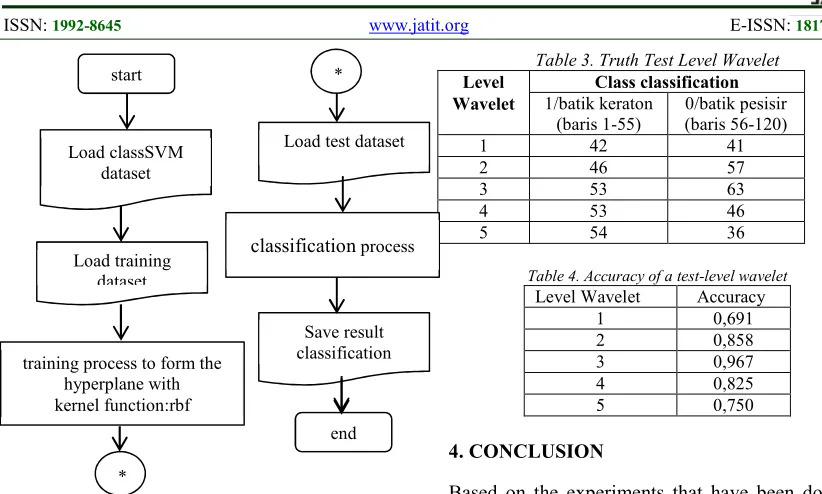
Fig. 3. process of classification
[image:5.612.89.500.69.316.2]The produce of classification trial based on the difference of coefficient function with scaling (db1-db5) on daubechies wavelet does not indicate significance differences. Table 2 shows that db2 have a better level of truth.
Table 2. Truth Level Of Db1-Db5 Scaling Function Coefficient Test.
wavelet Class classification type 1/batik keraton
(row 1-55)
0/batik pesisir (row 56-120)
db1 40 42
db2 42 41
db3 42 39
db4 43 39
db5 42 39
The next classification test is based on the use of the level of decomposition DWT (lv.1-5) with db2 scaling function coefficients.
The produce indicate that varying levels of decomposition do not affect classification result level in recognizing the keraton to the batik pesisir. Table 3 and 4 show that 3rd level has better result for the truth level of observation class dan accuracy in prediction class.
Table 3. Truth Test Level Wavelet
Level Class classification Wavelet 1/batik keraton
(baris 1-55)
0/batik pesisir (baris 56-120)
1 42 41
2 46 57
3 53 63
4 53 46
5 54 36
Table 4. Accuracy of a test-level wavelet
Level Wavelet Accuracy
1 0,691
2 0,858
3 0,967
4 0,825
5 0,750
4. CONCLUSION
Based on the experiments that have been done, it can be concluded that:
- The higher the level of decomposition dwt the more features value of every image of batik, but it does not indicate higher classification accuracy for recognizing batik keraton and batik pesisir. - The use of several scaling function coefficients of Daubechies (db1-db5) at 1st level dwt does not indicate the significant difference result for the classification of the recognition of test dataset of batik keraton and batik pesisir.
- Energy features and standard deviation resulted from wavelet coefficients with dwt (3rd level; type wavelet db2) method used for classification using non-linear binary support vector method to recognize the batik keraton and pesisir has accuracy at 96,7%. This result is better than previous research conducted with same dataset and classification method using feature extraction with fractal feature method (accuracy rate at 91,6%) and GLCM with 20 parameters (accuracy rate at 80%).
The continuation of this research will be continued in order to multiclass classification to develop an knowledge base ontology model of Indonesia traditional batik. Multiclass classsification with based on content spectrum features for batik keraton from Solo and Yogyakarta, and batik pesisir from the northern regions of Java, such as Pekalongan, Cirebon, Kudus, Lasem, Banyumas, and Madura.
start
Load classSVM dataset
Load training dataset
training process to form the hyperplane with kernel function:rbf
Load test dataset
classification process
*
*
Save result classification
[image:5.612.85.299.432.537.2]ISSN: 1992-8645 www.jatit.org E-ISSN: 1817-3195
394 REFERENCES
[1] Tirta, Iwan, 2009, Batik Sebuah Lakon, PT. Gaya Favorit Press, Jakarta, Indonesia. [2] Ishwara, Helen., Yahya, I.R.Supriyapto., Moeis,
Xenia., 2011, Batik Pesisir Pusaka Indonesia ‘Koleksi Hartono Sumarsono’, KPG (Kepustakaan Populer Gramedia), Jakarta, Indonesia.
[3] Rangkuti, Abdul Haris, 2014, “Content Based Batik Image Classification Using Wavelet Transform And Fuzzy Neural Network”, Journal of Computer Science 10 (4): 604-613, Science Publications.
[4] Rangkuti, Abdul Haris., Harjoko, Agus., Putro, Agfianto Eko, 2014, “Content Based Batik Image Retrieval”, Journal of Computer Science 10 (6): 925-934, Science Publications.
[5] Putra, Ricky Eka., Suciati, Nanik., Wijaya, Arya Yudhi., 2011 “Implementing Content Based Image Retrieval For Batik Using Rotated Wavelet Transform And Canberra Distance”, Articles Bali International Seminar On Science And Technology, Bali-Indonesia. [6] Moertini, Veronica S., Sitohang, Benhard,
2005,“Algorithms of Clustering and Classifying Batik Images Based on Color, Contrast and Motif”, PROC. ITB Eng. Science Vol. 37 B, No. 2, 2005, 141-160. [7] sulistiyawati, Puri.,2014, Pengenalan Citra
Batik Menggunakan Fitur Fraktal
Berdasarkan Metode Support Vector Machine (SVM), Thesis, University of Dian Nuswantoro, Semarang, Indonesia.
[8] Virmani, Jitendra., Kumar, Vinod., Karla, Naveen., Khandelwal, Niranjan., 2013, ”SVM-Based Characterization of Liver Ultrasound Images Using Wavelet Packet Texture Descriptors”, Journal of Digital Imaging (2013) 26:530–543, Springer.
[9] Budiman, Fikri, 2015, Study of Wavelet Transformation Method for feature Extraction Characteristics Based In Identifying Authenticity Indonesian Batik, International Conference on Information Technology and Engineering Application, University of Binadarma, Palembang, Indonesia.
[10] Boswell, D., 2002, Introduction to Support Vector Machines, Departement of Computer Science and Engineering University of California San Diego.
[11] M.Fernandez-Delgado, P.Carri’on, E.Cernadas, J.F.G’Alve, Pilar S’a-Otero, 2003, Improved Classification of Pollen
Texture Image Using SVM and MLP, IASTED International Conference on Visualization and Image Processing.
[12] Kokare, Manesh., B.N.Chatterji, P.K.Biswas, 2003, Wavelet Transform Based Texture Feature For Content Based Image Retrieval, Electronics and Electrical Communication Engineering Department, India Institute of Technology, Kharangpur, India.
[13] Budiman, Fikri, 2015, Ontology Based Batik Image Retrieval For Domain Knowledge, Uzbekistan-Indonesia International Joint Conference on Globalization, Economic Development, and National Character Building, Bali, Indonesia.
[14] Misiti, M., Misiti, Y., Oppenheim, G., Poggi, J.M., 2008, wavedec2 Function, The Mathworks, Inc.
[15] Misiti, M., Misiti, Y., Oppenheim, G., Poggi, J.M., 2008, appcoef2 Function, The Mathworks, Inc.
[16] Misiti, M., Misiti, Y., Oppenheim, G., Poggi, J.M., 2007, detcoef2 Function, The Mathworks, Inc.