ORIGINAL RESEARCH ARTICLE
A COMPARATIVE STUDY BETWEEN THE RAINFALL OBSERVED IN CEARÁ AND
ESTIMATED BY THE TRMM PROJECT
1
Felipe da Costa Gomes,
*,2Anderson Jackson da Silva Magalhães,
1Joab Coutinho Campelo,
1
Mensio Jefferson Araujo do Nascimento,
1José Maria Brabo Alves,
1Everton Santos Castro
and
3Sérgio Sousa Sombra
1
Science and Technology Center, State University of Ceará, Ceará, Brazil
2
Science and Technology Center, State University of Ceará, Ceará, Brazil; Av. Dr. Silas Munguba, 1700,
zip: 60714-903, Fortaleza-Ceará, Brazil
3
Department of Hydraulic and Environmental Engineering, Federal University of Ceará, Ceará, Brazil
ARTICLE INFO ABSTRACT
The rainfall regime in the Northeast region of Brazil has an irregularity associated with some physical and atmospheric factors that provides a feature specific to it. There are several ways to analyze the rainfall characteristics of a region; one way is statistically analyze the rainfall index to be able to identify the profile of the region. This work presents a statistical approach between the Brazilian northeast, the city of Fortaleza and the TRMM project of NASA is to evaluate and improve the observation of precipitation in the tropics around the globe. This analysis is based on the 3B42 product, from January 1998 to 2015, with an interval of time of 3 in 3 hours and a resolution of 0.25 °. The results are quite satisfactory in view of the fact that the satellite does not collect data in situ, watching a concentrated rain profile in the morning and in the first six months of the year.
Copyright ©2017,Felipe da Costa Gomes et al. This is an open access article distributed under the Creative Commons Attribution License, which permits unrestricted use, distribution, and reproduction in any medium, provided the original work is properly cited.
INTRODUCTION
Precipitation is one of the most important meteorological variables for the planning of socioeconomic / environmental activities in different spheres of modern society. The low data density has been an obstacle in the advance of this study, however with the advent of modern techniques of remote observation by satellite, the monitoring of this variable has been done in a more precise way. The perfect understanding of this phenomenon has been the subject of studies over the years
as seen in several studies (Soares et al., 2014; Silva, 2012;
Rasmussen et al., 2013; Négron et al., 2009), these approach
the remote sensing satellite technique through the project
Tropical Rainfall Measuring Mission (TRMM). Precipitation
presents a complex spatial and temporal variability and the lack of data of this variable makes an alternative for the common means of rainfall measurement, especially in the tropics, increasingly necessary. In these regions this variable is
*Corresponding author:Anderson Jackson da Silva Magalhães,
Science and Technology Center, State University of Ceará, Ceará, Brazil; Av. Dr. Silas Munguba, 1700, zip: 60714-903, Fortaleza-Ceará, Brazil.
an important factor in people's quality of life and if not the most preponderant in what concerns the management of water resources and economic activities. Given the lack of rainfall data in soil and in the high seas, the advance of the study and understanding of precipitation in this region has been done in a very limited way. It is very common to measure precipitation by means of collection platforms or rain gauges, but in this way there are errors and errors that can become substantial in the definition of the rain profile of a region. The northeast region of Brazil, presents a great climatic irregularity comparing with other regions of the country. These irregularities are associated to several atmospheric systems operating at different times of the year, making it increasingly
necessary to study these regional variabilities (Studart et al.,
2006). The great variability in the distribution of precipitations, both seasonally and interannually, is another important constituent of the climatic characteristic of the region. From the climatic point of view, the northeastern region is considered semiarid because it presents substantial temporal and spatial variations of rainfall and high temperatures throughout the year. In view of these irregularities, new tools to monitor the precipitation of the
ISSN: 2230-9926
International Journal of Development Research
Vol. 07, Issue, 12, pp.17665-17671, December,2017
Article History:
Received 19th September, 2017
Received in revised form 24th October, 2017
Accepted 29th November, 2017 Published online 29th December, 2017
Key Words:
Precipitation, Northeast, Diurnal Cycle.
Citation: Felipe da Costa Gomes, Anderson Jackson da Silva Magalhães, Joab Coutinho Campelo et al. 2017. “A comparative study between the
rainfall observed in Ceará and estimated by the Trmm project”, International Journal of Development Research, 7, (12), 17665-17671.
region are being used, one of them being the TRMM, whose data, whether daily or monthly, have helped in understanding the spatial and temporal distribution of precipitation along the tropical regions. This satellite, which is operated by NASA (National Aeronautics an Space Administration) and JAXA (Japan Aerospace Exploration Agency), has several sensors whose purpose is to capture the largest number of data on the main meteorological variables, such as precipitation (PR), radiation (VIRS) and (CERES), and temperature (TMI). The estimation of TRMM products has been widely used, both for results of numerical models and for combining data from surface meteorological stations. In this context, the objective of this study is to evaluate the behavior of the rainfall diurnal cycle for the state of Ceará since the start of operation of the TRMM (1998 to 2014). According to the literature, the satellite has been showing good results in terms of values obtained in soil through data collection platforms (PCD). To perform the proposed task, central trend statistics techniques were used to determine the trends in the rainfall time series over the analyzed period in order to trace the rain profile of the region and to identify the points of greatest vulnerability to the occurrence of precipitation.
Precipitation satellite estimation
The beginning of precipitation analyzes by satellite dates back to the beginning of the 1960s in different places around the globe with different methodological purposes for each region. The first satellite for this purpose was the TIROS I (Televion and Infra Red Observation Satellite), with it it was possible to obtain images of the top of the clouds and with that to estimate the occurrence and duration of the rainy events through the spectrum of clouds. In your work, Arkin (1979) established a method of estimation using a GOES infrared channel
(GeotacionaryOperational EnvirommentalSatellite)quantifying
the total precipitation on the surface of the tropics by relating cloud cover and the top temperature of the clouds. This method became known as Goes Precipitation Index (GPI) and is used today because of its ease. Their technique is based on the high correlation between the rainfall area observed by radar and the correlation between the fraction of clouds with temperatures below 235 K (~-38 °C) (Arkin and Meisner, 1987). The remote sensing defined by Mendes (1990) is the joint use of sensors aboard aircraft and spacecraft equipped to process them with the objective of analyzing the interactions between electromagnetic energy and elements that make up the earth's surface. The principle of rainfall estimation through sensing is given by the fact that the brightness of the sunlight reflected by clouds can generate an estimate of its thickness and consequently the volume of water present in the interior (Petty, 1995). Likewise, lower cloud top temperatures are associated with a vertical development and consequently a higher precipitation rate. The temperature at the top of the cloud can be obtained by means of infrared band reflectance. It is well known that the use of infrared sensors is not as efficient due to the fact that not always a bright cloud and not every cloud with a cold top is actually precipitating. Only when microwave sensors are used, since they capture the physical presence of water and ice crystals, has the estimation become more efficient when it comes to the use of embedded
sensors (Ramage et al., 2003).
The trmm project
TRMM is a space mission carried out between NASA and JAXA, to evaluate and improve the observation of
precipitation and condensation in the tropics and subtropics
along the globe (Kummerow et al, 1998). The TRMM is part
of the NASA Earth Science program, known at the time as Mission to Planet Earth, which aimed to conduct a long-term study of the Earth's system and its interaction and response to natural and human disasters for climate prediction. Launched on 27 November 1997, from the Tanegashima Space Center in Japan, the TRMM project emerged as an experimental satellite idea and because of its high operational capacity its status was elevated to that of permanent satellite. This large observational capability is related to the efficiency of instruments on board the satellite, such instruments monitor clouds, precipitation, heat flow, lightning and other aspects of the water cycle in latitudes that range approximately between 30° north and south, orbiting the earth 16 times a day (Passow, 2010). The satellite has a low-slope non-heliosynchronous oblique orbit and approximately 400 km altitude, making it very short in translation, 91 minutes, thus allowing very high spatial and temporal resolutions. The so-called oblique orbits present a different rotational speed of the planet and orbit low altitudes thus having a difference between satellites of geostationary and polar orbits causing the imaging of smaller areas and smaller temporal resolutions and relatively better spectral resolutions. In the figure below we have the types of orbits of artificial satellites.
The instruments on board the TRMM are: lightning imaging sensor (LIS), ground and cloud radiant energy sensor
(CERES), visible and infrared radiometer (VIRS),
precipitation radar (PR) and imager of microwave oven (TMI). The TMI is the main instrument for measuring precipitation, it captures information through Planck's law and temperature correlation at the top of the cloud. The satellite imagines at an NADIR angle of 49°, which results in an angle of incidence at the Earth's surface of 52.8°. Precipitation radar (PR) is used to refine the estimated data obtained, being the first meteorological radar released on board a satellite, and thus can produce three-dimensional maps of the observed locations. The PR has the capacity to detect very low precipitations, of
the order of less than 0.7 mm h-1 (Collischonn, 2006). PR is a
precipitation radar, the first to be used in space, its main functions are: to provide information on the three-dimensional structure of precipitation and in particular the vertical distribution; obtaining rainfall measurements on the oceans and continents; to improve the data collected by other embedded sensors, such as the TMI and the VIRS, through
information obtained by it (KUMMEROW et al, 1998). Figure
10 schematically shows the process of acquisition of TRMM data.
MATERIALS AND METHODS
In this work, monthly precipitation totals from the coastal region of the state of Ceará were obtained through the IRI (International Research Institute for Climate and Society), which houses a database of numerous projects for climate monitoring and analysis around the globe. The study area is inserted at coordinates 90° W at 10° E, 30° S and 15° N. The data used for analysis come from product 3B42 of the TRMM project, with intervals every 3 hours, with a spatial resolution of 0.25 x 0.25 latitude and longitude respectively, approximately 30 km, for a period between from 1 January 1998 to 31 December 2014. The values collected are derived from measurements made on the oceans and continents, which are then reanalyzed through GV (Ground Validation) and
interpreted using Ferret software. For the validation of the TRMM data, they were analyzed with the statistical indexes most used in the literature mentioned below. The data obtained from the TRMM were compared with the data of the rain gauges distributed and managed by FUNCEME (Cearense Foundation of Meteorology and Water Resources). The monthly averages, then the bias, the mean square error, the mean absolute error, the correlation and the correlation index were calculated. Here are the equations used in this work:
The bias is obtained by the value of how much the series of the variable analyzed was above or how much it was below the series observed. The bias is given in the same unit of the variable determined by the equation:
The mean square error is used as a measure of dispersion error. The NDE is determined by adding the prediction squared and dividing by the number of errors used in the calculation.
The absolute mean error is the difference between the exact value of a quantity and its estimated value obtained through numerical processing.
The correlation between two or more variables is when the changes suffered by one of them are accompanied by changes in the others. In the case of two variables x and y, it is verified whether increases or decreases in x correspond to increases or decreases in y, thus revealing whether there is a functional relationship between one variable and the other variables.
Correlation index shows the intensity of the linear association between the variables ψ and Φ. This index takes values that vary by -1 and 1, with 1 for a positive correlation and negative correlation. If the correlation is equal to zero one can affirm that one variable does not depend linearly on the other.
RESULTS AND DISCUSSION
The data below are the results of a statistical analysis performed through a comparison between the TRMM data and the data collected by rain gauges operated by Cearense Foundation of Meteorology and Water Resources.
shows the average of the accumulated rainfall in the study period for the state of Ceará in mm/day. The year of 1998 presents a very distinct characteristic, since it is a year of very For the validation of the h the statistical indexes most used in the literature mentioned below. The data obtained from the TRMM were compared with the data of the rain gauges distributed and managed by FUNCEME (Cearense Foundation of Meteorology and Water Resources). The verages, then the bias, the mean square error, the mean absolute error, the correlation and the correlation index were calculated. Here are the equations used in this work:
The bias is obtained by the value of how much the series of the ed was above or how much it was below the series observed. The bias is given in the same unit of the
The mean square error is used as a measure of dispersion error. The NDE is determined by adding the prediction errors squared and dividing by the number of errors used in the
The absolute mean error is the difference between the exact value of a quantity and its estimated value obtained through
or more variables is when the changes suffered by one of them are accompanied by changes in the others. In the case of two variables x and y, it is verified whether increases or decreases in x correspond to increases or er there is a functional relationship between one variable and the other variables.
Correlation index shows the intensity of the linear association between the variables ψ and Φ. This index takes values that elation and -1 for a negative correlation. If the correlation is equal to zero one can affirm that one variable does not depend linearly on the other.
The data below are the results of a statistical analysis performed through a comparison between the TRMM data and the data collected by rain gauges operated by Cearense Foundation of Meteorology and Water Resources. Figure 1 lated rainfall in the study period for the state of Ceará in mm/day. The year of 1998 presents a very distinct characteristic, since it is a year of very
strong El Niño event (1997-98 event). The years 2005, 2012 and 2013 stand out as years with below
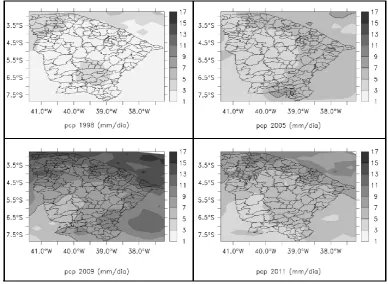
with values accumulated at a maximum of 200 mm for the year 2005 and for the other two were only close to 150 mm. It can be inferred that the years 2004, 2008 and 2009 had very high indexes, reaching values above 300 mm.
in mm/day precipitation for the rainier quarter, March, April and May (MAM) over Ceará and neighborhoods estimated by the TRMM. For the years 1998, 2005, both, dry years, and 2009, quite rainy and 2011, rainy just on the state's coastline. Darker contour lines show rainfall above 7 mm/day.
shows the rainy day cycle in the first semester (January to June) with a 3 hour time resolution, average for four grid points over the Metropolitan Region of Fortaleza (FMR). The diurnal cycles for the dry and rai
respectively, are highlighted in this
occurs preferably in the morning between 3 and 12 o'clock, with scarcer rainfall at the end of the day.
However, the diurnal cycle aspect and maximum precipitation times can vary considerably from year to year depending on local atmospheric conditions or atmospheric systems. On average, the rainfall diurnal regime in Fortaleza is continental, with maximums in the late morning period.
show the comparison between the Funceme rain gauges and the TRMM data for the years 2005, 2009 and 2011 (353, 347 and 455 rain gauges respectively), daily data with a 3 interval. In the figures the main statistics are shown, with emphasis on the agreement between rai
(rain gauges) and rainfall of the TRMM for the three years highlighted in the figures above. The non
of the analyzed data of the rain gauges with those of the satellite is given by the fact that the first one provid
space measurement, and the satellite provides a mean in a grid box with 0.25°x0.25°, approximately 30 km resolution. Comparisons would be more accurate if there were more observations in the TRMM grid box.
mentioned above, the TRMM efficiently reproduces the trends observed in the place by the rain gauges and highlighted in the figures above for the analyzed years, being a very useful tool in the study and determination of rain patterns in the Brazilian northeast.
Figure 4 shows the comparison between the pluviometers and the TRMM for the year of 2005. In it we can see that the satellite data followed quite satisfactorily reaching a correlation of 0.81, which makes the TRMM data a good product rainfall in the region analy
higher values in the 0.35 module are statistically significant at 95% according to the student t test. In the year of 2005 we had a weak El Niño, according to the ONI index and this is shown in the average values of precipitation per
0.37 (positive) we have that the TRMM overestimated the data of the rain gauges in situ.
Figure 5 represents the year of 2008, even having an above average rainfall pattern compared to figure 2 (year 2005). The values analyzed and compared are also more significant in relation to 2005, having a correlation of 0.88 and a correlation index of 0.93. Figure 6 shows the rainy day cycle for the state of Ceará in 2011, La Niña's year moderated according to NOAA through the ONI index. The mon
very high precipitation as well as the months of February, April and the end of July.
98 event). The years 2005, 2012 and 2013 stand out as years with below-average precipitation, with values accumulated at a maximum of 200 mm for the year 2005 and for the other two were only close to 150 mm. It can be inferred that the years 2004, 2008 and 2009 had very high indexes, reaching values above 300 mm. Figure 2 shows n mm/day precipitation for the rainier quarter, March, April and May (MAM) over Ceará and neighborhoods estimated by the TRMM. For the years 1998, 2005, both, dry years, and 2009, quite rainy and 2011, rainy just on the state's coastline. nes show rainfall above 7 mm/day. Figure 3 shows the rainy day cycle in the first semester (January to June) with a 3 hour time resolution, average for four grid points over the Metropolitan Region of Fortaleza (FMR). The diurnal cycles for the dry and rainy years of 2005 and 2009, respectively, are highlighted in this Figure. Precipitation occurs preferably in the morning between 3 and 12 o'clock, with scarcer rainfall at the end of the day.
However, the diurnal cycle aspect and maximum precipitation es can vary considerably from year to year depending on local atmospheric conditions or atmospheric systems. On average, the rainfall diurnal regime in Fortaleza is continental, with maximums in the late morning period. Figures 4, 5 and 6, son between the Funceme rain gauges and the TRMM data for the years 2005, 2009 and 2011 (353, 347 and 455 rain gauges respectively), daily data with a 3-hour interval. In the figures the main statistics are shown, with emphasis on the agreement between rainfall measured in situ (rain gauges) and rainfall of the TRMM for the three years highlighted in the figures above. The non-agreement in 100% of the analyzed data of the rain gauges with those of the satellite is given by the fact that the first one provides a point space measurement, and the satellite provides a mean in a grid box with 0.25°x0.25°, approximately 30 km resolution. Comparisons would be more accurate if there were more observations in the TRMM grid box. Despite the limitations , the TRMM efficiently reproduces the trends observed in the place by the rain gauges and highlighted in the figures above for the analyzed years, being a very useful tool in the study and determination of rain patterns in the Brazilian
4 shows the comparison between the pluviometers and the TRMM for the year of 2005. In it we can see that the satellite data followed quite satisfactorily reaching a correlation of 0.81, which makes the TRMM data a good product rainfall in the region analyzed. Correlations with higher values in the 0.35 module are statistically significant at 95% according to the student t test. In the year of 2005 we had a weak El Niño, according to the ONI index and this is shown in the average values of precipitation per day. With a bias of 0.37 (positive) we have that the TRMM overestimated the data
Figure 1. Monthly average precipitation (mm) over the State of Ceará 1998-2014 estimated by TRMM
Figure 2. Average rainfall for the MAM quarter obtained by TRMM
Figure 3. Daytime rainfall cycle for the years 2005 and 2009 of the TRMM compared to the total average (1998-2013)
[image:4.595.172.417.604.770.2]Figure 4. Comparison of the rain gauges on the State of Ceará and the TRMM for the year 2005
Figure 5. Comparison of rain gauges on the State of Ceará and the TRMM for the year 2009
Figure 6. Comparison of rain gauges on the State of Ceará and the TRMM for the year 2011
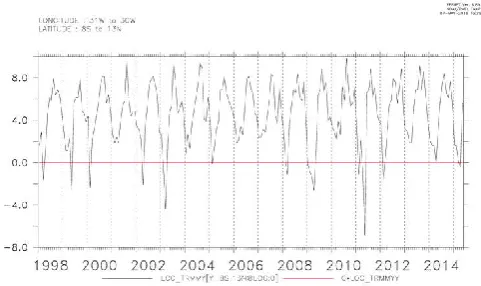
[image:5.595.97.505.399.564.2] [image:5.595.121.476.595.776.2]Figure 8. Mean monthly position of the ITCZ in relation to the equator line with latitudinal displacement
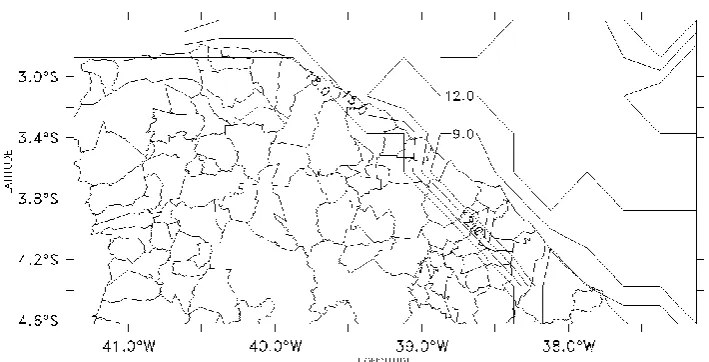
The statistical analysis was also quite significant, showing a correlation of 0.89, a very significant correlation, a bias of 0.43 overestimating the local data and an absolute error of 1.30 showing an analysis very close to the values collected by the satellite and by Funceme rain gauges. The contour isolines of Figure 7 shows, with a resolution of 3 hours, maximum precipitation times for the coastal region of the State of Ceará from the series of 1998 to 2013. We can see that in the east coast, from the MRF (Metropolitan Region of Fortaleza), the rains of greater intensity occur before 9 am and between 3 pm and 6 pm on the west coast. In the rest of the state, it is visualized that the time of greatest precipitation occurs after the 18 hours. These characteristics seem to show the displacement and performance of terrestrial breezes still influencing the east coast of the state, the action of the terrestrial breeze after midday going from the west coast to the interior leading to the convective activity due to the daytime warming. Figure 8 shows an estimated position of the ZCIT positioning relative to the equator line. The ZCIT has a very regular positioning when it is observed its position in relation to the northern hemisphere, so there is no great variation over the years regardless of the atmospheric conditions. As for its position in relation to the southern hemisphere, we can see that its peak was in 2011, a year of precipitation for the northern region of the NEB, which when compared to the climatology, coincides with a moderate La Niña event.
Conclusions and Recommendations
Precipitation data from the TRMM have been used around the world to identify the characteristics of the daily and semidiary cycles of precipitation. At the same time there is an effort on the part of the scientists to verify and validate the results of these products in relation to the precipitation observed through the conventional and automatic meteorological stations. The increase in precipitation products estimated by satellite sensing and the attempt by the scientific community to disseminate such data to related research institutions are visible with the intention of understanding the rainfall behavior of a given region. Rainfall is the main variable in the hydro meteorological cycle, and understanding its behavior in space-time has great significance, both for scientific issues and for subjects related to water resources management. In this work we used the product 3B42 and PCD's present in the state of Ceará for the purpose of evaluating the satellite product, mentioned above, and to analyze if it can describe what has been captured with the sensors in Funceme platforms in the region of study. It was evident in the climatic analyzes that
there is a concentration of rains in the dawn-morning period. From this time on, the intensity of precipitation falls sharply during the remainder of the day. We can also conclude the period (months) that rains the most in the analyzed region, the months of February, March and April, with the highest volume between March and April, during which the ZCIT (Intertropical Convergence Zone) in its southernmost position. The statistical analysis showed satisfactory results when comparing the behavior of the rainfall diurnal cycle for both Ceará and Fortaleza. We see in the graphs that when TRMM reproduces almost perfectly the data observed in situ it shows at least a tendency very close to that collected by the platforms, with this we can infer that the product 3B42 has a very considerable degree of efficiency.
In summary, the results of this study, with data from conventional observations of precipitation, showed that the semidurnal cycle of precipitation in Fortaleza-CE is modulated by the oceanic regime, and with possible direct influence of the terrestrial breeze; which was consistent with several studies in the literature for coastal areas or near the globe. The results obtained in this work will be able to subsidize with information, important sectors of society such as event tourism, civil construction and society activities in order to better program with this knowledge in order to minimize their impacts.
REFERENCES
Arkin, P, A. 1979. The Relationship between fractional coverage of high cloud and Rainfall accumulations during
GATE over the B-scalearray. Mon. Wea. Rev., 107,
1382-1387.
Arkin, Phillip A. and Meisner, Bernard N. 1987. The relationship between large-scale convective rainfall and cold cloud over the western hemisphere during 1982-84. Mon. Wea. Ver., v. 115, n. 1, p. 51-74.
Collischonn, Bruno. 2006. Use of precipitation estimated by the TRMM satellite in a distributed hydrological model. Doctoral thesis. University of Brasilia.
Kummerow, C.; Barnes W.; Kozu, T.; Shiue, J.; Simpson, J. 1998. Tropical rainfall measuring mission (TRMM) sensor
package. J. Atmos. Ocean. Tech., V. 15, p. 809-817.
MENDES, Carlos André Bulhões. Application of Remote
Sensing Techniques in the Estuarine Region of Laguna dos Patos, Rio Grande do Sul, Brazil. Dissertation (master's degree) -Universidade Federal do Rio Grande do Sul. Postgraduate Course in Water Resources and Sanitation. Porto Alegre, BR-RS, 1990.
Negrón Juárez, Robinson I. et al. 2009. Comparison of
precipitationdatasets over the tropical South American and
Africancontinents. J. Hydrometeorol, V. 10, n. 1, p.
289-299.
Passow M. J. 2010. TRMM — Tropical rainfall Measuring mission: Bringing remote sensing of precipitation into your classroom. TRMM: Trazendo o sensoriamento remoto de
precipitação para sua sala de aula. TerræDidatica,
6(1):03-08http://www.ige.unicamp.br/terraedidatica/.
Petty, G. W. 1994. Physicalretrievals of over-oceanrain rate from multichannel micro wave imagery. Part I: Theoretical
characteristics of normalized polarization and
scatteringindices. Meteorol. Atmos. Phys., v. 54, n. 1-4, p.
79-99.
Ramage, K., Jobard, I., Lebel, T. and Desbois, M. 2003.
Satelliteestimation of 1:day to 10:day cumulated
precipitation: comparison and validation over tropical Africa of TRMM, METEOSAT and GPCP products. In:
The 2003 EUMETSAT Meteorological Satellite
Conference. Weimar, Alemanha.
Rasmussen, Kristen L. et al. 2013. TRMM precipitation bias in
extreme storms in South America. Geophys. Res. Lett., v. 40, n. 13, p. 3457-3461.
Silva, Cláudio Moisés Santos. 2012. Daily and semidiary cycle of precipitation on the north coast of Brazil. Rev. Bras. Meteorol, v. 28, n. 1.
Soares, Alexleide Santana Diniz et al. 2014. Evaluation of
rainfall estimates of the TRMM satellite in the state of Paraíba.
Studart, Ticiana M. et al. 2006. Atmospheric mechanisms
associated with the occurrence of intense precipitation over the Northeast of Brazil during.