8255
USER EXPERIENCE ASSESSMENT TO IMPROVE USER
INTERFACE QUALITY ON DEVELOPMENT OF ONLINE
FOOD ORDERING SYSTEM
1HANIF AL FATTA, 2BAYU MUKTI
1Information Technology Department, Universitas AMIKOM Yogyakarta, Indonesia 2Informatics Engineering Post-Graduate Programme, Universitas AMIKOM Yogyakarta, Indonesia
E-mail: 1[email protected], 2[email protected]
ABSTRACT
User interface played a significant rule in delivering an acceptable system to the user. Many researchers have studied the use of user interface evaluation to enhance the quality of the user interface. This study aimed to improve the quality of the food ordering system by enhancing the user interface of the existing system. It is believed that the better user interface may lead to higher user satisfaction. This study analyzed user experience of food ordering system’s users using Usefulness, Satisfaction, and Ease of Use ( USE) Questionnaire. The data from 50 active customer participants as the primary user of the food ordering system is gathered and analyzed. Moreover, the result of this study showed that the utilization of USE questionnaire is successful in capturing more usability problems. The questionnaires are significantly showed the weakness of the current food ordering system and opened more possibilities for the developer to enhance and revise the user interface of the existing ordering system to deliver better service for the user.
Keywords: user interface, user experience, USE, usability.
1. INTRODUCTION
The use of information technology to support business process of an organization is widely known and implemented. However, the acceptance of the user while using the system will decide whether the system can be used for a long period or immediately should be replaced with the new one.
A too complicated user interface may result in user's frustration, fear, and failure during system's interaction. A too complicated menu, hard to understand-term, and turbulent navigation flow will decrease the quality of the software being used by the users [1]. Besides, [2] implied that the complexity of user interface might bring decision-making error that unfortunately may cause mortality effect for a specific software application, in medication-prescription software for example.
This study aimed to improve the quality of the food ordering system by enhancing the user interface of the existing system. The study is conducted by measuring the usability of the food ordering system used in Jackstar Indonesia company, located in Solo, Central Java, Indonesia. The current system has been used for almost 2 years from its first installment, and
it required immediate enhancement. This study is also conducted to address proper and precise usability issues on its user interface and giving an opportunity for the developer to make improvement easier and faster. This research utilized USE questionnaire[3] to capture more usability issues and to validate issues showed by each questionnaire. The significance of this research is reflected in the utilization of a prototype for user experience assessment. After capturing the usability issues from the existing system, a prototype enhancing the current user interface is proposed, and usability evaluation will be carried out for the prototype. The user experience assessment for the prototype is more efficient compared to the evaluation after the new system is finished.
2. BACKGROUND
2.1 USE (Usability, Satisfaction, Ease of Use)
Questionnaire
8256 it was designed in a short questionnaire to measure the most critical dimensions of usability for users. The whole dimensions and their factor is depicted in figure 1.
[ see figure page 8263]
2.2 Related works
Many researchers have used the USE questionnaire to evaluate the usability aspect of the system in use. Research by [4] showed that USE questionnaire was successful in measuring usability score for course registration system in a university. The research involved 100 participants and showed that the course registration system in use is "acceptable." Another research conducted by [5] indicated that USE questionnaire was able to measure usability issues on a university’s E-learning. This current research not only employed the USE questionnaire but also developed a prototype for new system and the user experience measurement is applied to the prototype, resulting in a more efficient way for developing the new enhanced system.
.
3. RESEARCH METHODOLOGY
3.1 Research Design
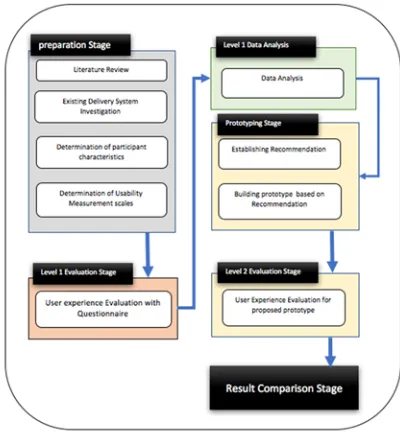
Research design to conduct user experience evaluation for Jackstar system is divided into several stages as depicted in figure 4. There are five main stages: preparation, evaluation, result analysis, prototyping, and prototype evaluation.
Preparation stage. During the preparation stage, a
literature review was conducted. The purposes of this activity to understand the theory of user interface evaluation, usability evaluation, user experience and methods to assess them. During literature review, the previous researches that studied and proposed good practices of user interface evaluation are analyzed as well to learn the best and suitable method on how to carry out user interface
Evaluation. Next activity is studied existing design. This step aimed to capture preliminary usability problem and to analyze which task that will be chosen to be evaluated by the user. Four main task of Jackstar system will be evaluated. They are Menu, Service, Shopping, Social Media, Community and
Jackstar Corporate. Followed by investigation of Participant characteristics by observing and questioning the Starjack customer and management. This step is essential to determine the participant of the questionnaire data gathering.
Moreover, finally the last activity is defining or choosing usability measurement scale, and USE questionnaire was chosen to be the measurement scales.
Level 1 Evaluation stage. This stage mainly dealt
[image:2.612.318.518.390.607.2]with data acquisition from participant or customer samples. All participants should be an active customer with online order experience and familiar with the navigation and interaction of Jackstar system. Participants will receive USE questionnaire and will complete all given questions. The measuring instrument used in this research utilized a Likert scale [6]. The measurement procedure is by asking the respondent to choose a subjective opinion by the views of each respondent. The answer consists of 7 choices ranged from Strongly Disagree (1) to Strongly agree (7).
Figure 2: Research design for user experience evaluation of Jackstar System.
Level 1 Data Analysis Stage. At this stage, the
8257 recommendations to enhance the existing Jackstar system. To enrich the results of the questionnaire Think Aloud methods are employed to sharpen the usability problems found based on questionnaires.
Prototyping stage. At this stage, 2 main activities
will be carried out. The results of data analysis on the previous stage is meant to capture usability issues in the existing system. Usability issues that are successfully identified are used as a basis for providing recommendations for design changes. Participants are involved through the Think Aloud technique [7], [8]. Selected participant will be interviewed to reveal more precise usability issues, and suggested refinement on user interface design is discussed. The result of this stage is high fidelity prototype [9] that will be analyzed for the next stage.
Level 2 Evaluation stage. After finalizing the high
fidelity prototype for the revised user interface, evaluations using the USE questionnaire were carried out again. This evaluation is the same as level 1 evaluation stage, but the user no longer evaluates the existing Jackstar system but evaluates the proposed high fidelity prototype.
Result Comparison Stage. The evaluation results of
the prototype are then analyzed in the data analysis stage. The results of data analysis from the prototype evaluation are then compared with the results in the level 1 data analysis. The improvement results from the user interface can be indicated by an increase in the evaluation score of the high fidelity prototype compared to the evaluation score of the existing system.
3.2 Population and Samples
Population for this research is the registered user of Jackstar system. The sample taken from around 100 registered Jackstar System user aged between 17 to 30 years old and the simple random sampling over the population is carried out. The sample size is determined following the Slovin’s formula, as follows :
n (1)
where : n = sample size N = population size E = error tolerance level
And According to (1), sample size (n) for this research with population size (N) of 100 and error tolerance level (e) 0f 10 % is :
n 100
1 100 0.1 50
According to a calculation based on (1), the sample size for this research is 50. 50 respondent is selected, and the evaluation required them to used Jackstar system than once to make sure they understand how to operate the Jackstar system.
3.3 Instrumentation
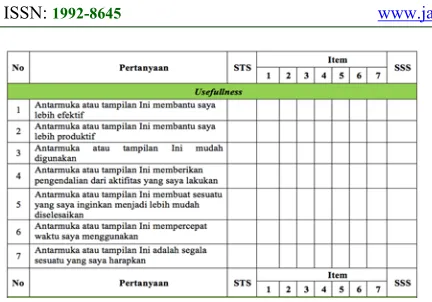
This research employed USE questionnaire and according to this questionnaire, the measurement will be carried out on four aspects: usefulness, ease of use, ease of learning and satisfaction. The questions in the questionnaire list are based on questionnaire list proposed by [3], but since the participant used the Indonesian language on their daily conversation, it is necessary to translate the questionnaire into the Indonesian language correctly. The sample of the questionnaire in the Indonesian language is presented in figure 3. This questionnaire used to investigate usability issues on the existing system, and after the high fidelity prototype is proposed based on the result of this evaluation, the same questionnaire will be used as well.
8258
Figure 3: Sample of usefulness questionnaire translated into the Indonesian language.
From its eleven items, it reduced to ten items by eliminating the item " use it without written instruction." It eliminates because of it a must for a product to be accepted by the general user to ensure their user to use it without written instruction as seen in table 2.
[image:4.612.323.516.125.337.2]On the other dimensions, ease of learning and satisfaction, all items are employed without being altered from its original version, except in term of re-written the item descriptions. Table 3 and table 4 depicted the complete questionnaire items for those two dimensions.
[image:4.612.329.514.366.460.2]Table 1. Questionnaire Items for Usefulnesss
Table 2: Questionnaire items for ease of use
No Questionnaire Items
1 The user interface is easy to use
2 The user interface is simple
3 The user interface is user-friendly
4 The user interface required the fewest steps to
accomplish the transaction
5 The user interface is flexible
6 The user interface is effortless
7 The user interface does not show any
inconsistencies during the interactions
8 Regular or occasional user likes the user
interface
9 User interface performs easy recovery from
mistakes
10 The user interface is successfully used every
time
Tabel 3. Questionnaire items for ease of learning
No Questionnaire Items
1 The user learns to use the user interface
quickly
2 The user interface is easy to remember
3
The user interface is easy to learn
4 The user become skillful with the user interface
easily
Table 4.Questionnaire items for ease of learning
No Questionnaire Items
1 The user interface satisfies the user
2 I would recommend this user interface to a
friend
3 The user interface is fun to use
4 The user interface works the way the user
wants it to work
5 The user interface is wonderful
6 The user felt to have the user interface
7 The user interface is pleasant to use
4. RESULT
4.1 Result of the level 1 Evaluation Stage
After the data acquisition process is completed, the research continued to analyze the results of the questionnaire using Likert Summated Rating (LSR). The analysis is conducted by examining 4 dimensions in USE questionnaire usefulness, ease of use, ease of learning and satisfaction. The complete
No Questionnaire Items
1 The User Interface helps me to be more
effective
2 The User Interface helps me to be more
productive
3 The User Interface is useful
4 The User Interface gives me more control over
activities In my life
5 The user interface makes the thing I want to
accomplish easier to achieve
6 The user interface saves my time in using
application
7 The user interface provides everything I
[image:4.612.96.290.435.603.2] [image:4.612.323.514.486.612.2]8259 result of those dimensions consecutively depicted in figure 4, figure 5, figure 6 and figure 7.
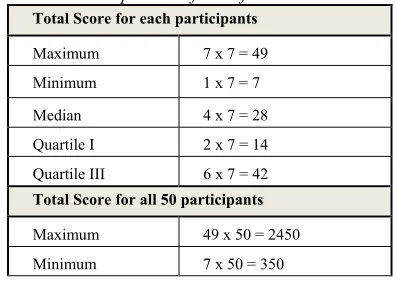
The analysis can be described as follows. For example, the usefulness dimensions will be taken. The complete result of usefulness questionnaire is presented in table 2. From data in table 5, LSR interpretation can be made. The total score for usefulness is 613. This score than is analyzed to determine the percentage index value.
% index 𝑢𝑠𝑒𝑓𝑢𝑙𝑙𝑛𝑒𝑠𝑠 𝑇𝑜𝑡𝑎𝑙 𝑆𝑐𝑜𝑟𝑒
𝑢𝑠𝑒𝑓𝑢𝑙𝑙𝑛𝑒𝑠𝑠 𝑀𝑎𝑥𝑖𝑚𝑢𝑚 𝑆𝑐𝑜𝑟𝑒 𝑥 100%
2450613 x100% 25%
From the calculation, interpretation of usefulness value is between 25% - 49.9% indicated not so successful in term of usefulness. The same calculation can be done to interpret the value of the other dimensions.
Table 6 showed detailed LSR interpretation of all dimensions. Moreover, the result of the percentage index for ease of use, ease of learning and satisfaction consecutively 22%, 18%, and 18%. All value is below 25%, indicating the user interface of Jackstar existing system has low usability level.
[image:5.612.95.293.594.735.2]In general, the result from User Interface evaluation of the existing Jackstar system showed that participants found some level of difficulties in accessing register/login form, simple search, service form and shopping form. The low index value indicates the difficulties in accessing the UI of the existing system on each questionnaire item. Thus, to address more detailed usability issues, this research analyzed each question in the questionnaire to find out which questionnaire items produced the least score given by 50 participants.
Table 5. LSR interpretation for usefulnesss
Total Score for each participants
Maximum 7 x 7 = 49
Minimum 1 x 7 = 7
Median 4 x 7 = 28
Quartile I 2 x 7 = 14
Quartile III 6 x 7 = 42
Total Score for all 50 participants
Maximum 49 x 50 = 2450
Minimum 7 x 50 = 350
Median 28 x 50 = 1400
Quartile I 14 x 50 = 700
Quartile III 42 x 50 = 2100
4.1.1. Usefulness
Result from the first item, “The User Interface helps me to be more effective," the result indicated the low effectiveness of the user interface. The total scores for 50 participants are 65 of 350 of the maximum score. It indicated only 19% of effectiveness is achieved by the user interface of the existing system. For the second questionnaire item,” The User Interface helps me to be more productive, the total scores from the participant is 76 of 350 maximum scores. This score validated the condition that only 22% of the participant found they are more productive while using the application.
Table 6. LSR interpretation for all dimensions
Dimensions Total Score Maximum Score LSR interpretation
Usefulness 613 2450 25%
Ease of use 774 3500 22%
ease of
learning 249 1400 18%
Satisfaction 446 2450 18%
8260
figure 4: Total Score on Each Questionnaire item of 50 participants for usefulness
4.1.2. Easy Of Use
[image:6.612.91.311.70.230.2]By analyzing the score of each item, this research can identify the most severe usability issues in ease of use dimensions. The lowest score is detected in item number two, " the user interface is simple," giving 62 scores of 350 maximum scores. It showed only 18% index of simplicity performed by the user interface. Almost all of the items showed the index below 30% where the highest index is 26% for item number 4. Figure 5 displayed the complete result of all item's score.
figure 5: Total Score on Each Questionnaire item of 50 participants for ease of use
4.1.3. Easy Of Learning
Low usability score also appeared on ease of learning dimensions. Learnability of the existing system is very low; the highest score is 65 of 350 belongs to the fourth questionnaire item. It indicated the user experienced difficulties in becoming skillful with the interface. The lowest score displayed by item number two, it seems the user is very hard in remembering the user interface. While low score on first and third items indicated that the user interface is hard to learn in a short time.
figure 6: Total Score on Each Questionnaire item of 50 participants for ease of learning
4.1.4. Satisfaction
[image:6.612.321.515.330.463.2]The last dimensions, satisfaction, conclude all user acceptance on this application. It is undeniable that the participants' satisfaction is very low indicating by the score of all item in thisdimensions are below
figure 7 : Total Score on Each Questionnaire item of 50 participants for satisfaction
65 of 350 of the total score. User found that the user interface is not pleasant to use, lack of fun, and they would not recommend this user interface to their friends.
4.2 Development of High Fidelity Prototype The score derived from USE questionnaire is considerably low. From the Think Aloud procedure, several issues are obtained. The user found while ordering the menu, they have to go to "service" menu, followed by "food menu" to see the list of the food and its price, so the user experienced difficulties in ordering the menu. They need a simple procedure that allowing them not to switch to the different menu if they are already select the " service" menu.
[image:6.612.92.286.402.530.2]8261
[image:7.612.99.332.67.419.2]Figure 8: Login menu prototype
Figure 9: ordering menu prototype
4.3 Result of the level 2 Evaluation Stage
The level 2 evaluation stage began as soon as the complete high fidelity prototype is created. The same participant is introduced to the prototype and giving the appropriate explanation on how the prototype worked. After several training and rehearsal, participants ready to conduct one more evaluation. It is expected that the score to all of the USE dimensions is increased.
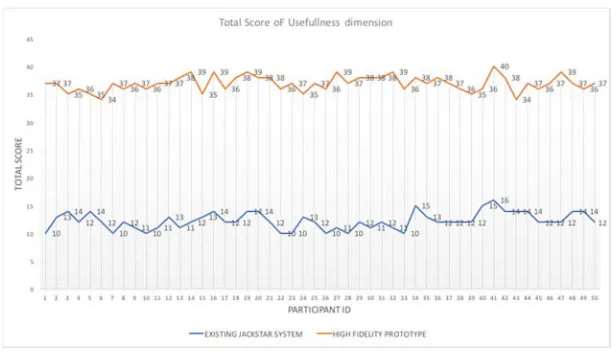
The result of high fidelity prototype evaluation showed a positive result. All total score of usefulness, ease of use, ease of learning and satisfaction dimensions increased significantly as shown in figure 10, figure 11, figure 12 and figure 13. The consecutive values of LSR interpretation for all dimensions are : 75%, 70%, 71% and 72%.
[see figure 10, 11, 12, 13 pages 8263-8264]
Table 7. Comparison of LSR interpretation of existing system vs. proposed high fidelity prototype.
Dimensions
total
score Max. score LSR inter-pretation
Usefulness existing 613 2450
25%
prototype 1848 2450
75%
Ease of Use existing 774 3500
22%
prototype 2466 3500
70% Ease of
learning existing 249 1400 18%
prototype 1000 1400
71%
Satisfaction existing 446 2450
18%
prototype 1769 2450
72%
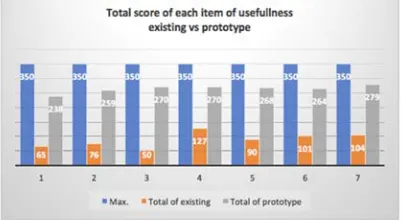
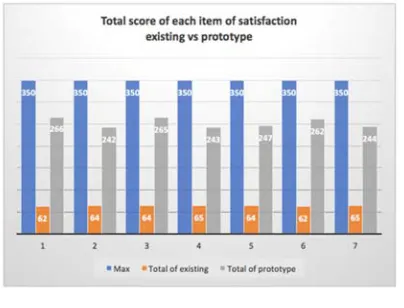
The score for each dimension is increased significantly as well. For usefulness dimension, all items of the dimensions showed the significant enhancement. Figure 14 depicted the significant increment of the questionnaire score. For example for the first item, the score of effectiveness increased from 65 to 238 of 350 of the total score, raising fro 18% to 68% of effectiveness.
The similar positive trend also appeared on the ease of use, ease of learning and satisfaction dimensions. Figure 14, 15, and 16 indicated all items in all dimensions increased significantly as proof that the Jackstar users highly accept the proposed high fidelity prototype. This prototype will immediately be followed by the development of the new system to replace the existing Jackstar food ordering system.
[image:7.612.317.518.474.584.2]8262
[image:8.612.92.294.262.382.2]Figure 15. The comparison of ease of use result: existing vs. prototype
Figure 16. The comparison of ease of learning result existing vs. prototype
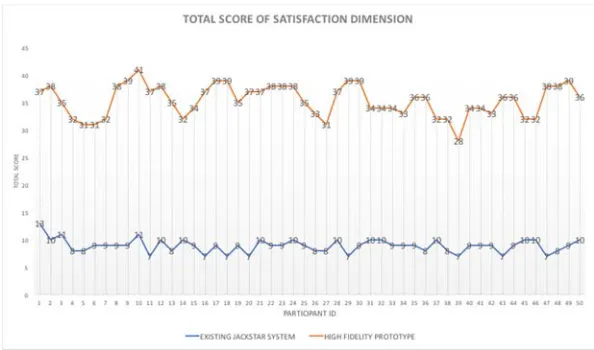
Figure 17. The comparison of satisfaction result: existing vs. prototype
5. CONCLUSION
After completing the research, some findings can be presented as followed:
The existing jackstar ordering system displayed the low usability level indicated by score derived from USE Questionnaire. Measurement in all dimensions of USE questionnaire indicated low score where usefulness score is 25%, easy of use if 22%, ease of learning is 18% and satisfaction is 18%.
The use of high fidelity prototypes allows usability measurements to be made before a real enhanced system is built. It is faster and cheaper evaluation compared to the usability evaluation conducted after the new system is entirely developed.
The result of the evaluation on the high fidelity prototype showed a high increase in all USE questionnaire dimensions. Usefulness score increased from 25% to 75%, ease of use score increased from 22% to 70%, ease of learning score increased from 18% to 71% and finally satisfaction score increased from 18% to 72%.
REFERENCES:
[1] B. Shneidermann and C. Plaisant, Designing
The User Interface : To Strategies For
Effective Human Computer Interaction, 4Th Ed. Pearson Education, 2005.
[2] E. Coiera, J. Westbrook, and J. Wyatt, “The Safety and Quality of Decision Support Systems,” IMIA Yearb. Med. Informatics, vol. 20, no. 5, pp. 20–25, 2006.
[3] A. M. Lund, “Measuring usability with the USE questionnaire,” Usability interface, vol. 8, no. 2, pp. 3–6, 2001.
[4] W. A. Kusuma, V. Noviasari, and G. I. Marthasari, "Analisis Usability Dalam User Experience pada Sistem KRS- Online UMM menggunakan USE Questionnaire," Jnteti, vol. 5, no. 4, pp. 294–301, 2016.
[5] V. Sahfitri and M. Ulfa, “Evaluasi Usability Sistem E-Learning Sebagai Aplikasi Pendukung Proses Pembelajaran di Perguruan
Tinggi Menggunakan USE
QUESTIONNAIRE,” J. Ilm. MATRIK, vol. 1, no. April 2015, pp. 53–66, 2015.
[6] R. Likert, “A Technique for the Measurements of Attitudes,” Arch. Psychol., vol. 140, pp. 1– 55, 1932.
[7] A. Dix, J. E. Finlay, G. D. Abowd, and R. Beale, Human - Computer Interaction, 3rd edition. New Jersey: Prentice-Hall, Inc, 2003. [8] J. Nielsen, T. Clemmensen, and C. Yssing,
“Getting access to what goes on in people’s heads?,” Proc. Second Nord. Conf. Human-computer Interact. - Nord. ’02, p. 101, 2002. [9] R. A. Virzi, J. L. Sokolov, and D. Karis,
[image:8.612.93.295.419.573.2]8263
[image:9.612.153.461.444.620.2]Figure 1: Complete dimensions of USE questionnaire and their factors ( source : [3] )
8264
[image:10.612.89.535.49.486.2]Figure 12: Total Score Evaluation of Easy of Use Dimension
[image:10.612.157.454.506.681.2]Figure 13: Total Score Evaluation of Easy of Learning Dimension