2368
FACTORS AFFECTING INTENTION TO USE
“SAKUKU” E-MONEY OF GENERATION Y IN INDONESIA
JERRY MARCELLINUS LOGAHAN1*,MAULANA VILIANO2, BACHTIAR H. SIMAMORA31Sekolah Kajian Stratejik dan Global Universitas Indonesia 2Universitas Pelita Harapan, Banten Indonesia 3Management Department, BINUS Business School Undergraduate Program, Bina Nusantara University,
Jakarta, Indonesia 11480
[email protected]; [email protected]; [email protected]
ABSTRACT
To succeed in the retail banking business, the bank must continue to innovate and apply the latest technologies into their business to meet the various needs of customers. Generation Y (Gen Y) is a very potential market segments, especially with the latest technology that are already phenomenal, so-called e-money or electronic e-money with a smartphone device. This study was conducted to evaluate the factors that affect on intention to use Sakuku e-money of Gen Y. Based on the Technology Acceptance Model, and previous research journals, we propose a model research with five direct and indirect factors that affect on intention to use Sakuku e-money of generation Y. This research was conducted in Indonesian territory involving 100 respondents aged 16 s / d 35 years, have a smartphone and non Sakuku users. The data collection is done by distributing a questionnaire containing 26 questions with Likert scale of 1 - 5. The data was analyzed by SEM-based PLS. After analyzing the data collected from our survey, we showed five significant factors, and two of them have the most powerful affect to increase intention to use Sakuku e-money of the Y generation in Indonesia. According to these findings, we propose some strategy on how the bank to increase the number of Sakuku e-money users of the Gen Y in Indonesia.
Keywords: Perceived Usefulness, Perceived Ease Of Use, Attitude Towards Behavior, Intention To Use.
1. INTRODUCTION
Indonesia is a potential market of retail banking as the number of Indonesia's population is 255
million, number four in the world
(IndonesiaInvestmen.com, 2016). The Central Bureau of Statistcs (BPS) launch per capita income Indonesia IDR 45.18 million per year per capita in 2015 [1]. Financing demand is increasing rapidly. In 2014, there were approximately 57.9 million SMEs in Indonesia, and in 2016 is expected to continue to grow [2].
Recently many banks in Indonesia focused on individual customers, banking products and services continue to change. They also implement new technologies into their business because it plays an important role in meeting the various demands of many customers. However, not all individuals had access to banking services that already exist today. Since the customers' needs for the means to conduct transactions is increasing and increasingly required to be able to answer the needs of today's consumers, especially for the younger segment or Generation Y (Gen-Y). Gen-Y is the generation born between the year of 1980 to 2000 and Gen-Y current positioning as the largest segment in Indonesia. For the younger
generation, they are the core prospective customer in the future.
Initially, banks in Indonesia began to develop e-money based-chip Radio Frequency Identification Device (RFID) in the form of a prepaid card that can be scanned at the merchant for offline transaction. In 2007, Bank Central Asia (BCA) developed Flazz, while Mandiri developed the E-Toll Card, Indomaret Card, Gaz Card in 2008 (later merged into the E-Money Mandiri), and Bank Rakyat Indonesia (BRI) developed BRIZZI in 2011. E-money in Indonesia continue to grow since Bank Indonesia issued Regulation Number 16/8 / PBI / 2014 dated April 8, 2014 and later amended to Regulation Number 11/12 / PBI / 2009 on Electronic Money [3].
2369 Tunai” (XL) has 1.7 million users (Selular.id, 2015). “RekPonsel” (CIMB Niaga) has 1.4 million users (CIMBNiaga, 2016). “E-Cash” (Mandiri) has 1.7 million users [5]. “Sakuku” (BCA) has 90.000 users (internal data BCA, 2016). That figures shows the continuously increasing number of e-money users in Indonesia that mostly by Gen Y.
Research on these e-money increasingly important to help the company in planning to issue electronic money products that meet the needs of consumers in Indonesia. One of the important question the author tries to explore is: "What is the reason customer chose electronic money compared to other product or brand of electronic money?" Here are three of them: 1) "I use T-Cash from Telkomsel, because many it used by many friends, ease to pay phone bill, and have many merchants" (Prita, 35 years old, T-Cash user); 2) "I Love Sakuku from BCA, because it has cool application and we can change the profile picture." (Ranny Fitriani, 27 years old, Sakuku user); 3) "I used E-Cash from Mandiri, because I interested the XXI promo 50% discount. It has many promotions. It easy to use. "(Yoyo, 25 years old, E-Cash users).
We are interested in examining the relationship between perceived usefulness, perceived ease of use, attraction, risk, and attitude towards the behavior of the intention to use e-money of Gen Y. This research is devoted to study the e-money Sakuku of BCA. Inspired by the research by Cuong, Linh, and Ha [6] researchers want to study “Factors that influence intention to use e-money Sakuku of GenY in Indonesia”.
2. LITERATUREREVIEW
Generation Y is defined as a group of the generation born in the early 1980s until the early 2000s, or those aged between 16 and 35 years. They are the generation that is familiar with the Internet and are very active in social networking media. Gen Y is known as the generation that is egocentric, self-centered and happy to show themselves. Time magazine called this generation as 'me me me generation' [7].
Electronic money (e-money) is defined as a payment instrument that satisfies the elements as follows: Published on the basis of the value of money paid in advance to the Issuer; Value for money stored electronically in a media server or chip; Used as a means of payment to the trader who is not a publisher of the electronic money; The value of electronic money managed by the Issuer is not a deposit as referred to in the legislation regulating the banking sector. The value of electronic money is the money electronically stored on a media server or chip that can be transferred for the benefit of the payment transaction and / or transfer of funds. Based
on its media or devices, electronic money is divided into two types, namely: Based on the data recording the identity of the holder, electronic money can be divided into two types, namely: Registered e-money, the electronic money holder's identity data is registered and listed on the publisher (provider); and Unregistered e-money, the electronic money holder's identity data is not registered and not registered in the issuer (BI Regulation No.14 / 8 / PBI / 2014 on Amendment to Bank Indonesia Regulation No. 11/12 / PBI / 2009 on Electronic Money),
Perceived usefulness is defined as the extent to which a person believes that the use of a particular information system will improve its performance. From these definitions in mind that perceived usefulness is an assertion about the decision-making process [8]. If someone feel confident that the system is useful then he will use it. Conversely, if a person feels confident that the information system is less useful then he will not use [9].
Perceived ease of use is defined as a person's level of confidence that in using a particular system is not necessary endeavors or free of effort [9]. Despite efforts by everyone vary different but generally to avoid rejection of the system users on the system developed, then the system must be easily applied by the user without removing the businesses that are considered burdensome. Perceived ease of use is one factor in the TAM model that has been tested in research by Davis [9].
Attraction or the charm of a new system is the extent to which an individual is interested in it. Since Facebook-banking into a new way to distribute banking services, appeal it will play an important key in user attitudes [6]. Attraction able to act as a driver of customers commitment. Attraction means that there must be something that makes attractive service providers for specific customers or vice versa [10]. Thus, the attraction may be based on the construct financial, technological or social [10]; [11].
Risk have a significant effect on the intention to use, in addition to comfort, discomfort, innovation and previous experience [12].
2370 Intention to use is the level of readiness of a person to use a particular object. Intention to use can be defined as a form of user wishes to use or reuse a particular object. Interest is one aspect of the human psyche that tends to give attention or feel happy greater to the object that can be pushed to an end [14]. Intention user behavior is the attitude or behavior that tends to keep using a technology [9].
2.1 Research Framework
The study aims to examine the relationship between Perceived Usefulness, Attraction, Perceived Ease of Use, Risk, and Attitude Toward Behavior with Intention to Use e-money Sakuku of generation Y in Indonesia. Below is the framework of this study.
Based on the framework model above, several hypotheses in this study are developed as follows:
H1: Perceived Usefulness (PU) will have a positive effect on Intention To Use (ITU) Sakuku e-money.
H2: Perceived Ease of Use (PEU) will have a positive effect on Attitude Towards Behavior (ATB) Sakuku e-money.
H3: Attraction (AT) will have a positive effect on Attitude Towards Behavior (ATB) Sakuku e-money.
H4: Risk (R) will have a negative effect on Attitude Towards Behavior (ATB) Sakuku e-money.
H5: Attitude Towards Behavior (ATB) will have a positive effect on Intention To Use (ITU) Sakuku e-money.
3. MATERIALSANDMETHODS
3.1 Data and Sample
Since launched on March 1, 2016, total Sakuku users reaches approximately 90,000 users by the end of May 2016. While Gen Y population in Indonesia amounted to around 81 million people. BCA challenge is how to market products Sakuku so that the number of users increase and reach its targets.
[image:3.612.155.462.191.332.2]Below are profiles of 100 respondents who have answered questionnaires and had been identified by gender, age, and profession.
Table 1: Profile of Respondents
Category Characteristics Number of Respondents Percentage
Gender Man 61 61%
Woman 39 39%
Total 100 100%
Age 16 – 25 years 48 48%
26 – 35 years 52 52%
Total 100 100%
Profession Student 33 33%
Employee 54 54%
Entrepreneur 8 8%
Others 5 5%
Total 100 100%
[image:3.612.151.465.556.690.2]Source: Results of Data Processing (2016) Figure 1: The research models
2371 This research is a quantitative research. The questionnaire was made using a Likert scale with internal answers 1-5 (strongly disagree, disagree, neutral, agree, and strongly agree). Likert Scale is used as a measure to determine how to agree and how disapproval of respondents to a statement on the indicator variable in the questionnaire [15]. Researcher using Structural Equation Modeling (SEM) to analyze the data and test the research model. Specifically, researchers used Partial Least Square (Smart PLS 3.0). According Ghozali and Latan [16], PLS-SEM does not require large amounts of sample. Since minimal recommended between 30 to 100 samples, the use of 30 samples for pre-test and 100 samples to be processed in this study already qualified.
4. RESULTSANDDISCUSSIONS
4.1 Measurement Model (Outer Model)
Measurement Model or Model Outer covering validity and reliability test. Validity test is done to see if each of the instruments used in each of the variables able to explain and used as a measurement of these variables [17].
In a preliminary test that spread questionnaires to 30 respondents, of the 28 indicators there are two indicators that have a value of loading factor < 0.5 is PU5 "Sakuku would help my hangout is getting better" (0.021) and AT2 "I am interested in Sakuku because people use it " (0.411). Indicators PU5 and AT2 is declared invalid or cannot explain the variables so well that did not participate in the process of further analysis.
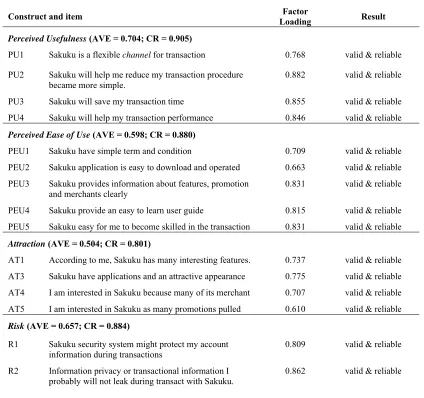
[image:4.612.95.519.341.739.2]From the results of the study in which researchers surveyed 100 respondents, Table 2 shows that all 26 indicators have validity and reliability are eligible. Rated loading factor > 0.5, AVE values > 0.5, and the value of composite reliability (CR) > 0.6.
Table 2: Outer model Test
Construct and item Loading Factor Result
Perceived Usefulness (AVE = 0.704; CR = 0.905)
PU1 Sakuku is a flexible channel for transaction 0.768 valid & reliable
PU2 Sakuku will help me reduce my transaction procedure
became more simple. 0.882 valid & reliable
PU3 Sakuku will save my transaction time 0.855 valid & reliable PU4 Sakuku will help my transaction performance 0.846 valid & reliable
Perceived Ease of Use (AVE = 0.598; CR = 0.880)
PEU1 Sakuku have simple term and condition 0.709 valid & reliable
PEU2 Sakuku application is easy to downloadand operated 0.663 valid & reliable PEU3 Sakuku provides information about features, promotion
and merchants clearly
0.831 valid & reliable
PEU4 Sakuku provide an easy to learn user guide 0.815 valid & reliable
PEU5 Sakuku easy for me to become skilled in the transaction 0.831 valid & reliable
Attraction (AVE = 0.504; CR = 0.801)
AT1 According to me, Sakuku has many interesting features. 0.737 valid & reliable AT3 Sakuku have applications and an attractive appearance 0.775 valid & reliable
AT4 I am interested in Sakuku because many of its merchant 0.707 valid & reliable AT5 I am interested in Sakuku as many promotions pulled 0.610 valid & reliable
Risk (AVE = 0.657; CR = 0.884)
R1 Sakuku security system might protect my account information during transactions
0.809 valid & reliable
R2 Information privacy or transactional information I probably will not leak during transact with Sakuku.
2372
R3 Malicious third-party may not be able to take advantage
of my account if I use Sakuku. 0.795 valid & reliable R4 I was not worried about the risk in general if I use
Sakuku. 0.773 valid & reliable
Attitude Toward Behavior (AVE = 0.610; CR = 0.886)
ATB1 I support the BCA in the provision Sakuku 0.744
valid & reliable ATB2 I would feel more comfortable if you use Sakuku. 0.824
valid & reliable
ATB3 I was cool with Sakuku. 0.739
valid & reliable ATB4 I am interested in Sakuku. 0.816
valid & reliable ATB5 I would like to introduce Sakuku on relatives and my
friends.
0.779
valid & reliable
Intention to Use (AVE = 0.567; CR = 0.839)
ITU1 I intend to use Sakuku if BCA provide it. 0.722
valid & reliable ITU2 I intend to use Sakuku, if I have a chance. 0.738
valid & reliable ITU3 I intend to use Sakuku in the near future. 0.759
valid & reliable ITU4 I intend to use regularly to transact Sakuku. 0.791
valid & reliable
Source: Authors
Discriminant validity relates to the principle that the gauges (manifest variables) distinct constructs should not correlated with height. By using the PLS algorithm, obtained Fornell and Larcker’s [18]
[image:5.612.105.519.64.328.2]Criterion table as follows: From the table 3 below can be seen that all the indicators are qualified discriminant validity.
Table 3: Fornell and Larcker Criterion
AT ATB ITU PEU PU R
AT 0.710
ATB 0.493 0.781 ITU 0.461 0.653 0.753
PEU 0.474 0.628 0.569 0.773 PU 0.497 0.556 0.544 0.446 0.839
R 0.401 0.515 0.401 0.405 0.424 0.810 Source: Authors
Structural Model (Inner Model)
By using PLS regression will be seen regression coefficient values (original sample), T-values (T-statistic) and the P-values for testing the hypothesis
[image:5.612.123.490.645.743.2]of a construct that is formed between the variables. For more details, see table 4 tests of significance following:
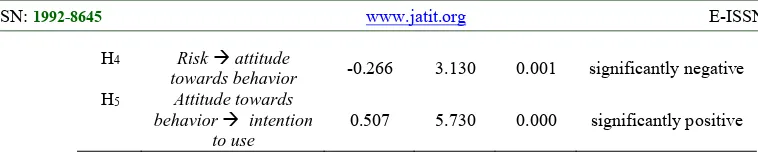
Table 4: Hypothesis Test Results
Hypothesis Path β T-value P-value Significant
H1 Perceived usefulness
intention to use 0.262 2.670 0.004 significantly positive H2 Perceived ease of use
attitude towards
behavior 0.435 4.981 0.000 significantly positive
H3 Attraction attitude
2373
H4 Risk attitude
towards behavior -0.266 3.130 0.001 significantly negative
H5 Attitude towards
behavior intention to use
0.507 5.730 0.000 significantly positive
Source: Output Source: Authors (2016)
After testing the hypothesis, the next step is to evaluate the coefficient of determination, or R2 (R-squared) in the endogenous constructs. Evaluate the value of R2 useful to judge good or bad model. Its value is between 0 - 1. R2 value of 0.67 (strong), 0:33 (moderate) and 0:19 (weak). In this study, the evaluation of the value of R2 there are two paths of endogenous variables. The first path is the perceived ease of use, attraction and influence the attitude towards risk behavior. The second path is the perceived usefulness and attitude towards behavior affect the intention to use. Evaluation of R2 can be seen in Table 4. The coefficient of determination construct attitude towards behavior = 0.4990. That
[image:6.612.99.478.70.146.2]is, the magnitude of the variation construct of attitude towards the behavior described by the construct of perceived ease of use, attraction and risk of 49.90% and the remaining 50.10% is explained by other constructs that are not incorporated into the model study. Then R2 to build the intention to use = 0.4740 which means that 47.40% of the variation is explained by the perceived usefulness and attitude towards behavior. The remaining 52.60% is explained by other constructs that are not selected in this research model. The following Table 5 Evaluation of the R-squared value of endogenous variables:
Table 5: R-squared
Source: Authors (2016)
exogenous variables endogenous variables R2 Level
Perceived ease of use
Attitude towards behavior 0.4990 moderate
Attraction
Risk
Perceived usefulness
Intention to use 0.4740 moderate
Attitude towards behavior
H1: Perceived usefulness (PU) will have a positive
effect on intention to use (ITU) Sakuku e-money
Hypothesis test results prove that there is a significant relationship between perceived usefulness of the intention to use e-money Sakuku (PU against ITU), because the value of the T-value 2.670 > 1.65. This means that if the benefits are felt by the user is higher, then the intention to use the Y generation to Sakuku will increase. Value 0.004 P-value of < 0.05 indicates that the results of hypothesis testing are a significant level either, because the error rate is only 0.4%. The regression coefficient () = 0.262 shows that the perceived usefulness has power impact for 26.20% of the intention to use, and the direction of positive influence.
H2: Perceived ease of use (PEU) will have a
positive effect on attitude towards behavior (ATB) Sakuku e-money.
2374
H3: Attraction (AT) will have a positive effect on
attitude towards behavior (ATB) Sakuku e-money.
Hypothesis test results prove that there is significant influence between the attraction of the attitude towards the behavior of e-money Sakuku (AT against ATB), since 2291 the value of T-value> 1.65. This means that if Sakuku further appeal, the attitude of the generation Y to behave positively to Sakuku would be increased, which in turn increased the Sakuku. Value P-value of 0.011> 0.05 indicates that a significant level is very good, the error rate of only 1:10%, below 5%. The regression coefficient () = 0.180 indicates that the attraction has impact strength at 18.00 % of the attitude towards behavior, and positively influence the direction.
H4: Risk (R) will have a negative effect on attitude
towards behavior (ATB) Sakuku e-money.
Hypothesis test results show that there is significant effect on the risk of the attitude towards behavior of Sakuku e-money (R against ATB), because the value of the T-value 3.130 <1.65. This means that the risks that may be perceived by the respondents when using Sakuku, will affect the attitude of generation Y in behavior towards Sakuku. The smaller the perceived risk, will further enhance the positive attitude of respondents to Sakuku. Values of 0001 P-value of < 0.05 indicates that a significant level is very good, the error rate of only 0:10%, below 5%. The regression coefficient () = 0.266 showed that the risk has impact strength of 26.60% against the attitude towards behavior.
H5: Attitude towards behavior (ATB) will have a
positive effect on intention to use (ITU) Sakuku e-money.
Hypothesis test results prove that there is a significant positive effect on the attitude towards the behavior of the intention to use Sakuku e-money (ATB against ITU), because the value of the T-value 5.730 > 1.65. This means that if the attitude of generation Y in Sakuku behavior towards more positive / more accepting, then the intention to use the Y generation of the Sakuku e-money would increase (Sakuku increasingly being used). Values of 0000 P-value of < 0.05 indicates that a significant level is very good, the error rate of only 0.00%, below 5%. The regression coefficient () = 0.507 showed that the attitude towards behavior has impact strength of 50.70% against the intention to use, and the direction of positive influence.
5. CONCLUSIONS
5.1 Conclusions
Based on this study, it can be concluded all of hypotheses are accepted, namely: 1) Perceived usefulness will affect increasing intention to use Sakuku of Gen Y; 2) Perceived ease of use will affect increasing attitude towards behavior Sakuku of Gen Y; 3) Attraction will affect increasing attitude towards behavior Sakuku of Gen Y; 4) Risk will affect decreasing attitude towards behavior Sakuku of Gen Y; 5) Attitude towards behavior will affect increasing intentions to use Sakuku of Gen Y.
5.2 Recommendations
Researchers would like to underline that in our model there are two very significant effect of relationship: Perceived ease of use against attitude towards behavior, and attitude towards behavior against intention to use.
Factors perceived ease of use is very positive influence on the attitude towards behavior. It is important to study the indicators of variables perceived ease of use and pay attention to which indicators are still weak in the eyes of the user, as well as figuring out how operational solutions to improve these indicators. Descriptive statistical variables on perceived ease of use, the mean value of the lowest of the five indicators is PEU3 Managerial implication of these findings we recommend being applied by the Bank are: o Management should develop Sakuku
architectural design to let users more easily find and use its features, and better educate the features provided by Sakuku. BCA internal data obtained from the information that the features most often used is a common feature, namely "the content of credit". While the distinctive features and mainstay Sakuku like the "split bill" was rarely used.
o Adding to the features on the list of merchants and promo agenda that do not currently exist in the menu Sakuku, which are easily found by the user.
Factors attitude towards behavior very strong positive effect on intention to use. In the descriptive statistics of variables attitude towards behavior, the lowest mean value of the five indicators are ATB3. Managerial implication of these findings suggests that: o Management should focus on increasing
2375 Education distributed through multi-media and multi content.
o Carrying a variety of brand activity for Gen Y community for them to gain experience and improve the use of Sakuku acceptance that it can add to its cool. This activity is expected to increase acceptance among Gen Y Sakuku which ultimately improves the user Sakuku.
REFERENCES
[1] Kompas.com. Meski Pendapatan Per Kapita Naik, Kesejahteraan Belum Membaik, 2016. Retieved February 16, 2016, from http://bisniskeuangan.kompas.com/read/2016 /02/09/064234426/Meski Pendapatan Per Kapita Naik Kesejahteraan Si Miskin Belum Membaik.
[2] Merdeka.com. Jumlah UMKM Indonesia 57,9 juta, terbanyak dibanding negara lain, 2014. website merdeka.com, Retrieved
August 6, 2016 , from
http://www.merdeka.com/uang/jumlah- umkm-indonesia-579-juta-terbanyak-dibanding-negara-lain.html.
[3] Bank Indonesia, Peraturan Bank Indonesia Nomor 16/8/PBI/2014 tanggal 8 April 2014 tentang Perubahan Atas Peraturan Bank Indonesia Nomor 11/12/PBI/2009 tentang Uang Elektronik (Electronic Money), 2014.
Website Bank Indonesia: 2015. Retrieved
from
http://www.bi.go.id/id/pencarian/Default.asp x?k=Peraturan%20Bank%20Indonesia%20N omor%2016/8/PBI/2014%20tanggal%208% 20April%202014%20tentang%20Perubahan %20Atas%20Peraturan%20Bank%20Indone sia%20Nomor%2011/12/PBI/2009%20tenta ng%20Uang%20Elektronik
[4] Kompas.com. Indosat Dompetku Targetkan Transaksi Rp 5 Triliun, Media Online, 2016. Retieved February 28, 2016, from http://tekno.kompas.com/read/2016/02/03/09 291927/Indosat.Dompetku.Targetkan.Transa ksi.Rp.5.Triliun
[5] Infobanknews.com. Mandiri targetkan 50 juta pengguna e-Cash 2020, Media Online, 2016. Retieved February 28, 2016, Retrieved from http://infobanknews.com/mandiri-targetkan-50-juta-pengguna-e-cash-2020/.
[6] D. X. Cuong, P. T. Linh & P. N. Ha, “Factors affecting intention to use facebook-banking of generation y in vietnam.” International
Journal of Financial Research, Vol. 6, No. 4,
2015, pp. 68-75.
[7] Femina.co.id, “Ciri Khas Gen Y,” 2015. Retrieved August 12, 2016, from, http://www.femina.co.id/article/ciri-khas-gen-y-, accessed on Agustus 12th, 2016. [8] Natalia, S. Valonia and A. D.
Handrimurtjahjo, “Factors Influencing Behavioral Intentions of Television Homeshopping with Moderating Effect of Consumer Satisfaction.” International
Journal of Economics and Management, Vol.
10, No. S1, 2016, pp. 65 – 79.
[9] F. D. Davis, “Perceived Usefulness, Perceived Ease of Use and User Acceptance of Information Technology.” MIS Quarterly, Vol. 13, No. 3, 1989, pp. 319 – 340.
[10] C. Gronroos, Service Management and
Marketing. 2nd edition. New York: Wiley.
[11] M. Sathye, “Adoption of Internet banking by Australian consumer: An empirical investigation.” International Journal of Bank
Marketing, Vol. 17, No. 7, 1999, pp. 324 –
334.
[12] Y. E. Moon & E. J. Jung, “A Study on the Determinants of Intention to Use Mobile Banking.” Journal of Information Systems, The Korean Society of Management
Information Systems,Vol. 13, 2004, pp.
89-117.
[13] M. Fishbein & I. Ajzen, Belief, attitude, intention, and behavior: An introduction to
theory and research. Reading, MA:
Addison-Wesley, 1975.
[14] E. P. Kusumah, “Utilization of On-line Application among International Students for Entry into Universiti Utara Malaysia.” Doctoral dissertation, Universiti Utara Malaysia, 2009.
[15] E. Mooi & M. Sarstedt, “Cluster Analysis”, in E. Mooi & M. Sarstedt (Eds.), A Concise
Guide to Market Research, Berlin:
Springer-Verlag, 2011, pp. 273 – 324.
[16] I. Ghozali & H. Latan, Partial least squares konsep, teknik, dan aplikasi menggunakan
program smartpls 3.0. Semarang: Badan
Penerbit UNDIP, 2015.
[17] D. Cooper & P. Schindler, Business Research
Methods (11th Ed.), Boston: McGraw Hill,
2014.
[18] C. Fornell & D. F. Larcker, “Evaluating structural equation models with unobservable variables and measurement error.” Journal of
Marketing Research, Vol. 18, No. 1, 1981, pp.
![Figure 1: The research models Source: Author adapted from Cuong et al. [6]](https://thumb-us.123doks.com/thumbv2/123dok_us/8898155.953869/3.612.151.465.556.690/figure-research-models-source-author-adapted-cuong-et.webp)