Full Length Research Article
APPLICATION OF AHP METHOD IN THE FORMATION OF A PERFORMANCE INDICATOR
FOR OPERATIONAL LEVEL PROFESSIONALS
1
*Marcos dos Santos,
2Alex Macêdo Teles Silva,
2Isis Coelho Lima,
3Fabrício da Costa Dias
and
4Ernesto Rademaker Martins
1
Department of Industrial Engineering, Federal Fluminense University, Niterói, RJ,Brazil
2
Department of Industrial Engineering, SENAI CETIQT, Rio de Janeiro, RJ, Brazil
3
Department of Civil Engineering, Federal Fluminense University, Niterói, RJ, Brazil
4
Department of Systems Engineering, Brazilian Navy - CASNAV, Rio de Janeiro, RJ, Brazil
ARTICLE INFO ABSTRACT
The studied company is a major insurer that has experienced some operational problems due to an imbalance between the evaluation criteria of employess in the regulation sector of car accidents. The company evaluates each employee according to four indicators: cost, efficiency, productivity and professionalism. However, the scores of these criteria are aggregated in the form of a simple arithmetic mean, which does not align with the company’s strategic planning. Thus, while maintaining the four criteria presented, this paper intends to suggest a weighting that is more consistent with the managerial context of the insurer, that aligns the strategic objectives of the insurance company, and based on a transparent and technically established weighting, encouraging meritocracy among the company’s employees. Due to the hierarchical and compensatory nature of the problem, the Analytic Hierarchy Process (AHP) was used, which later was validated by the sector management, and was finally adopted by the company.
Copyright©2016, Marcos dos Santos et al.This is an open access article distributed under the Creative Commons Attribution License, which permits unrestricted use, distribution, and reproduction in any medium, provided the original work is properly cited.
INTRODUCTION
According to the Superintendência de Seguros Privados
(2016), even with the Brazillian economy in recession in 2015, the insurance sector seems to run counter to news reports about the market. According to a survey conducted by the
Superintendência de Seguros Privados – SUSEP, the sector had a growth of approximately 12.4% in revenues compared to the year 2014. However, as to the superintendent of that institution, the market will gros slightly more modest next year. Buthe believes that the sector should reach the mark of 11.4% in 2016. Several reasons explain all this growth, but the most important is that people are looking for more stability, because everyone wants to be safe, trying to avoid unexpected situations, especially in a scenario of economic recession. Losing a home, car or any other high value-added asset, can bring a reat destabilization to the household budget, leading many people to opt for an insurance policy.
*Corresponding author: Marcos dos Santos,
Department of Industrial Engineering, Federal Fluminense University, Niterói, RJ, Brazil.
Moreover, natural disasters have increased in frequency and intensity in recent years, for example: tsunamis, hurricanes, floods, etc. In Brazil, we can mention: the sliding ofMorro do Bumba in city of Niterói / RJ in 2010, the rains of Região Serranado Rio de Janeiro in 2011 and the accident at SAMARCO dams in Mariana / MG in the year of 2015. Another point that boosts the insurance market is the high crime rates in large urban centers, such as robberies, murders and break-ins of homes, which are leaving the population with a high sense of insecurity, promoting the search for insurance of many kinds.
Literature Review
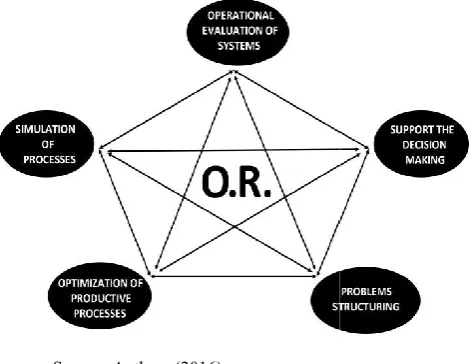
Santos et al (2016), affirm that the use of OR is justified by the fact that it is a science composed of innumerable techniques and models intrinsically related to the optimization of productive systems, that is, to produce more and better from a given quantity of inputs. Therefore, OR is an optimization tool par excellence. Operational Research supports the decision through five major activities that are interrelated as shown in Figure 1.
ISSN: 2230-9926
International Journal of Development Research
Vol. 06, Issue, 12, pp.10610-10615, December,2016
DEVELOPMENT RESEARCH
Article History:
Received 19th September, 2016
Received in revised form 22nd October, 2016
Accepted 27th November, 2016 Published online 30th December, 2016 Key Words:
Analytic Hierarchy Process (AHP), Individual Performance Indicators, Strategic Planning,
Source: Authors (2016)
Figure 1. Operational Research (OR) activities
The principles of optimization have been know
Isaac Newton (1643 – 1727) in creating Calculus, shed light on the maximization or minimization of functions, equating to zero the first derivative of them. The swiss Leonhard Euler (1707 – 1783) formally demonstrated that the “Problem of t Seven Bridges of Königsberg” had no solution, ie there was no Eulerian path that passed through the seven bridges, that way Theory of Graphs was born. Frederick Taylor (1856
was one of the earliest scholars to treat production as a scientific phenomenon, which was formalized in his
o Scientific Management of 1911. Walter Shewhart (1891 1976) developed sophisticated analytical methods for the time, in order to avoid the inspection in 100%, which, in addition to being time-consuming, was extremely costly. Such studies led to the publication of his book Statistical Method from the Viewpoint of Quality Control, published in 1939. However, it was from World Ward II that the Operational Research (OR) gained body as an applied science. Patrick Blackett in the United Kingdom and Philip Morse in the United States of America, dealt with the complex, strategic, tactical and operational problems of the war. In that belligerent environment and severe restrictions of raw material and labor, it was mandatory to make the most of all systems that were part of the theater of operations. With the end of hostilities, the OR researchers were dispensed by the government and, of course, they migrated to the other productive sectors of society, taking with them all the material of optimization techniques used during the war. From then on, the OR started to have an increasing number of applications, gaining strength in both the market and the Academy. Today, in Brazil, the OR is already consolidated in the Academy and has a significant weight in the development of models, algorithms and applications. However, in the Brazilian market, there is still room for the application of the numerous models already existing and established, especially in small and medium companies, since these usually do not have the financial backing to enable them to have a professional with this type of qualification.
Santos (2015) states that Operational Research (OR) uses mathematical and/or logicalmodels to solve real problems, presenting an eminently multidisciplinary character. Therefore, Santos (2013) also states that according to the type and complexity of the problem to be studied, the best models will be chosen to adhere to that reality. The problem
article is a typical demand forecasting application. It is known
10611 Marcos dos Santos et al.Application
Figure 1. Operational Research (OR) activities
The principles of optimization have been know for some time. 1727) in creating Calculus, shed light on the maximization or minimization of functions, equating to zero the first derivative of them. The swiss Leonhard Euler 1783) formally demonstrated that the “Problem of the Seven Bridges of Königsberg” had no solution, ie there was no Eulerian path that passed through the seven bridges, that way Theory of Graphs was born. Frederick Taylor (1856 – 1915) was one of the earliest scholars to treat production as a enomenon, which was formalized in his Principles
of 1911. Walter Shewhart (1891 – 1976) developed sophisticated analytical methods for the time, in order to avoid the inspection in 100%, which, in addition to was extremely costly. Such studies led to the publication of his book Statistical Method from the Viewpoint of Quality Control, published in 1939. However, it was from World Ward II that the Operational Research (OR) ick Blackett in the United Kingdom and Philip Morse in the United States of America, dealt with the complex, strategic, tactical and operational problems of the war. In that belligerent environment and severe restrictions of raw material and labor, mandatory to make the most of all systems that were part of the theater of operations. With the end of hostilities, the OR researchers were dispensed by the government and, of course, they migrated to the other productive sectors of em all the material of optimization
From then on, the OR started to have an increasing number of applications, gaining strength in both the market and the Academy. Today, in Brazil, the OR emy and has a significant weight in the development of models, algorithms and applications. However, in the Brazilian market, there is still room for the application of the numerous models already existing and established, especially in small and medium-sized companies, since these usually do not have the financial backing to enable them to have a professional with this type of
Santos (2015) states that Operational Research (OR) uses to solve real problems, presenting an eminently multidisciplinary character. Therefore, Santos (2013) also states that according to the type and complexity of the problem to be studied, the best models will be chosen to adhere to that reality. The problem studied in this article is a typical demand forecasting application. It is known
that every model is a simplification of reality, in order to manipulate only the decision variables that actually exert some significant influence on the studied phenomenon.
OR uses a number of tools to support the decision, pointing to the pessimistic, optimistic and most likely scenario, it will never replace the decision maker. This is a key part of the decision-making process, because it involves risks and uncertainties that will be evaluated within the managerial context of the organization. Among the range of analytical models of the OR, this article will use a multicriteria decision support model. Janis (1989) points out that a decision
process that uses simplistic strategies, affiliative rules, emotional rules, lack of organizational structure in the grouping of information, emphasis on intuition, among others, is more likely to lead to undesirable results than a high quality decision-making process. According to Eisenhart & Zbaracky (1992), rational decision-making can be characterized by the following steps:
Definition of objectives; Obtaining information;
Development of alternatives; and Choice of an alternative.
In the 70's, the first methods of Multicriteria Aid to Decision began to appear, in order to solve specific situations, in which a decision maker, acting with rationality, should solve a problem in which several were the objectives to be reached simultaneously. The methods of
Support have a scientific and at the same time subjective character, bringing with it the ability to broadly aggregate all the characteristics considered important, including non quantitative ones, with the purpose of enabling transp and systematization of decision
human mind is incapable of taking into account in a decision, all the aspects of value, knowledge and behavior that would be relevant, so it imposes limits on objective rationality. Given this, it was proposed by Simon (1997) the limited or subjective rationality, because this author considers that human beings are not absolutely rational. The Analytic Hierarchy Process (AHP) deals with an additive aggregation method with an emphasis on its own procedure for modeling the preferences of the decision maker. It was proposed by Saaty in 1980 and presents a well-structured way to establish the objectives and criteria in a hierarchical way. Another method linked to this approach was proposed to de
preferential interdependence. It is the Analytic Network Process (ANP), which adopts a multiplicative aggregation procedure (SAATY, 1980).According to Gigerenzer & Selten (2002), in an uncertain and complex world, men make decisions under constraints of knowledge, resources and time. In this context, understanding limited rationality is very important to understand how people in the real world make decisions. These authors, in order to impose greater order and coherence to the concept of limited rationality, propose the concept of "adaptive toolbox", a repertoire of fast and economic rules for decision making under uncertainty. In addition, they try to extend the scope of limited rationality from only cognitive tools to deal with
Problem
The operations directorate of the insurer uses some indicators to measure the performance of its car claim regulators for purposes of promotion, compensation, etc. However, the
Application of ahp method in the formation of a performance indicator for operational level professionals
that every model is a simplification of reality, in order to manipulate only the decision variables that actually exert some significant influence on the studied phenomenon. Although the OR uses a number of tools to support the decision, pointing to the pessimistic, optimistic and most likely scenario, it will never replace the decision maker. This is a key part of the making process, because it involves risks and ertainties that will be evaluated within the managerial context of the organization. Among the range of analytical models of the OR, this article will use a multicriteria decision Janis (1989) points out that a decision-making ses simplistic strategies, affiliative rules, emotional rules, lack of organizational structure in the grouping of information, emphasis on intuition, among others, is more likely to lead to undesirable results than a high quality According to Eisenhart & Zbaracky making can be characterized by the
Development of alternatives; and
of Multicriteria Aid to Decision began to appear, in order to solve specific situations, in which a decision maker, acting with rationality, should solve a problem in which several were the objectives to be reached The methods of Multicriteria Decision Support have a scientific and at the same time subjective character, bringing with it the ability to broadly aggregate all the characteristics considered important, including non quantitative ones, with the purpose of enabling transparency and systematization of decision-making problems process. The human mind is incapable of taking into account in a decision, all the aspects of value, knowledge and behavior that would be relevant, so it imposes limits on objective rationality. Given this, it was proposed by Simon (1997) the limited or subjective rationality, because this author considers that human beings The Analytic Hierarchy Process (AHP) deals with an additive aggregation method with an own procedure for modeling the preferences of the decision maker. It was proposed by Saaty in 1980 and structured way to establish the objectives and criteria in a hierarchical way. Another method linked to this approach was proposed to deal with situations involving preferential interdependence. It is the Analytic Network Process (ANP), which adopts a multiplicative aggregation According to Gigerenzer & Selten (2002), in an uncertain and complex world, men make sions under constraints of knowledge, resources and time. In this context, understanding limited rationality is very important to understand how people in the real world make These authors, in order to impose greater order and oncept of limited rationality, propose the concept of "adaptive toolbox", a repertoire of fast and economic rules for decision making under uncertainty. In addition, they try to extend the scope of limited rationality from only cognitive tools to deal with emotions.
The operations directorate of the insurer uses some indicators to measure the performance of its car claim regulators for purposes of promotion, compensation, etc. However, the
company has encountered some difficulties in weighing thes indicators to make up a single global indicator, leading to some distortions in the operational behavior of its experts. Thus, regulatory experts are measured in a set of distinct indicators in the provision of their services, they are: average cost, efficiency, productivity and professionalism.
cost indicator is better the lower the repair budget of the vehicle. Thus, there is a natural tendency for experts to reduce budgets in order to maximize this indicator. Another indicator is called efficiency, which measures the number of processes performed within a timely manner. Unlike the cost indicator, the efficiency indicator causes a natural increase in the budgets made by the experts. Thus establishing a trade
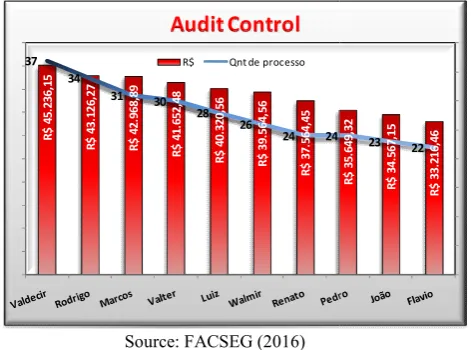
these indicators that is difficult to measure. From this context, the audited indexes of the regulated claims were raised. Figure 2 shows a ranking of the 10 employees, who had their identities preserved (using fictitious names) that obtained the highest number of processes pointed out by the external audit.
[image:3.595.45.281.274.449.2]Source: FACSEG (2016)
Figure 2. Audit Control for the month of October 2015
After some on-site interviews with the area managers, it was observed that the most frequently audited experts are the same ones that have the best efficiency indicators. Efficiency is the indicator that measures the number of processes performed within a timely manner, and there are two types of inspections: the initials that have to be performed within 24 hours of the opening of the claim by the insured at the call center and the additions that have to be performed within 48 hours.
Each regulator is measured in 4 individual indicators, however, after the interviews with the managers it was observed that the prioritization of regulators in an in
directly affecting the company strategy. Thus, the research problem was elaborated from the following question: how is it possible to generate a global indicator for each expert, with an adequate weighting of individual indicators in order to ba the trade offs between them?. The work in hand is classified as a case study and documentary, since it consists of quantitative and qualitative field research carried out in the place where the problem occurs, as well as the collection of internal do
of the company to understand the case.
METHODOLOGY
According to Vergara (2009), the universe in a research corresponds to a set of elements that have the characteristics that will become objects of study, such as companies, people, processes, among others.
R $ 45 .2 36 ,1 5 R $ 43 .1 26 ,2 7 R $ 42 .9 68 ,8 9 R $ 41 .6 52 ,4 8 R $ 40 .3 20 ,5 6 R $ 39 .5 64 ,5 6 R $ 37 .5 64 ,4 5 R $ 35 .6 49 ,3 2 37 34 31 30 28 26 24 24
Audit Control
R$ Qnt de processo
company has encountered some difficulties in weighing these indicators to make up a single global indicator, leading to some distortions in the operational behavior of its experts. Thus, regulatory experts are measured in a set of distinct indicators in the provision of their services, they are: average iciency, productivity and professionalism. The average cost indicator is better the lower the repair budget of the vehicle. Thus, there is a natural tendency for experts to reduce budgets in order to maximize this indicator. Another indicator iciency, which measures the number of processes Unlike the cost indicator, the efficiency indicator causes a natural increase in the budgets erts. Thus establishing a tradeoff between From this context, the audited indexes of the regulated claims were raised. Figure 2 shows a ranking of the 10 employees, who had their identities preserved (using fictitious names) that obtained the ted out by the external audit.
Figure 2. Audit Control for the month of October 2015
site interviews with the area managers, it was observed that the most frequently audited experts are the same best efficiency indicators. Efficiency is the indicator that measures the number of processes performed within a timely manner, and there are two types of inspections: the initials that have to be performed within 24 hours of the e insured at the call center and the additions that have to be performed within 48 hours.
Each regulator is measured in 4 individual indicators, however, after the interviews with the managers it was observed that the prioritization of regulators in an indicator is directly affecting the company strategy. Thus, the research problem was elaborated from the following question: how is it possible to generate a global indicator for each expert, with an adequate weighting of individual indicators in order to balance The work in hand is classified as a case study and documentary, since it consists of quantitative and qualitative field research carried out in the place where the problem occurs, as well as the collection of internal documents
According to Vergara (2009), the universe in a research corresponds to a set of elements that have the characteristics that will become objects of study, such as companies, people,
The sample is defined as being part of the research universe chosen as a representation of the whole.The universe of information used in this work is located in the department of regulation of car claim. Within this universe, four individual performance indicators were selected for regulators in the image regulation sector, from October 2015 to March 2016. The subjects are the employees that make up the image regulation management of the company under study. The superintendent responsible for th
along with the manager of the image regulation area, his deputy manager and his coordinators, who provided the necessary data for this project.
In OR, the data collection phase plays a critical role. This is because the availability, quantity and quality of the data available will in some way influence the choice of the model to be applied, whether analytical or not. Moreover, regardless of the model to be used, hardly any poor quality data will generate results that deserve
maxim in Engineering called GIGO, which means "garbage in, garbage out", ie "if garbage enters, garbage leaves". So, however sophisticated an analytical model may seem, it will hardly generate good results, and ultimately s
decision to the satisfaction. In this context, it must be considered that on some occasions it is preferable to take a decision blindly, than to take it with incorrect subsidies. data collected in this study were taken from company documents, as well as company reports and electronic spreadsheets for area control. In addition, an interview was held with the superintendent of the regulatory area on December 10, 2015, in which he was instructed to establish a parity comparison among the i
according to the Saaty Fundamental Scale. According to Vergara (2009), the data treatment refers to the section in which it is explained how to treat the data collected.
Mathematical Modeling
According to Saaty (1980), it is observed that, although the differences between the stimuli follow a geometric scale, their perception by the individual obeys a linear scale. However, there is also the so-called psychological limit, which the human being can, at most, correctly judg
nine points to distinguish these differences. For these reasons, Saaty (1980) defined the Fundamental Scale presented in Table 1.
Table 1. Fundamental Scale of Saaty
Source: Saaty (1980)
R $ 35 .6 49 ,3 2 R $ 34 .5 67 ,1 5 R $ 33 .2 16 ,4 6 23 22
The sample is defined as being part of the research universe chosen as a representation of the whole.The universe of information used in this work is located in the department of regulation of car claim. Within this universe, four individual rformance indicators were selected for regulators in the image regulation sector, from October 2015 to March 2016. The subjects are the employees that make up the image regulation management of the company under study. The superintendent responsible for the area of regulation of claims, along with the manager of the image regulation area, his deputy manager and his coordinators, who provided the
In OR, the data collection phase plays a critical role. This is ilability, quantity and quality of the data available will in some way influence the choice of the model to be applied, whether analytical or not. Moreover, regardless of the model to be used, hardly any poor quality data will great consideration. There is a maxim in Engineering called GIGO, which means "garbage in, garbage out", ie "if garbage enters, garbage leaves". So, however sophisticated an analytical model may seem, it will hardly generate good results, and ultimately support the decision to the satisfaction. In this context, it must be considered that on some occasions it is preferable to take a decision blindly, than to take it with incorrect subsidies. The data collected in this study were taken from company-owned uments, as well as company reports and electronic spreadsheets for area control. In addition, an interview was held with the superintendent of the regulatory area on December 10, 2015, in which he was instructed to establish a parity comparison among the individual indicators of the area, according to the Saaty Fundamental Scale. According to Vergara (2009), the data treatment refers to the section in which it is explained how to treat the data collected.
t is observed that, although the differences between the stimuli follow a geometric scale, their perception by the individual obeys a linear scale. However, called psychological limit, which the human being can, at most, correctly judge 7 ± 2 points, that is, nine points to distinguish these differences. For these reasons, Saaty (1980) defined the Fundamental Scale presented in
Definitions of reciprocals: When an activity
activity j receives one of the values in table 1, the activity relation to i will receive the reciprocal value. Each pairwise comparison represents an estimate of the coefficient of priorities or weights of each element.Therefore, when the hierarchical structure is defined, a comparison is made alongside each alternative within each criterion of the next higher level, that is, for each criterion will be related the alternatives properly applied in the verbal scale presented above. With this, verbal judgment becomes a scale of numerical values.Using the decision matrix A, the AHP Method calculates partial results of the set A within each criterion denominating the impact value of alternative j in relation to alternative i, where these results represents numerical values of the verbal assignments given by the decision maker at each comparison of alternatives. These results are normalized by the expression:
Where n corresponds to the number of alternatives or elements compared. Each part of this sum consists of:
This causes the priority vector of alternative i to the criterion to be:
For example, suppose that a decision maker, using a set of alternatives under criterion , has arrived at the following decision matrix:
Where m corresponds the criterion number of the same level. The priority vector is calculated
Finally, an aggregation process allows to generate the final values of the alternatives, ordering them by the follo additive function:
Remember that n is the number of alternatives. In this way, a global ordering is obtained by means of an overall value function.
Decision Matrix
The decision matrix is the representation of the data of all the employees with respect to the indicators average cost, efficiency, professionalism and productivity. All data were normalized to allow cross-criteria comparison. Therefore, Table 2 below presents the decision matrix of the company's regulators.
10613 Marcos dos Santos et al.Application
Definitions of reciprocals: When an activity i in relation to an receives one of the values in table 1, the activity j in will receive the reciprocal value. Each pairwise comparison represents an estimate of the coefficient of rities or weights of each element.Therefore, when the hierarchical structure is defined, a comparison is made alongside each alternative within each criterion of the next higher level, that is, for each criterion will be related the pplied in the verbal scale presented above. With this, verbal judgment becomes a scale of numerical values.Using the decision matrix A, the AHP Method calculates partial results of the set A within each denominating the impact value of , where these results represents numerical values of the verbal assignments given by the decision maker at each comparison of alternatives. These
ber of alternatives or elements
This causes the priority vector of alternative i to the criterion
For example, suppose that a decision maker, using a set of arrived at the following
corresponds the criterion number of the same level.
Finally, an aggregation process allows to generate the final values of the alternatives, ordering them by the following
is the number of alternatives. In this way, a global ordering is obtained by means of an overall value
[image:4.595.307.561.73.289.2]The decision matrix is the representation of the data of all the pect to the indicators average cost, efficiency, professionalism and productivity. All data were criteria comparison. Therefore, Table 2 below presents the decision matrix of the company's
Table 2. Decision matrix
Source: Authors (2016)
Normalized Decision Matrix
[image:4.595.36.291.339.646.2]The normalized decision matrix shows all values in the range of 0 to 1 and dimensionless, Table 3 represents the Normalized Decision Matrix of the car claim regulators.
Table 3. Normalized decision mat
Source: Authors (2016) Weighting Matrix
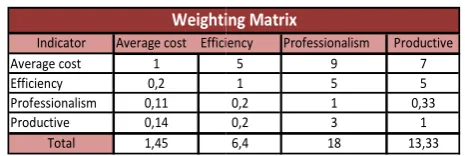
The weighting matrix is an inter
[image:4.595.310.558.382.579.2]performed from the Saaty Fundamental Scale. Thus, the assistance of the subject specialist was necessary. In this case, an interview was conducted with the superintendent of car claims regulation area. With this, the weighting matrix presented in Table 4 was elaborated.
Table 4. Weighting matrix
Source: Authors (2016)
Experts
João R$ 4.477,01 0,0002233634287292
Valter R$ 4.660,36 0,0002145756474184
Valdecir R$ 6.433,06 0,0001554469706650
Sebastião R$ 4.005,47 0,0002496588840451
Luiz R$ 5.847,52 0,0001710125762649
Carlos R$ 4.118,13 0,0002428289573532
Andre R$ 4.041,81 0,0002474140814275
Rodrigo R$ 5.198,62 0,0001923587968611
Pedro R$ 4.547,10 0,0002199201655965
Fernando R$ 3.875,63 0,0002580222529803
Flavio R$ 3.945,59 0,0002534475198893
Renato R$ 3.966,65 0,0002521018719550
Walmir R$ 5.795,55 0,0001725461776708
Marcos R$ 6.021,92 0,0001660600029089
Vitor R$ 4.339,26 0,0002304539502653
Maycon R$ 4.305,09 0,0002322833299145
Gabriel R$ 4.201,19 0,0002380279610334
Miltom R$ 4.161,07 0,0002403226013698
Total
Decision Matrix
Average cost
0,0039598451763481
Experts João Valter Valdecir Sebastião Luiz Carlos Andre Rodrigo Pedro Fernando Flavio Renato Walmir Marcos Vitor Maycon Gabriel Miltom Total
0,0606898983842062
Normalized Decision Matrix
0,0555375666983320 0,0651596821313871 0,0640044013344560 0,0636645779640163 0,0435739706949671 0,0419359837351255
Average cost
1,0 0,0564071115869221 0,0541878881275452 0,0392558203016256 0,0630476377046934 0,0431866824708969 0,0613228413079293 0,0624807461931269 0,0485773529758370
0,0581977173354666 0,0586596999554198 0,0601104210980469
Indicator Average cost Efficiency
Average cost 1
Efficiency 0,2
Professionalism 0,11
Productive 0,14
Total 1,45
Weighting Matrix
Application of ahp method in the formation of a performance indicator for operational level professionals
Decision matrix
The normalized decision matrix shows all values in the range of 0 to 1 and dimensionless, Table 3 represents the Normalized Decision Matrix of the car claim regulators.
Normalized decision matrix
The weighting matrix is an inter-criteria parity comparison performed from the Saaty Fundamental Scale. Thus, the assistance of the subject specialist was necessary. In this case, d with the superintendent of car claims regulation area. With this, the weighting matrix presented in Table 4 was elaborated.
Weighting matrix
Efficiency Professionalism Productive
0,0002233634287292 0,85 3 0,81
0,0002145756474184 0,92 1 0,92
0,0001554469706650 0,99 1 0,94
0,0002496588840451 0,75 1 0,9
0,0001710125762649 0,97 2 0,9
0,0002428289573532 0,82 2 0,85
0,0002474140814275 0,54 2 0,98
0,0001923587968611 0,98 4 0,91
0,0002199201655965 0,90 2 0,89
0,0002580222529803 0,71 3 0,95
0,0002534475198893 0,83 2 0,78
0,0002521018719550 0,91 1 0,83
0,0001725461776708 0,92 1 0,82
0,0001660600029089 0,98 3 0,84
0,0002304539502653 0,81 1 0,86
0,0002322833299145 0,77 1 0,81
0,0002380279610334 0,89 2 0,8
0,0002403226013698 0,75 1 0,9
15,28604973 33 15,69
Decision Matrix
Efficiency Professionalism Productive
0,06 0,09 0,05
0,06 0,03 0,06
0,06 0,03 0,06
0,05 0,03 0,06
0,06 0,06 0,06
0,05 0,06 0,05
0,04 0,06 0,06
0,06 0,12 0,06
0,06 0,06 0,06
0,05 0,09 0,06
0,05 0,06 0,05
0,06 0,03 0,05
0,06 0,03 0,05
0,06 0,09 0,05
0,05 0,03 0,05
0,05 0,03 0,05
0,06 0,06 0,05
0,05 0,03 0,06
1,0 1,0 1,0
Normalized Decision Matrix
Efficiency Professionalism Productive
5 9 7
1 5 5
0,2 1 0,33
0,2 3 1
6,4 18 13,33
Weighting Matrix
[image:4.595.317.550.701.779.2]Normalized Weighting Matrix
[image:5.595.99.223.318.421.2]All values of the weighting matrix were normalized, as presented in Table 5.
Table 5. Normalized weighting matrix
Source: Authors (2016)
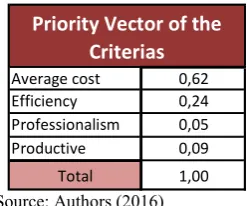
Priority Vector of the Criterias
From the normalized weighting matrix, the arithmetic mean of each row of the matrix was calculated, resulting in the priority vector, according to Table 6, below.
Table 6. Priority vector of the criterias
Source: Authors (2016)
Tabela 7. Ranking of experts
Source: Authors (2016)
Ranking of Regulators
The ranking of the regulators is obtained by multiplying the decision matrix normalized by the priority vector of the criteria. Therefore, the classification of regulators is presented in Table 7 below. At the time of presentation of the problem, it
can be seen that the claims regulators Valdecir, Rodrigo and Marcos are the three that present the highest values for the cost indicator, so they are the most audited employees. Thus, the result achieved by the model is appropriate to the managerial context presented, given that the referred experts are in the second half of the ranking, especially the collaborator Valdecir who was the most audited and not by chance is in last place in the ranking. Still analyzing the particular case of the employee Valdecir, it is verified that it presents the greatest efficiency indicator, probably for increasing the budget of the claims. It is interesting to note that, even with an excellent efficiency indicator, the AHP method was not skewed by this particular indicator. A simplistic analysis may lead one to believe that the greater weight of the criterion cost in relation to the other criteria, when weighting them through the Saaty Fundamental Scale, inevitably led the collaborator Valdecir to the last ranking. However, it is noticed that the collaborators Rodrigo and Marcos are not in 17th and 16th positions respectively. This is because AHP is a compensatory method, that is, they may have performed poorly on the cost criterion, but have gone very well on the other criteria. It is even observed that the expert Marcos, by a position, is not in the first half of the ranking.
Conclusion
The AHP method has the advantage that allows the decision maker to judge the importance of the tangible and intangible criteria, as well as to measure the consistency of this judgment and to be able to process these judgments in an analytical way. However, the subjective nature of the judgments in the assigned weights is one of the disadvantages of the method, and in some cases may lead to results that are not in agreement with the objective. The scale used is not obvious, with the possibility of reverse evaluations occurring and the comparison between two criteria can be represented by different scales. The mapping of the main indicators that should be taken into account in the evaluation of each professional was done by means of an interview with the superintendent of the regulation area of car claim, meeting the following criteria: Average Cost, Efficiency, Productivity, Professionalism. Soon after this stage, a parity comparison of the indicators with the superintendent was carried out. Therefore, the Saaty Fundamental Scale was used for this comparison. Finally, from the normalized weighting matrix, the priority vector of the indicators was established, which led to the performance ranking of the regulators. The AHP Method hierarchized the collaborators through the inter-criteria parity comparison made from the Saaty Fundamental Scale. The application of the AHP Method showed that with the multiplication of the decision matrix normalized by the priority vector of the criteria it was possible to formulate a performance indicator for the claim regulators. The objective was to change the operational culture of the claims regulation sector through image. Regulators were focused only on having good results in the efficiency indicator, so the other indicators were left to be desired. Such distortion was corrected by the application of the AHP method.
REFERENCES
Almeida, A. T. 2013. Processos de decisão nas organizações: construído modelos de decisão multicritério, Publisher: Atlas, 1st edition, Brasil.
Indicator Average cost Efficiency Professionalism Productive
Average cost 0,69 0,78 0,50 0,53
Efficiency 0,14 0,16 0,28 0,38
Professionalism 0,08 0,03 0,06 0,02
Productive 0,10 0,03 0,17 0,08
Total 1,00 1,00 1,00 1,00
Weighting Matrix
Average cost 0,62
Efficiency 0,24
Professionalism 0,05
Productive 0,09
Total 1,00
Priority Vector of the
Criterias
Classificação Perito Nota
1º Fernando 6,2%
2º Flavio 6,0%
3º Renato 6,0%
4º Gabriel 5,9%
5º Carlos 5,9%
6º Sebastião 5,8%
7º João 5,7%
8º Pedro 5,7%
9º Rodrigo 5,7%
10º Miltom 5,6%
11º Andre 5,6%
12º Vitor 5,5%
13º Valter 5,5%
14º Maycon 5,5%
15º Marcos 5,0%
16º Luiz 5,0%
17º Walmir 4,8%
18º Valdecir 4,7%
[image:5.595.72.254.456.701.2]Batermann, T. S.; Snell, S. A. 1998. Administração: Construindo vantagens competitivas. Publisher : Atlas, São Paulo, Brasil.
CNSEG, Confederação Nacional das Empresas de Seguros Gerais, Previdência Privada e Vida, Saúde Suplementar e Capitalização. Available online at<http://www.cnseg.org.br/cnseg/mercado/historia-do-seguro/no-brasil.html>. Accessed on: 18 Feb 2016.
Costa N. P. L. O. 2007. Qualidade e competência nas decisões.Publisher: Blucher, 1st edition. São Paulo, Brasil. Eisenhart, Kathleen M.: Zbaracki, Mark J. 1992. Strategic Decision Making. Strategic Management Journal, 13, pp. 17-37.
Gigerenzer, G.: Selten, R. 2002. Bounded rationality – The adaptive Tool-Box. MIT Press.
JANIS, Irving L. (1989) Crucial decissions. NY: Free Press. Kaplan, R. S.; Norton, D. P. 2008. A Execução Premium: a
obtenção da vantagem competitiva através do vínvulo da estratégia com as operações do negócio.Publisher: Editora Campus Elsevier. Rio de Janeiro, Brasil.
Lachtermarcher, Gerson. 2009. Pesquisa Operacional na tomada de decisão. São Paulo: Pearson Prentice hall. Longaray, A. A. 2013. Introdução à pesquisa operacional.
Publisher: Saraiva, 1st edition. São Paulo.
March, J.; Simon, H. 1979. Teoria das organizações. F. Getúlio Vargas, 4th edition. Rio de Janeiro Brasil.
Martins & Marini. 2010. Guia de Governança para Resultados.
Pritchard, A. 1969. Statistical bibliography or bibliometrics?
Journal of Documentation, [s. l.], 25, n.4, pp. 348-349. Saaty, Thomas L. 1991. Método de análise hierárquico. São
Paulo: MacGraw-Hill.
Santos, M. et al. Simulation of Operation of an Integrated Information for Emergency Pre-hospital Care in Rio de Janeiro Municipality. Elsevier - Procedia Computer Science, v. 55, p. 931-938, 2015.
Santos, Marcos dos et al. 2016. Proposta de otimização do mix de produção utilizando o Método Simplex: um estudo de caso de uma confecção de moda íntima do município de Cordeiro – RJ. In: Anais do IV Simpósio de Engenharia de Produção: Lean Cost Management como filosofia global de otimização em organizações. Recife (PE): FBV, 2016. Santos, Marcos. 2013. Simulação da Operação de um Sistema
Integrado de Informações para o atendimento pré-hospitalar de emergência no município do Rio de Janeiro. Dissertação de M.Sc., COPPE/UFRJ, Rio de Janeiro, Brasil, 2013.
Simon, H. 1997. Administração Behavior. 4th Edition. New York: The Free Press, 1997.
Susep, Superintendência de Seguros Privados. (2016) Avaible in <http://www.susep.gov.br/>.
Vergara. S.C. 2009. Projetos e relatórios de pesquisa em administração. 10ª edição.Pulisher: Atlas, 10th edition. São Paulo, Brasil.