Mapping Activity Diagram to Fuzzy GSPN
Elmira Kolyaie
Islamic Azad University Tehran North Branch Dept. of Computer Engineering
Tehran, Iran
Ali Harounabadi
Islamic Azad University Central Tehran Branch Dept. of Computer Engineering
Tehran, Iran
ABSTRACT
Non-functional requirements’ assessment of enterprise architecture in system development, is important for organizations, and makes them protected from additional costs. For this goal Organizations should model their data and processes. Nowadays UML is considered as the most important modeling language, but because it’s a semi-formal language, it’s not qualified for assessment the system, for this in order to evaluate system, UML should transfer to a formal language such as Petri nets.
In this paper, a new approach for transforming UML activity diagram to a hybrid Petri net is proposed. This hybrid Petri net is a composition of generalized stochastic Petri nets and Fuzzy Petri nets. Here GSPN has been used to show the time of activity and use them in performance calculation and in order to show the uncertainty in the data and processes of an organization the fuzzy discussion is considered. By combination of FCPN and GSPN a new Petri net is proposed which is called fuzzy generalized stochastic Petri nets. An Order processing system is used to show the performance and the accuracy of the algorithm.
Keywords
UML, Activity Diagram (AD), Generalized Stochastic Petri Net (GSPN), fuzzy Petri net, Evaluate Performance, nonfunctional parameters
1.
INTRODUCTION
Nowadays, UML diagrams are widely used in system design and they can use to describe the system architecture [1]. This language has developed a powerful set of predefined modeling elements, diagrams and structure to describe the structural and behavioral properties of system architecture and the introduction of appropriate tools to support it [2]. Unfortunately, this language is only capable of modeling some specific information systems, where there is no uncertainty in the model. However, when uncertainty is considered in UML, the extended version named Fuzzy-UML will be produced [3].
UML is a semi-formal language, so the evaluation of non-functional requirements of the system is not possible, for this it is necessary to transfer the UML diagrams into a formal model such as Petri net, the formal model helps designers identify problems before implementation of the system in order to immune enterprise from additional costs.
Semi-formal language UML includes five behavioral diagrams: use case diagram, activity diagrams, state diagrams, sequence diagrams and collaboration diagrams. These diagrams play a key role in the dynamics behaviors of the system.
Here UML activity diagram is transformed to a hybrid Petri net. This hybrid Petri net is a composition of generalized stochastic Petri nets and Fuzzy Petri nets. We use GSPN to show the time of activity and use them in performance calculation and in order to show the uncertainty in the data and processes of an organization the fuzzy discussion is considered. By combination of FCPN and GSPN a new Petri net is proposed which is called fuzzy generalized stochastic Petri nets. Required Information for assessing the performance is added to the activity diagram as a notation and the notations have been considered in transforming to generalized stochastic Petri nets.
This paper consists of five sections, the next section introduces the generalized stochastic Petri nets, in the third Part, due to the importance of the uncertain data and processes in the organization, FUZZY topics has been discussed (here fuzzy activity diagram is considered), in the fourth section will described how fuzzy entered in generalized stochastic Petri net and finally a use case study will be explained to make the proposed algorithm clear.
2.
GSPN
Generalized Stochastic Petri nets are one of the extensions of Petri nets which are used for performance and dependability evaluation [4]. There are two types of transitions: immediate transitions and time transition. A random distributed function is used for firing in timed transition, and the immediate transitions are fired as soon as they become enabling. These networks are appeared, for analyzing the performance in various systems such as distributed computing network, network communication protocols, flexible manufacture and etc.
Formally, a GSPN model is an 8-tuple: GSPN = (P, T,𝜋, I, O, H, W, M)
Where P is the set of places, T is the set of immediate and timed transitions , 𝜋 , is the priority function that maps transitions Onto natural numbers representing their
priority
level, By default, timed transitions have priority equal to zero; I;O; are the input, output, inhibition functions, respectively, that map transitions onto the power set of P; is the weight function that assigns real (positive) numbers to rates of timed transitions and to weights of immediate transitions. Finally, is the initial marking function [5].3.
FUZZY PETRI NET
The following
fuzzy
Petri Net (FPN) structure can be used to model fuzzy rules [3,5,6,7,8,9,10].
FPN=( P, , , T , TF , TRTF , A, I , O, TT , TTF , AEF , PR , PPM , TV ) ,
1. P: is a finite set of fuzzy places. Each place has a property associated with it, in which:
is a finite set of input places for primitive events.
is a finite set of output places for actions or conclusions.
2. T: is a finite set of fuzzy transitions. They use the values provided by input places and produce values for output places.
3. TF: is a finite set of transition functions, which perform activities of fuzzy inference.
4. TRTF: T TF is transition type function, mapping each transition T to a transition function TF. 5. A (P×T T× P) is a finite set of arcs for connections between places and transitions.
Connections Between the input places and transitions (P ×T) and connections between the transitions and output places (T × P) are provided by arcs. In that:
I: P T is an input mapping. O: T P is an output mapping.
6. TT is a finite set of fuzzy token (color) types. Each token has a linguistic value (i.e., low, medium and high), which is defined with a membership function.
7. O: T P is token type function, mapping each fuzzy place P to a fuzzy token type TT.
A token in a place is characterized by the property of the place and a level to which it possesses that property.
8. AEF: Arc Expression is arc expression function mapping each arc to an expression, which carries the information (token values).
9. PR is a finite set of propositions, corresponding to either events or conditions or actions/conclusions. 10. PPM: P [0, 1] is a fuzzy place to proposition mapping, where| PR| = |P|.
11. TV: P [0, 1] is truth values of tokens (μi) assigned to places. It holds the degree of membership of a token to a particular place.
4.
FUZZY ACTIVITY DIAGRAM
Activity diagrams (ADs) are just a variant of UML state machines, unlike the state diagram, which focuses on the role of activities in performance, ADs stress on the internal flow. It describes the activities that are being performed in the system which is displayed in state diagram by doActivities.
Activity diagram is one of the most important UML diagrams, since it has got momentous efficiency in designing stage of software. This diagram helps us to define operations better. It gives the programmer the ability of implementing efficient classes. This diagram has got its activities, states and transitions [11].
Use case diagram do not show orders of implementation of use cases. To achieve this grand, activity diagram can be used to display system activity. A simple activity diagram comprises 6 sections:
Start state Different activities Events
Conditions Transitions Decisions Fork Join Final
According to these explanations, a fuzzy activity diagram is a graphical model in Fuzzy- UML which shows the different levels of a fuzzy object in its real world life cycle. This
diagram uses fuzzy rules for transforming the action1 of an object to another action. A fuzzy rule is shown as below: [4,5].
<on event list <event threshold>> If condition list <EC coupling> Then action
Fuzzy rules are used to show the real world rules for an object in which these rules can be active or deductive. Each section of the activity diagram can be transformed to a fuzzy activity diagram. Table 1 shows these transformations.
Table 1: Transformation of an activity diagram into its fuzzy
Activity diagram Fuzzy activity diagram
activity Action of rule
[condition] [Fuzzy condition]
event Fuzzy event
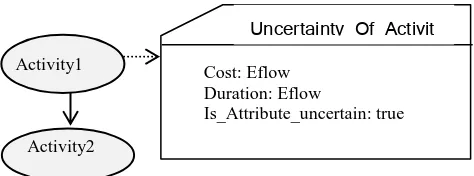
Except the above mentioned for fuzzy activity UML there are other aspects of Activity that can be in fuzzy mode [11]: 1- Uncertainty in duration and Cost of an activity
2- Iterative between activities or between the phases of activity.
[image:2.595.312.549.399.487.2]These uncertainties can show with stereotypes which is show below:
Figure 1. Stereotype for uncertainty in Cost and duration
For Performance annotations to annotate routing rates and action durations, consider the stereotype PAstep with its tag definitions PAprob and PArespTime, respectively [12]:
PArespTime =(<source-modifier>,'max',(n,'s.')), Or
PArespTime = (<source-modifier>,'dist',(n-m,'s.')). Where
<source-modifier>::= 'req'j'assm'j'pred'j'msr';'dist' Annotations will be attached to transitions in order to allow the assignment of different action durations depending on the decision.
5.
Mapping Activity Diagram TO FGSPN
Transformation of activity diagram to generalized stochastic petri net is done in two steps [2]:
First step: converting the output transition, loops, and operations.
Simple activities are operations that have at least one outgoing transition and displayed with immediate transitions.
Timed activities: it has been said that to determine the duration of activity, stereotypes are been used. PAprob stereotypes shows as Timed activity with transition probability of P (PAprob) and stereotypes PAresptime shows as the Timed activity with transition probability 1/ P (PArespTime). With the passage of time and other activities that are instant in time.
Timed Activity is shown by timed transition and non-Timed activities are shown by Simple transitions in CPNTOOLS.
Decisions: before transforming Activity diagram to GSPN, Decisions should be process that can be considered as a transition of simple Activity. This transition can be considered as the successor transition and Fuzzy Conditions are implemented in this transition.
Join: The integration of flow control to be forked by the decisions and they are considered as an input transition. Table 2 is shows the equivalent of activity diagram in GSPN. The abstraction of transforming activity diagram to a combination of fuzzy petri net and a generalized stochastic Petri net is as follows:
1- UML activity diagram is drawn with performance annotation and with annotation to specify uncertainty of Time Duration.
2- UML component diagrams are plotted in previous step (except Decisions) are converted to GSPN separately and finally combine together. In this transformation each activity converts to a place. <<PAprob>> and <<PAresptime>>transform to place-immediate transition-place-timed transition. Decisions will show as a successor Transitions in this diagram.
3- Decisions change to fuzzy rules and the equivalent fuzzy petri net will be drawn. This Fuzzy petri net is related to successor transition in previous step. In This Case, the conditions of events are extracted from Fuzzy-Activity Diagram and a table like table in [4] will be created. Finally the fuzzy diagram for the conditions will be added to the created GSPN in previous steps.
6.
CASE-STUDY
Here to explain more about suggested algorithm, an example will represented. In figure 2 an activity diagram is represented which there are some fuzzy rules and some stereotypes are specified in it.
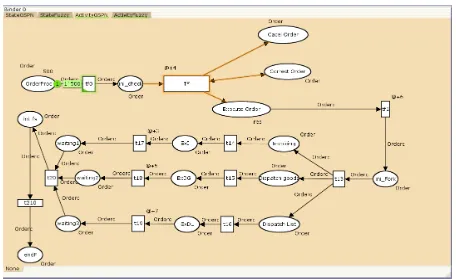
[image:3.595.322.536.89.489.2]As specified in Algorithm, firstly the GSPN of activity diagram will be created. All the component of activity diagram is considered as an immediate transition and PAstep stereotypes are considered as the timed transitions -In this step the decisions are ignored- T0 is the Transition which in it the events and decisions will be checked. First each component of activity diagram is transfer to the GSPN then all of them will be combined. Figure 3 shows the final GSPN of UML-Activity diagram which is showed in figure2.
Table 2. Equivalent of Activity Diagram in GSPN
GSPN Activity Diagram
Join
Fork
Merge
Final
In the next step fuzzy rules will extracted. The steps for extractions fuzzy rules are below:
1- First events which are the reason of creating different conditions should extracted:
Comparison between required and inventory : Balance
Low: (Inventory<Required/2)
Mid: (Inventory /2<Required< 2Required)
High: (Inventory>Required) Review of List by customers: Match
Confirm: Match >= 85%
Reject: Match < 85%
Review of changes in order by customer: Changes
Low: (Changes <10% Required)
Mid: (10%Require >Changes >40% Required)
High: (Changes > 30% Required) Output: Dispatch_Goods
Send
Correct
Cancel
Table 3. rules based on event in ordering system
Rule Event Condition State
1 Change is Low Match is Confirm
If Change is Low and Match is
Confirm
Send
2 Change is Mid Match is Confirm
If Change is Mid and
Match is Confirm Send
3 Change is Mid Match is Reject
If Change is Mid and
Match is Reject Correct
4 Change is High Match is Reject
If Change is High
and Match is Reject Cancel
3- The fuzzy Petri net will be drawn, figure 4 shows this.
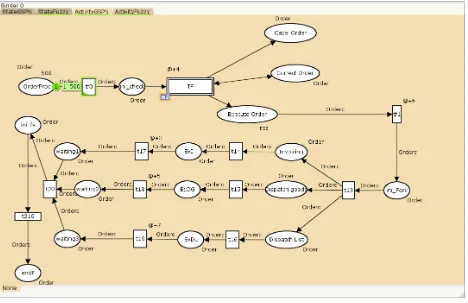
In the third step of the algorithm the generated GSPN with the generated FPN should combined . For this the T0 transition is considered as the successor transition. Figure 5 shows the final combination and the FGSPN.
7.
CONCLUSION
In this paper, firstly there was a short review on Fuzzy Petri net and Generalized Stochastic Petri net. Then a new properties in activity diagram has been introduced which make it fuzzy and can be considered in transforming activity diagram to fuzzy Petri net. Then a hybrid Petri net has been suggested which used both GSPN and FPN. The suggested algorithm can be used to evaluate performance and reliability of systems. This algorithm is consisting of the both advantages of FPN and GSPN, so it can use for evaluating performance and each non-functional requirement of systems which need time also the uncertainty in data and process of systems can consider for evaluating. These properties of the algorithm make it powerful and unique because in none of the study of making executable model for evaluating systems, times and uncertainties are not considered concurrently. Finally the efficiency and performance of the suggested algorithm was explained by an example of transforming a UML activity diagram for order processing into Fuzzy GSPN.
8.
REFERENCES
[1] Object Management Group. (2002). UML Profile for Schedulability. Performance and Time Specification. http:/www.omg.org.
[2] Behbahaninejad, A., Haroonabadi, A., Mirabedini, J., (2012), Evaluating Software Architecture using Formal Models. Management Science Letters 2 (2012) 469-476. [3] Harounabadi, A., Teshnehlab, M., (2009), Behavior
Modeling in uncertain Information System by Fuzzy UML. International Journal of Software Company. [4] Ajmone Marsan, M., Balbo, G., Conte, G., Donatelli, S.
and Franceschinis, G., Modelling with Generalized Stochastic Petri Nets. J. Wiley, 1995.
[5] L’opezGrao, J., Merseguer, J., Campos, J., (2004), From UML Activity Diagrams to Stochastic Petri Nets: Application to Software Performance Engineering. WOSP '04 Proceedings of the 4th international workshop on Software and performance, Page 25-36, ISBN:1-58113-673-0.
[6] Motameni, H., Movaghar, A., Daneshfar, I., Nematzadeh, H., Bakhshi, J., (2008), Mapping to Convert Activity Diagram to Fuzzy Petri net (FPN), World Applied Science Journal 3 (3): 514-521, 2008, ISSN 1818-4952.
[7] Afshani, J., Haroonabadi, A., Dezfouli, MA, J., (2012), A New Model For Designing Uncertain Enterprise Architecture. Management Science Letters 2 (2012). [8] AliShahi, MS., Haroonabadi, A., Mirabedini, J., (2012),
A Method for Enterprise Architecture validation with Colored Petri nets.. Management Science Letters 2 (2012) 2417-2424.
[9] Shiriyan Dehkordi, Z., Haroonabadi, A., Parsa, S., (2013), Evaluation of Software Architecture using fuzzy Colored Petri net. Management Science Letters 3 (2013) 555-562.
[10] Abroshan, V., Haroonabadi, A., Mirabedini, J., (2013), Evaluation of Software Architecture using Fuzzy Colored Petri nets. Management Science Letters 3 (2013) 665-682.
[11] Andr´e, E., Choppy, CH., Reggio, G., Activity Diagrams Patterns for Modeling Business Processes, 11th International Conference on Software Engineering Research, Management and Applications (SERA 2013. available at www.springer.com.
Figure 2. Activity Diagram for Ordering Process.
Figure 4. Fuzzy Petri net for Successor Transition in Figure 3.
[image:6.595.66.534.426.729.2]