Vineyard Management for Downy Mildew Disease using
Wireless Sensor Networks (WSN)
Sarika Datir
Pune UniversityK.J.College of Engineering and Management Research,Pune
Sanjeev Wagh
Pune UniversityK.J.College of Engineering and Management Research,Pune
ABSTRACT
Grape is a very important product in India. In India, Maharashtra, Karnataka and Tamil Nadu are the main contributors to the production of grapes. Out of the total production of grapes, 70 % is produced in Nashik district itself. However, vineyard farming in Nasik faces many threats. Downy mildew and mealy bug are the pests that create the most problems to vineyards. The proposed system’s aim is to try and provide automated remote monitoring of the vineyard and detection of disease and if required starting spraying devices remotely.
The implemented system uses sensor nodes to measure weather of the environment; the measured data collected is sent to a central server using the Internet. Users can access data remotely using internet connection. In this system a sensor network is fixed at the vineyard and end user move at any location. The end user can access central server data with the help of an android application. Disease detection is done with the help of algorithms. All available weather monitoring systems do not send data directly to the end user. It requires a data logger to read data from a monitoring node and provide it as an input to the software module for further analysis. It increases the delay in disease prediction, labor cost, and dependency. Another limitation of available systems is that the user has to compulsorily visit the vineyard to read weather data.
Keywords
Wireless, Disease, Downy Mildew, Vineyard, Sensor, Network, Agriculture, Weather etc
1.
INTRODUCTION
Grape is a very important product in India. In India, Maharashtra, Karnataka and Tamil Nadu are the main contributors to the production of grapes. Out of the total production of grapes, 70 % is produced in Nashik district itself. However, vineyard farming in Nasik faces many threats. Downy mildew and mealy bug are the pests that create the most problems to vineyards. The proposed system’s aim is to try and provide automated remote monitoring of the vineyard and detection of disease and if required starting spraying devices remotely.
The implemented system uses Sensor nodes to measure weather of the environment; the measured data collected is sent to a central server using the Internet. Users can access data remotely using internet connection. In this system a sensor network is fixed at the vineyard and end user is the mobile. The end user can access central server data with the help of an android application. Disease detection is done with the help of algorithms. All available weather monitoring systems do not send data directly to the end user. It requires a data logger to read data from a monitoring node and provide it as an input to the software module for further analysis. It
increases the delay in disease prediction, labor cost and dependency. Another limitation of available systems is that the user has to compulsorily visit the vineyard to read weather data.
2.
LITERATURE SURVEY
Feasibility study [1] on field data acquisition is done. Objective of research work was to develop a short packet format using Global System for Mobile Communications (GSM) functionality for remote long distance communication. The system shows good results for Authentication of packets and correctness of data. It is implemented for checking accuracy of developed small packet format.
Data acquisition system [2] collects real time weather data from respective farms and sends it to the central server managed in the farmer’s house. The bacteria dorsalis is a common disease in Taiwan that causes loss of many fruits and vegetables. The system implemented using the trapping tube for bacteria dorsalis and when the threshold is crossed, it gives an alert message to the farmer. It makes long distance communication possible. In this research, a farmer has to maintain the remote node as well as the host platform. The system was implemented for controlling the disease and not for prevention of disease.
The camera sensor was implemented for detection of downy mildew pest in agriculture [4]. The technology used for detection of downy mildew symptoms was based on image processing. Sensors are integrated with image grasping, image pre-treatment and final detection of disease. With the help of camera sensor visual symptoms of downy mildew pest were detected, but visual symptoms appear to crop or fruit when the crop is already infected by downy mildew pests.
IIT Bombay [6] implemented system to detect downy mildew based on weather information. They apply a semi empirical model to weather data and find the probability of disease. “Downy Mildew of Grape” by Michael A. Ellis [9], provides study about Downy mildew pest. Downy mildew is very major disease in the US and Asia and Europium region. Downy mildew pest can cause direct yield losses by rotating from florescence, leaves, cluster and shoots. Downy mildew developed and spread within very short period and can damage whole plots.
3.
MOTIVATION
demand in a Global Market, farmers require any automated system to solve this problem.
Requirement analysis and feasibility study of this system are performed with actual participation of vineyard farmers, a pathologist from grapes research center.
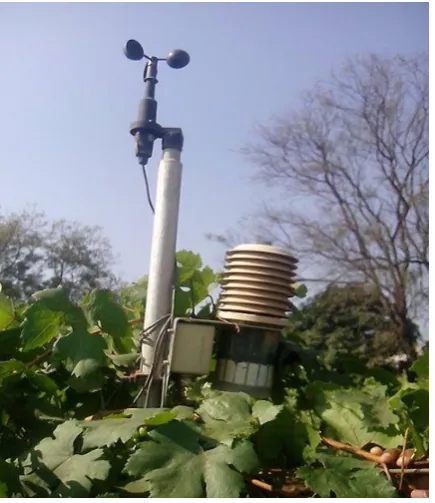
[image:2.595.315.534.70.163.2]The photograph shown in the figure 2 is an actual field photograph of the weather station at grape research center, B., Nasik.
Fig 2: Weather acquisition device in Grapes research center
4.
MATERIALS AND METHODS USED
4.1
Monitoring Node Configuration
Figure 3 shows the architecture of Remote monitoring node used in disease detection system. The hardware consists of Remote monitoring node that is physically placed in vineyard consist of many standard electronics components. The ATmega232 AVR microcontroller is used for the overall processing of the remote node. MAX232 chip is used between RS232 and micro co- ntroller. MAX232 handles the responsibility of signal conversion between RS232 and microcontroller. ULNDarglington drivers are used for connecting different devices to the remote node. Using ULNDarlington drivers we can connect four devices of 230 volts to the remote node. Sensors monitored data is sent to a central server with the help of Internet. Figure 4 shows the monitoring node implemented in disease detection system.
Fig 3: Architecture of Remote monitoring node
Fig 4: Actual Remote monitoring node
[image:2.595.55.273.172.424.2]The figure 5 shows the PCB (Printed circuit board) layout of monitoring node, PCB layout electrically connects electronic components using conductive tracks.
Fig 5: PCB layout of remote monitoring node
[image:2.595.317.531.216.377.2]The figure 6 shows pin out of ATmega microcontroller. ATmega32 is high performance Low-Power AVR 8 bit microcontroller. Port A0… A7 serves as the analog inputs to the A/D Converter. Port B, C and D is an 8-bit bi-directional I/O port with internal pull-up resistors. 32K bytes of System Program memory, 1024 bytes EEPROM, 2K byte SRAM, 32 general purpose I/O lines, 32 general purpose working registers, On-chip Debugging support and programming.
[image:2.595.326.522.495.695.2] [image:2.595.58.266.641.745.2]4.2
Algorithm
The system uses two algorithms. First for continuous prediction of downy mildew disease based on climatic data provided by research center. Another algorithm predicts future weather conditions using Newton’s Forward Difference Interpolation Formula.
4.2.1
Algorithm
1. Minimum and maximum temperature, and Minimum and maximum humidity stored on a central server is compared against data provided by the research center.
2. Based on step 1 comparison Cumulative count of weather data is calculated continuously for 4 to 8 days.
3. When the cumulative total of these values exceeds count 34 risk of disease started.
4. When the count reaches to 34 generate an alert at End user application as well as send GSM SMS to farmer registered mobile number.
4.2.2
Algorithm
Future prediction of disease is based on newton’s forward difference
Let y = f (x) be a function which takes values f (x0), f (x0+ h),
f (x0+2h),…, corresponding to various equi-spaced values of x
with spacing h, say x0, x0 + h, x0 + 2h, … . Suppose, we wish to evaluate the function f (x) for a value x0 + Ph, where p is any real Number, p= (x-x0) /h
YX=Y0 + P Δ Y0 + P(P-1)/2! Δ 2
Y0 + P(P-1)/2! Δ 2
Y0 +
P(P-1)(P-2)/3! Δ3 Y0 + P(P-1)(P-2)(P-n+1)/n! Δn Y0
1. Enter start to end date. Start and end date shouldn’t be a future date. It is considered as the value of Xa,b,c,d (I)
2. Weather data of start to end date available at central server is accessed at end user android application. It is considered as Y a, b, c, d (II)
3. For weather data there are four different parameters Ya
(Min temp), Yb (Max temp, Yc (min humidity), Yd (Max
humidity). Hence, calculate four forward different tables. 4. Apply Newton’s forward difference formula to calculate future value based on difference tables generated in step 3.
5. Severity of disease risk is calculated based on the number of days required to accumulate cumulative count 34. Suppose It requires only 4 days to accumulate value 34 then the severity of disease is more. If it requires 8 days means the severity of disease is low.
6. If the severity of disease is more farmer can start spray device from his application remotely.
5.
RESULTS AND DISCUSSION
[image:3.595.315.534.72.411.2]The implemented system has three tier architecture. Second tier is central server. To start the system, servlet stored at central server should be deployed first. This is shown in figure 7.
Fig 7: Deployment of web service
Fig 8: Successful initialization of web service
[image:3.595.328.531.487.741.2]Figure 8 shows the log created at server indicating that servlet started successfully.
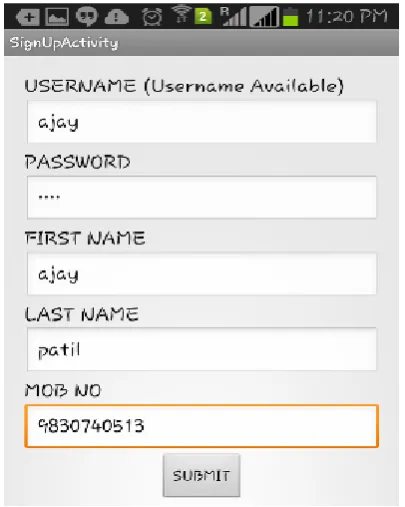
Figure 9 shows SignUp activity when new user wants to install the system at his vineyard. After the Signup remote user can login his application.
The server activity that continuously checking cumulative count threshold. If it crosses threshold alert is generated on the end user application and GSM message is sent to a former registered mobile number.
As compared to available weather monitoring system, this system measures weather data and sends it continuously to the remote central server. If disease is detected, an emergency alert is generated on the end user application. Available weather monitoring system only contains a monitoring node. Analysis module is installed individually on a standalone machine. When measured data is provided as input to analysis module, then only it can show results. It is found very time consuming, non-automated. End user application is not mobile. But in implemented system only monitoring node location is fixed and another part is mobile.
[image:4.595.317.543.70.212.2]As shown in figure 10 implemented system reduces the investment on vineyard and increases the profit. Traditionally farmer sprays pesticide on a predefined schedule without any real time field information. As we know pesticides are very costly; they increase the investment on grape farming. Pesticide sprays carries toxic chemicals into grapes and thus the grapes get rejected in residue analysis. Residue analysis is compulsory before selecting grapes to export in EU (European Union). As shown in figure 10 investments on pesticide and fungicide in the year 2012 and 2013 is around 50 to 70 thousand and the profit is 50 to 70 thousand. But considering that the farmer installed our system in 2014 and its investment increases little bit due to the cost of the system but its profit increase Upto 1.5 lacks.
Figure 10: Investment verses income ratio when the farmer installs disease monitoring system with a 30,000
investment
Sensor implemented [5] for downy mildew detection works on image processing technology.
A system implemented using image processing technology only recover the vineyard from downy mildew
disease but can’t prevent the infection. Because the system [5] detect disease when visual symptoms appear on the leaves and cluster of the vineyard. Detecting disease in that stage is too late.
As shown in figure 11 manual system detect disease on 10th day when visual symptoms appear on the vineyard. But intelligent disease detection system detects disease on 6th day
based on weather condition analysis. When the cumulative count becomes 34 disease is detected with critical or high risk. This proves that the Intelligent disease detection system predict disease in early stage and avoid further infection.
Figure 11: Comparison showing early prediction of downy mildew disease by implemented system with other system
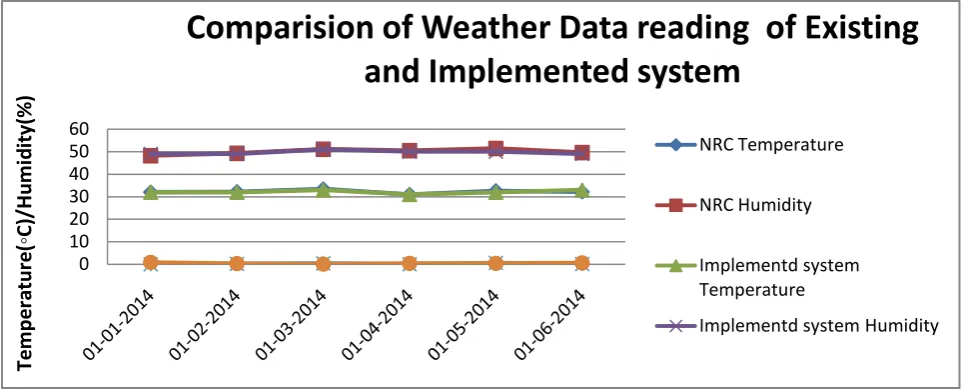
As shown in figure 12 Graph shows the temperature, humidity measured by Metos® weather station. That weather station is manufactured by Metos® instruments Pvt Ltd. We have
compared the result of our weather monitoring system with the Metos® weather station result. The error is less than ±1◦C and ±1RH which proves the accuracy the system.
0 50,000 1,00,000 1,50,000 2,00,000 2,50,000
2012 2013 2014 2015
Investment Income profit
5
10 12
18 26
34 35 36 37
38 39
42 43 44
0 5 10 15 20 25 30 35 40 45 50
Day 1
Day 2
Day 3
Day 4
Day 5
Day 6
Day 7
Day 8
Day 9
Day 10
Day 11
Day 12
Day 13
Day 14
Intelligent Disease detection system
Other System
Disease detected on 6th day
[image:4.595.65.532.432.673.2]
Figure 12: Graph showing difference of weather data reading of grapes research center and our implemented system
6.
CONCLUSION AND FUTURE SCOPE
Real time monitoring of vineyard field is very urgent need of the agriculture industry. Vineyard requires very huge investment to increase export quality and quantity. Extreme use of pesticides and fungicide increases cost of production of grapes. Because farmers apply pesticides without any real time information of crop and soil the implemented system provides real time monitoring of weather data and probability of disease. In implemented architecture one can add more disease prediction, water pump On/Off, Soil water level measurement.
This architecture can be used in medical field and water pollution management. In medical field remote monitoring of patient is required. End users are doctors, hence they get a real time reading of various parameters of patient and alert of threshold crossing.
7.
ACKNOWLEDGEMENT
The author is extremely thankful to the research Guide Dr. Sanjeev Wagh, K. J. College of Engineering and Management Research, Pune for his valuable support and guidelines.. The author is also thankful to the P.G. CO-Ordinater Prof. Mininath Nighot and Head of Computer Department Prof. Deepak mehetre for their time to time support and guidance.
A scientist from Grape and onion research center at Pimpalgaon Basawant, Nasik is providing great support for this research.
8.
REFERENCES
[1] Tseng, C.L., Jiang, J.A., Lee, R.G., Lu, F.M., Ouyang, C.S., Chen, Y.S., Chang, C.H., 2006. “Feasibility study on application Of GSM-SMS technology to field data acquisition” Comput. Electron. Agric. 53, 45-59.
[2] Jiang, J. A., C. L. Tseng, F.M. Lu, E. C. Yang, Z. S. Wu, C. P. Chen, S. H. Lin, K. C. Lin and C. S. Liao. 2008. “A GSM-based remote wireless automatic monitoring system for field information: A case study for ecological monitoring of the oriental fruit fly, Bactrocera dorsalis (Hendel).” Computers and Electronics in Agriculture 62 (2): 243-259.
[3] Jyh-Cherng SHIEH , Jiing-Yi WANG, Tzu-Shang LIN, Chi- Hung LIN, En-Cheng YANG, Yao-Jen TSAI, Hsien-Tsung TSAI, Ming-Tzu CHIOU, Fu-Ming LU, and Joe-Air JIANG “'A GSM-based Field Monitoring System for Spodoptera litura (Fabricius) “ EAEF 4(3) : 77-82, 2011.
[4] Liu, Y.C., 2002. “A review of studies and controls of the oriental fruit fly (Bactrocera dorsalis (Hendel)) and the melon y (B. cucurbitae Coquillett) in Taiwan (Diptera: Tephritidae). In: Wang, S.C., Ho, C.C., Chen, C.C., Chen, W.H. (Eds.), Proceedings of the Symposium on Insect Ecology and Fruit Fly Management, Special Issue, No. 4 .
[5] Anshuka Srivastava, ShugenMa, Kousuke Inoue. “Development of sensor for automatic detection of downy mildew disease” Proceeding of the 2004 International conference on Intelligent Mechatronics and automation Chengdu, china august, 2004.
[6] Ipsita Das, CPRG Naveen, Shailendra S. Yadav, bhishek, A. Kodilkar, N.G.Shah, S.N.Merchant, U.B.Desai, 2011.”WSN Monitoring of Weather and Crop Parameters for Possible Disease Risk Evaluation for Grape Farms - Sula Vineyards, A Case Study”.
[7] Michael A. “Downy mildew of grape”, Ellis, Department of plant pathology.
[8] Paul Biossard,Vincent Martin, Sabin Moisan,2008.” A cognitive vision approach to early pest detection in greenhouse crops”. Computer and electronics in agriculture 62(2008)81-93
[9] Tokihiro,masayuki,”Field monitoring Using Sensor – Nodes with a Web Server”. Journal of robotics and Mechatronics vol.17 No.2,2005 pp.164-172
[10] A. Matese, S.F. Di Gennaro, A.Zaldei,L. Genesio, F.P.Vaccari,2009.”A Wireless sensor network for precision viticulture:The NAV system”. Computer and electronics in agriculture 69(2009) 51-58
0 10 20 30 40 50 60
Te
mpe
ra
tu
re
(◦
C)
/Hu
mi
d
it
y(
%
)
Comparision of Weather Data reading of Existing
and Implemented system
NRC Temperature
NRC Humidity
Implementd system Temperature