http://dx.doi.org/10.4236/wja.2015.53030
How to cite this paper: Bhattacharjya, C., Patel, S.K., Panda, S. and Deb, A. (2015) Changing HIV Epidemic in North-Eastern India and Its Relationship with Development and Programmatic Indicators. World Journal of AIDS, 5, 265-274.
http://dx.doi.org/10.4236/wja.2015.53030
Changing HIV Epidemic in North-Eastern
India and Its Relationship with Development
and Programmatic Indicators
Chiranjeev Bhattacharjya
1*, Sangram Kishor Patel
2, Samiran Panda
3, Alok Kr. Deb
3 1Assam State AIDS Control Society, National AIDS Control Organization, Guwahati, India2HIV and AIDS Program, Population Council, New Delhi, India
3National Institute of Cholera and Enteric Diseases, ICMR, Kolkata, India Email: *[email protected]
Received 20 August 2015; accepted 22 September 2015; published 25 September 2015
Copyright © 2015 by authors and Scientific Research Publishing Inc.
This work is licensed under the Creative Commons Attribution International License (CC BY).
http://creativecommons.org/licenses/by/4.0/
Abstract
Background: Although there has been significant reduction in HIV prevalence and new HIV infec-tions in India, some of the low/moderate prevalence states have been showing long term increase in HIV prevalence and new HIV infections. Assam, a state in northeast India is one such low HIV prevalence state where HIV prevalence and new HIV infections have almost doubled in the last few years. This study examined the trend of HIV prevalence across districts/regions of Assam and its association with developmental and program indicators. Materials and Methods: A retrospective descriptive analysis of secondary data from the National AIDS Control Program, Census of India- 2011, and District Level Household and Facility Survey-3 was conducted. The time period covered under the secondary data analysis was 2007 to 2012. Correlation and Chi-square for trend tests were also used in this paper. Results: During 2007 and 2012, HIV positivity (%) increased rela-tively in North Assam (46.9%) followed by South Assam (11.5%) while there has been a relative decline in West Assam (−51.5%). Correlation analysis showed statistically significant association between HIV prevalence and female literacy, population using mobile phone, population using in-ternet, women (15 - 49 years) seeking treatment for any STI/RTI, proportion of brothel based FSWs, FSWs having <5 clients per week and proportion of condom utilized annually. Conclusion: Program efforts in the state should be focus on the districts with increasing HIV prevalence. Em-phasis should be given in planning strategies to address the program gaps among the high risk and vulnerable populations in the state.
Keywords
HIV, Epidemic, Program and Development Indicator, North-Eastern India
1. Introduction
Since the beginning of the HIV epidemic in 1981, significant success has been achieved in containing the epi-demic globally through sustained preventive and curative efforts. However, pockets of emerging and concen-trated HIV epidemics continue to exist in some regions. India has the third largest number of people living with HIV in the world—2.1 million (1.7 million - 2.7 million) by the end of 2013—and accounts for about 4 out of 10 people living with HIV in the Asia-Pacific region. There has been a 19% reduction in new HIV infections and a 38% reduction in AIDS-related deaths in India between 2005 and 2013 [1]. However, estimates of HIV prevalence based on surveillance and other program data show that while most high HIV prevalence states in India have maintained a significant long-term decline in HIV prevalence, some traditionally low/moderate HIV prevalence states are showing an increasing trend in HIV prevalence [2]. The HIV epidemic in northeast India-has been primarily driven by injecting drug use since its inception in the late 1980s [3] [4]. Studies conducted in the two high HIV prevalence states of northeast India-Manipur and Nagaland-show that the HIV epidemic is concentrated among injecting drug users (IDUs) and female sex workers (FSWs) [5]-[7]. However, a recent study based on HIV Sentinel Surveillance (HSS) data from Nagaland shows an increasing trend in HIV preva-lence among FSWs and men having sex with Men (MSM), while a declining trend is noted among IDUs [8], suggesting that the dynamics of the HIV epidemic in the northeastern region have changed over time.
Assam, a state located in the northeastern part of the country, is categorized as a low HIV prevalence state with an estimated adult HIV prevalence of 0.07%, which is lower than the national prevalence of 0.27%. How-ever, adult HIV prevalence in the state has increased from 0.04% in 2007 to 0.07% in 2011, and annual new HIV infections have increased from 1219 to 2408 over the corresponding period [9]. Assam is also a highly vulnerable state for HIV transmission as it is the gateway and commercial hub of northeast India, and shares a border with three high HIV prevalence states of Manipur, Mizoram and Nagaland [10]. HSS data from consis-tent sites in Assam during 2003-2011 reveal increasing HIV prevalence among antenatal clinic (ANC) attendees and FSWs, whereas IDUs showed a stable prevalence; sufficient data were not available for MSMs to ascertain a trend [11]. National Family Health Survey (NFHS) 2005-2006 data show that in Assam, just 49.6% men and 23.9% women were aware that consistent condom use, which highlights low knowledge of HIV/AIDS compared to corresponding awareness at the national level (68.1% men and 34.1% women) [12]. In view of the evolving HIV scenario in Assam, it is important to understand the geographical distribution and role of socio-cultural and programmatic factors which may have influenced the HIV scenario. This study aims to explore the geographical trend in HIV prevalence in the state, and its association with various developmental and programmatic factors. As literature on the HIV scenario in Assam is virtually non-existent, these findings will help in planning future programmatic interventions.
2. Materials and Methods
2.1. Data
A retrospective descriptive analysis of secondary data from the National AIDS Control Program(NACP) (e.g. Integrated Counseling and Testing Center (ICTC) data and Targeted Intervention project (TI) data, Census of India-2011, and District Level Household and Facility Survey-3 (2007-2008) was conducted. The period cov-ered under the secondary data analysis was 2007 to 2012.
ICTC data: This data source included HIV positivity (%), calculated from the number of HIV positive out of the number tested for HIV. ICTC data were used to study the trend in HIV prevalence during 2007 and 2012 by calculating the relative change in HIV positivity (%) between the reference years. Increase of >50% was classi-fied as Category-I, increase of <50% as category-II, and no change/decline as category-III. We included the ICTC HIV positivity (%) data 2011 for bivariate analysis considering the proximity of the time period and availability of the independent variables.
Census of India data: From the 2011 Census of India, we included the female literacy rate, and the proportion of population using mobile phones and internet as independent variables for Assam state.
villages in the district with any government health facility, including sub-center, primary health center, commu-nity health center, government hospital or dispensary; 3) women (15 - 49 years) using any method of modern contraception: Percentage of currently married women aged 15 - 49 years who are currently using any contra-ceptive method; 4) Women (15 - 49 years) seeking treatment for any sexually transmitted infection (STI)/re- productive tract infection (RTI): Percentage of ever-married women aged 15 - 49 years who sought treatment for any RTI/STI including abnormal vaginal discharge during the three months prior to the survey; 5) Women (15 - 49 years) having symptoms of STI/RTI: Percentage of ever-married women aged 15 - 49 years who reported any RTI/STI symptoms, including abnormal vaginal discharge, during the three months prior to the survey.
TI project data: We used 2011 data for female sex workers maintained by the TI projects in Assam. The in-dependent variables included from the TI data were:1) Proportion of different typologies (home-based, bro-thel-based, street-based and lodge/dhaba-based) of FSWs: percentage of each typology in the district out of the total FSW population in the district; 2) Proportion of FSWs with different client load per week: we divided the number of clients per week into three categories: a) <5 clients per week; b) 5 - 9 clients per week; and c) ≥10 clients per week. The percentage of FSWs in each category in the district out of the total population of FSW was used in the analysis; 3) Proportion of condomsutilized annually: Percentage of condoms utilized out of the total condoms supplied to the district in 2011.
2.2. Ethical Statement
The Assam State AIDS Control Society (ASACS), under the guidance of the National AIDS Control Organiza-tion (NACO), provided general oversight and approval for the collecOrganiza-tion and use of program data for examining the predictors of HIV prevalence in Assam. Verbal consent was taken from each client at the time of enrollment for HIV counseling and testing to use their medical history for research purposes. The Counselor at ICTC cen-ters records all these procedures. Strict confidentiality of all the data was maintained, and no personal identifiers were included in the analysis. The use of secondary data and analyses in this study was reviewed and approved by the ethical review and data sharing committees of NACO, Government of India.
2.3. Statistical Analysis
The percentage relative change in HIV positivity during 2007 and 2012 was analyzed for all the districts and re-gions of Assam. Further, a trend analysis was done using chi-square for trend tests, and a p-value of <0.05 was considered statistically significant. Correlation analysis was done to examine the association between HIV pre-valence and developmental and program indicators. All statistical analyses were conducted using SPSS software (version 16.0; SPSS, Chicago, IL, USA) and Epi-Info software.
3. Results
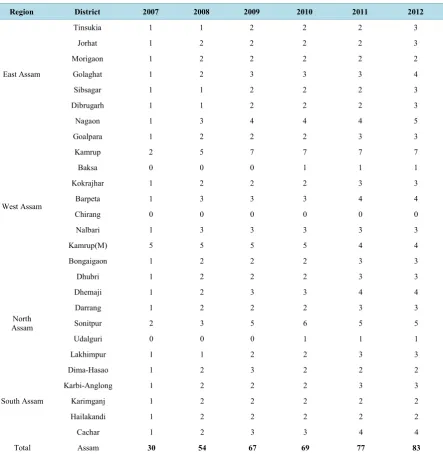
In Assam HIV testing is conducted at Integrated Counseling and Testing Centers (ICTC), which are located in medical colleges and district civil hospitals across all the districts of Assam, except Chirang district. During the study period, ICTC centers were scaled up across all the 27 districts of Assam (30 in 2007 to 83 in 2012) (Table 1).
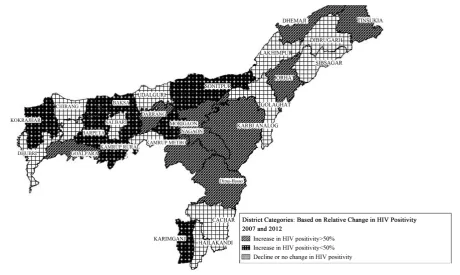
From 2007 to 2012, HIV positivity (%) increased relatively in North Assam (46.9%), followed by South As-sam (11.48%) and East AsAs-sam (2.3%) while there has been a relative decline in West AsAs-sam (−51.5%). Overall, Dima-Hasao (962.5%), Karbi-Anglong (445.0%), Darrang (226.3%), Dhemaji (200.0%) and Nagaon (107.8%) districts have shown significantly higher relative increase in HIV positivity (%) from 2007 to 2012 in Assam (Table 2andFigure 1).
In-depth analysis shows an increasing trend in HIV prevalence in East Assam (p-value: 0.000) and a declining trend in HIV prevalence in West Assam (p-value: 0.000). An increasing trend in HIV prevalence was also seen North and South Assam but this was not statistically significant. Correlation analysis of HIV positivity and se-lected variables shows that districts with higher HIV positivity (%) have higher female literacy (p-value: 0.001) and higher internet usage (p-value: 0.006). Positive correlation of HIV positivity is also seen with percent of population using mobile phones and the availability of any government health facility in the district; however, this was not found to be statistically significant (Table 3).
Figure 1.District map of Assam showing percentage relative change in HIV positivity during 2007-2012.
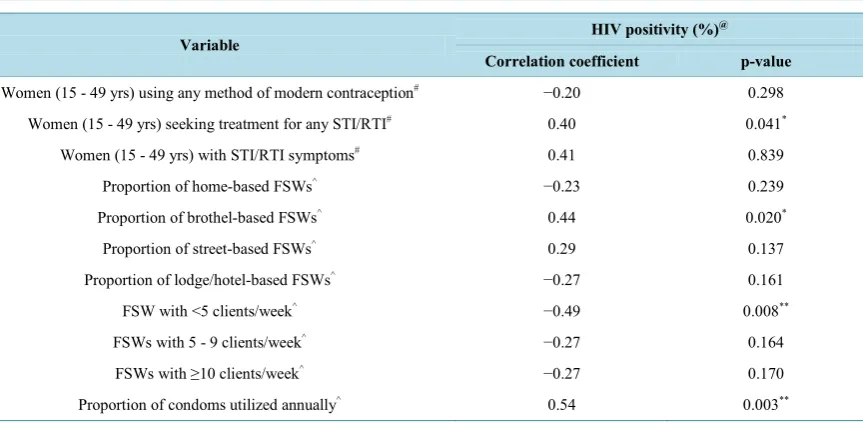
higher HIV positivity (%) in 2011 had a higher proportion of women aged 15 - 44 years seeking treatment for any STI/RTI (p-value: 0.041), a higher proportion of brothel-based FSWs (p-value: 0.020), a lower proportion of FSWs with <5 clients/week (p-value: 0.000) and a higher proportion of annual condom utilization (p-value: 0.000). Additionally, districts with higher HIV positivity (%) in 2011 had a lower proportion of home-based (correlation coefficient: −0.23) and lodge/dhaba-based (correlation coefficient: −0.27) FSWs; however, this is not statistically significant. Further, a negative correlation (correlation coefficient: −0.20) was observed between HIV positivity (%) and the use of any modern method of contraception; however this was not statistically sig-nificant (Table 4).
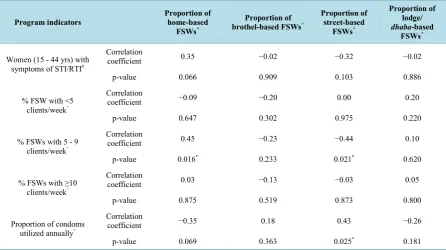
Further correlation analysis between the typology of sex work and program indicators shows that among home-based FSWs, a higher proportion have 5 - 9 clients/week (p-value: 0.016). Moreover, districts with a higher proportion of street-based FSWs had a higher proportion of annual condom utilization (p-value: 0.025). A positive correlation with annual condom utilization is also seen among brothel-based FSWs while a negative correlation is noted among home and lodge/dhaba-based FSWs. However, these associations were not statisti-cally significant. A positive correlation is also noted between home-based FSWs and women aged 15 - 44 years with symptoms of STI/RTI, but this association is not statistically significant (Table 5).
4. Discussion
This study shows that during 2007-2012, HIV prevalence increased significantly in Dima-Hasao (962.5%) and Karbi-Anglong (445.0%) districts in south Assam, followed by Darrang (226.3%) and Dhemaji (200.0%) dis-tricts in north Assam and Nagaon (107.8%) district in east Assam. A relative decline in HIV prevalence in west Assam is observed, although HIV prevalence has increased in some districts of the region. Recent rounds of HSS in the state also show higher HIV prevalence among ANC attendees in Dima-Hasao and Karbi-Anglong districts, while higher HIV prevalence was noted among FSWs in Darrang district [13]. A client audit study conducted in Assam during 2012 shows that around 15% of all HIV-positive cases were from Nagaon district
Table 1.Year-wise number of ICTCs by district, Assam, 2007-2012.
Region District 2007 2008 2009 2010 2011 2012
East Assam
Tinsukia 1 1 2 2 2 3
Jorhat 1 2 2 2 2 3
Morigaon 1 2 2 2 2 2
Golaghat 1 2 3 3 3 4
Sibsagar 1 1 2 2 2 3
Dibrugarh 1 1 2 2 2 3
Nagaon 1 3 4 4 4 5
West Assam
Goalpara 1 2 2 2 3 3
Kamrup 2 5 7 7 7 7
Baksa 0 0 0 1 1 1
Kokrajhar 1 2 2 2 3 3
Barpeta 1 3 3 3 4 4
Chirang 0 0 0 0 0 0
Nalbari 1 3 3 3 3 3
Kamrup(M) 5 5 5 5 4 4
Bongaigaon 1 2 2 2 3 3
Dhubri 1 2 2 2 3 3
North Assam
Dhemaji 1 2 3 3 4 4
Darrang 1 2 2 2 3 3
Sonitpur 2 3 5 6 5 5
Udalguri 0 0 0 1 1 1
Lakhimpur 1 1 2 2 3 3
South Assam
Dima-Hasao 1 2 3 2 2 2
Karbi-Anglong 1 2 2 2 3 3
Karimganj 1 2 2 2 2 2
Hailakandi 1 2 2 2 2 2
Cachar 1 2 3 3 4 4
Total Assam 30 54 67 69 77 83
Table 2.Percentage relative change in HIV positivity by district and region, Assam, 2007 and 2012.
Region District positivity HIV
(%) in 2007
HIV positivity (%) in 2012
% relative change in
HIV positivity at district level
Category of district*
% relative change in HIV positivity at
regional level
East
Tinsukia 0.0 0.86 86.0 1
2.30
Jorhat 0.5 0.94 88.0 1
Morigaon 0.09 0.12 33.3 2
Golaghat 0.91 0.58 −36.3 3
Sibsagar 0.31 0.28 −9.7 3
Dibrugarh 1.78 1.1 −38.2 3
Nagaon 0.77 1.6 107.8 1
West
Goalpara 0.19 0.33 73.7 1
−51.5
Kamrup 0.0 0.11 11.0 2
Baksa 0.0 0.08 8.0 2
Kokrajhar 0.38 0.41 7.9 2
Barpeta 0.26 0.27 3.8 2
Chirang 0.0 0.0 0.0 3
Nalbari 0.38 0.02 −94.7 3
Kamrup(M) 4.68 2.67 −42.9 3
Bongaigaon 1.07 0.52 −51.4 3
Dhubri 0.44 0.37 −15.9 3
North
Dhemaji 0.09 0.27 200.0 1
46.88
Darrang 0.19 0.62 226.3 1
Sonitpur 0.65 0.73 12.3 2
Udalguri 0.0 0.0 0.0 3
Lakhimpur 0.42 0.07 −83.3 3
South
Dima-Hasao 0.08 0.85 962.5 1
11.48
Karbi-Anglong 0.2 1.09 445.0 1
Karimganj 1.12 1.25 11.6 2
Hailakandi 0.14 0.06 −57.1 3
Cachar 8.06 3.46 −57.1 3
Note: *Category 1: Increase in HIV positivity >50%, Category 2: Increase in HIV positivity <50%, Category 3: Decline or no change in HIV
positivi-ty; Relative change is the increase in percentage positive (PP) between 2007 and 2012 and calculated as (PP2012 − PP2007)/(PP2007) × 100; Data
source: ICTC data.
Table 3.Correlation between HIV positivity (%) and selected variables, Assam.
Selected variables HIV positivity (%)
@
Correlation coefficient p-value
Female literacy# 0.58 0.001**
Percent of population using mobile phones# 0.31 0.109
Percent of population using internet# 0.51 0.006**
Women (15 - 49 yrs) aware that consistent condom
use prevents HIV^ −0.05 0.781
Any govt. health facility in the district^ 0.21 0.289
Note: **Correlation is significant at 0.01 level. Source: @ICTC data (2011); #Census of India-2011; ^DLHS-3 (2007-2008).
Table 4.Correlation between HIV positivity (%) and selected program indicators, Assam.
Variable HIV positivity (%)
@
Correlation coefficient p-value
Women (15 - 49 yrs) using any method of modern contraception# −0.20 0.298 Women (15 - 49 yrs) seeking treatment for any STI/RTI# 0.40 0.041*
Women (15 - 49 yrs) with STI/RTI symptoms# 0.41 0.839
Proportion of home-based FSWs^ −0.23 0.239
Proportion of brothel-based FSWs^ 0.44 0.020*
Proportion of street-based FSWs^ 0.29 0.137
Proportion of lodge/hotel-based FSWs^ −0.27 0.161
FSW with <5 clients/week^ −0.49 0.008**
FSWs with 5 - 9 clients/week^ −0.27 0.164
FSWs with ≥10 clients/week^ −0.27 0.170
Proportion of condoms utilized annually^ 0.54 0.003**
Note: *Correlation is significant at 0.05 level, **Correlation is significant at 0.01 level. Source: @ICTC data (2011); ^TI data (2011); #DLHS-3 (2007-2008).
As our study could not identify the definite causes of high HIV prevalence in spite of higher condom utiliza-tion, this issue should be explored in depth in future. However, preventive strategies should emphasis compre-hensive understanding of safer sex and the protective role of condoms in all kinds of sexual behavior. Further, our analysis of program indicators by the different typologies of sex work shows a significant positive associa-tion between the proporassocia-tion of street-based FSWs and annual condom utilizaassocia-tion. This finding further substan-tiates the association between HIV prevalence and higher condom utilization, as it is seen that condom utiliza-tion has been higher among street-based FSWs in Assam and previous studies confirm that street-based FSWs are at higher risk of HIV transmission [30] [31]. We also found that annual condom utilization was lower among home-based and lodge/dhaba-based FSWs but the association was not statistically significant. Our study has certain limitations. First, while our study explores the association between HIV prevalence and different deve-lopmental and program indicators, it could not explain the underlying causes for these associations. Second, our analysis is limited to the variables that are available in the recorded data; further research could examine the range of factors associated with the evolving HIV scenario in Assam. This will require compilation of individual client-level program data from multiple sources, including health facilities and TI interventions, and will help in developing more concrete evidence-based programs.
5. Conclusion
[image:7.595.105.537.253.465.2]Table 5. Correlation between typology of female sex worker and program indicators, Assam.
Program indicators Proportion of home-based
FSWs^
Proportion of brothel-based FSWs^
Proportion of street-based
FSWs^
Proportion of lodge/
dhaba-based
FSWs^
Women (15 - 44 yrs) with symptoms of STI/RTI#
Correlation
coefficient 0.35 −0.02 −0.32 −0.02
p-value 0.066 0.909 0.103 0.886
% FSW with <5 clients/week^
Correlation
coefficient −0.09 −0.20 0.00 0.20
p-value 0.647 0.302 0.975 0.220
% FSWs with 5 - 9 clients/week^
Correlation
coefficient 0.45 −0.23 −0.44 0.10
p-value 0.016* 0.233 0.021* 0.620
% FSWs with ≥10
clients/week^
Correlation
coefficient 0.03 −0.13 −0.03 0.05
p-value 0.875 0.519 0.873 0.800
Proportion of condoms utilized annually^
Correlation
coefficient −0.35 0.18 0.43 −0.26
p-value 0.069 0.363 0.025* 0.181
Note: *Correlation is significant at 0.05 level; Source: ^TI data (2011); #DLHS-3 (2007-2008).
2012, and these geographical areas will require increased programmatic focus like increasing HIV testing among the high risk groups and general population, regular screening of high risk groups and bridge population for dif-ferent STI/RTIs, etc. Further, it will be essential to develop district specific strategies for these key districts as the vulnerabilities may vary from district to district. The study also highlights that higher HIV prevalence is as-sociated with improved developmental indicators, suggesting the important role played by increased awareness, accessibility to health services and communication media in the scale up of HIV services. The program may consider the use of media like SMS and social media, to increase awareness and promote treatment adherence with specific priority to the districts with rising HIV prevalence. This study also illustrates that HIV prevalence is high in spite of high annual condom utilization, highlighting the need to strengthen preventive strategies to ensure consistent condom use among high-risk groups. Further, the program will also have to devise strategies for increasing condom use among home-based and lodge/dhaba-based FSWs. This study recommends for fur-ther research and advocacy based evidence to ensure that these issues are properly addressed. The finding of this study may be also applicable to other states in Northeastern India like Meghalaya and Tripura which have shown similar rise in HIV prevalence and incidence in recent years. However, further research is needed as vulnerabili-ties may vary from state to state.
Acknowledgements
References
[1] Joint United Nations Programme on HIV/AIDS (2014) GAP Report. Geneva.
[2] Pandey, A., Sahu, D., Bakkali, T., et al. (2012) Estimate of HIV Prevalence and Number of People Living with HIV in India 2008-2009. BMJ Open,2, e000926.http://dx.doi.org/10.1136/bmjopen-2012-000926
[3] ISHA (2014) HIV-AIDS Situation in North Eastern States. Indian Society for Health Administrators.
www.medind.nic.in/haa/t04/i1/haat04i1p147.pdf
[4] Sarkar, S., Das, N., Panda, S., et al. (1993) Rapid Spread of HIV among Injecting Drug Users in North-Eastern States of India. Bulletin on Narcotics, 45,91-105.
[5] Lucas, G.M., Solomon, S.S., Srikrishnan, A.K., et al. (2015) High HIV Burden among People Who Inject Drugs in 15 Indian Cities. AIDS,29,619-28. http://dx.doi.org/10.1097/qad.0000000000000592
[6] Medhi, G.K., et al. (2012) Factors Associated with History of Drug Use among Female Sex Workers (FSW) in a High HIV Prevalence State of India. BMC Public Health,12,273. http://www.biomedcentral.com/1471-2458/12/273 http://dx.doi.org/10.1186/1471-2458-12-273
[7] Medhi, G.K., Mahanta, J., Hazarika, I., et al. (2013) Syphilis Infection among Female Sex Workers in Nagaland, Northeast India: Analysing Their Vulnerability to the Infection. International Journal of STD & AIDS, 24, 193.
http://dx.doi.org/10.1177/0956462412472427
[8] Saha, M.K., Mahapatra, T., Biswas, S., et al. (2015) Burden and Correlates of HIV Risk among Men Who Have Sex with Men in Nagaland, India: Analysis of Sentinel Surveillance Data. PLoS ONE, 10, e0117385.
http://dx.doi.org/10.1371/journal.pone.0117385
[9] National AIDS Control Organization (2012) Technical Report on India HIV Estimates. New Delhi. [10] Assam State AIDS Control Society (2015) HIV Scenario in Assam. Guwahati.
[11] Assam State AIDS Control Society (2012) State Surveillance Report 2010-11. Guwahati.
[12] National Family Health Survey, India (2005) Assam Factsheet. http://www.rchiips.org/nfhs/factsheet.shtml
[13] Assam State AIDS Control Society (2014) State Surveillance Report 2012-13. Guwahati. [14] Assam State AIDS Control Society (2013) Clinical Audit of Client Data. Guwahati.
[15] Park, J.N., Papworth, E., Billong, S.C., et al. (2014) Correlates of Prior HIV Testing among Men Who Have Sex with Men in Cameroon: A Cross-Sectional Analysis. BMC Public Health, 14, 1220.
http://dx.doi.org/10.1186/1471-2458-14-1220
[16] Easton, P., Entwistle, V.A. and Williams, B. (2010) Health in the “Hidden Population” of People with Low Literacy. A Systematic Review of the Literature. BMC Public Health, 10, 459.
[17] Assam State AIDS Control Society (2015) HIV/AIDS Factsheet of Assam. Guwahati.
[18] Scanlon, M.L. and Vreeman, R.C. (2013) Current Strategies for Improving Access and Adherence to Antiretroviral Therapies in Resource Limited Settings. HIV/AIDS-Research and Palliative Car, 5, 1-17.
[19] Gold, J., Lim, M.S.C., Hellard, M.E., et al. (2010) What’s in a Message? Delivering Sexual Health Promotions to Young People in Australia via Text Messaging. BMC Public Health, 10, 792.
http://dx.doi.org/10.1186/1471-2458-10-792
[20] Wasserheit, J.N. (1992) Epidemiological Synergy. Interrelationships between Human Immunodeficiency Virus Infec-tion and Other Sexually Transmitted Diseases. Sexually Transmitted Diseases, 19, 61-77.
http://dx.doi.org/10.1097/00007435-199219020-00001
[21] Clottey, C. and Dallabetta, G. (1993) Sexually Transmitted Diseases and Human Immunodeficiency Virus. Epidemi-ologic Synergy? Infectious Disease Clinics of North America, 7, 753-770.
[22] Buzdugan, R., Copas, A., Moses, S., et al. (2010) Devising a Female Sex Work Typology Using Data from Karnataka, India. International Journal of Epidemiology, 39, 439-448. http://dx.doi.org/10.1093/ije/dyp351
[23] Dandona, R., Dandona, L., Gutierrez, J.P., et al. (2005) High Risk of HIV in Non-Brothel Based Female Sex Workers in India. BMC Public Health, 5, 87. http://dx.doi.org/10.1186/1471-2458-5-87
[24] Madhivanan, P., Hernandez, A., Gogate, A., et al. (2005) Alcohol Use by Men Is a Risk Factor for the Acquisition of Sexually Transmitted Infections and Human Immunodeficiency Virus from Female Sex Workers in Mumbai, India. Sexually Transmitted Diseases, 32, 685-690. http://dx.doi.org/10.1097/01.olq.0000175405.36124.3b
[25] Rodr´ıguez, D.C., Krishnan, A.K., Kumarasamy, N., et al. (2010) Two Sides of the Same Story: Alcohol Use and HIV Risk Taking in South India. AIDS and Behavior, 14, 136-146. http://dx.doi.org/10.1007/s10461-010-9722-z
http://dx.doi.org/10.1007/s10461-010-9723-y
[27] Hemlata, R., Harikumar, R., Venkaiah, K., et al. (2011) Prevalence of & Knowledge, Attitude & Practices towards HIV & Sexually Transmitted Infections (STIs) among Female Sex Workers (FSWs) in Andhra Pradesh. Indian Journal of Medical Research, 134, 470-475.
[28] Bradley, J., Rajaram, S., Moses, S., et al. (2013) Female Sex Worker Client Behaviors Lead to Condom Breakage: A Prospective Telephone-Based Survey in Bangalore, South India. AIDS and Behavior, 17, 559-567.
http://dx.doi.org/10.1007/s10461-012-0192-3
[29] Gao, W., Li, Z.Q., Li, Y. and Qiao, X.W. (2015) Sexual Practices and the Prevalence of HIV and Syphilis among Men Who Have Sex with Men in Lanzhou, China. Japanese Journal of Infectious Diseases. (Advance Publication)
http://dx.doi.org/10.7883/yoken.JJID.2013.477
[30] Jain, A.K. and Saggurti, N. (2012) The Extent and Nature of Fluidity in Typologies of Female Sex Work in Southern India: Implications from HIV Prevention Programs. Journal of HIV/AIDS & Social Sciences, 11, 169-191.
http://dx.doi.org/10.1080/15381501.2012.678136
[31] Ramesh, B.M., Beattie, T.S.H., Shajy, I., et al. (2010) Changes in Risk Behaviors and Prevalence of Sexually Trans-mitted Infections Following HIV Preventive Interventions among Female Sex Workers in Five Districts in Karnataka State, South India. Sexually Transmitted Infections, 86, i17-i24. http://dx.doi.org/10.1136/sti.2009.038513
List of Abbreviations Used in the Paper
FSW Female Sex Worker
MSM Men having Sex with Men
IDU Injecting Drug User
ANC Antenatal Clinic Attendee
NACP National AIDS Control Program
ICTC Integrated Counseling and Testing Center
TI Targeted Intervention
DLHS District Level Household and Facility Survey STI/RTI Sexually Transmitted Infection/Reproductive Tract Infection
NACO National AIDS Control Organization