Munich Personal RePEc Archive
Governance of Innovation in the
Different Countries of the World
Manuel, Eduardo
9 October 2006
Online at
https://mpra.ub.uni-muenchen.de/2275/
EDUARDO G. MANUEL1
ABSTRACT
This paper has as objective to approach the“Governance of Innovation in the different countries of the World”,using information from World Economic Forum.
The improve of cooperation between richest and poorest countries and between the poorest countries (between South Africa and Zambia, for example) is necessary to extract lessons and so to solve problems at level of what is necessary, what is missing and what is falling at the progress of nations more poor in knowledge that is cause of low level of innovation and economic development.
Keywords:Governance, Innovation, Governance of Innovation
JEL Classifications: M29, O31, O38, O39
Working Paper Series
1
GOVERNANCE OF INNOVATION IN THE DIFFERENT COUNTRIES OF THE WORLD
2
1. INTRODUCTION
1.1. What is innovation?
According to Fagerberg, Mowery, et al (2005), an important distinction is
normally made between invention and innovation. According to these authors,
Invention is the first occurrence of an idea for a new product or process, while
innovation is the first attempt to carry it out into practice. Sometimes, invention and
innovation are closely linked, to the extent that is hard to distinguish one from another
(biotechnology for instance). While inventions may be carried out anywhere, for
example in universities, innovations occur mostly in firms, though they may also occur
in other types of organizations, such as public hospitals, and to be able to turn an
invention into an innovation, a firm normally needs to combine several different types
of knowledge, capabilities, skills and resources.
Innovation is a powerful explanatory factor behind differences in performance
between firms, regions, and countries. So, firms that succeed in innovation prosper at
the expense of their less able competitors, and innovative countries and regions have
higher productivity and income than less innovative ones.
This paper has as objective to approach the “Governance of Innovation in the
different countries of the World, using information from World Economic Forum.
2. GOVERNANCE OF INNOVATION. DEFINITION
Governanceconsist on form how are organised activities of governs the politics
agents, administrative, and social (OCDE, 2001).
Governance means the act of governing, the planning, influencing, and conducting of
the policy and affair of an organization or country.
Governance of Innovation means to supplier what is missing, to manage what
exist, and what is necessary as well as to improve what is falling on the technological
2.1. What is happening to G-8 Countries?
According to World Economic Forum (2006), Japan is the member state of G-8
that is governing better the innovation, because it appears with the best classification at
level of innovation, it is in 1st position on World ranking, having the best ranking
compared with 125 countries showed in this study for 2006-2007 (see annex – table 1).
Following Japan it is USA in 2nd and Germany that is in 5th. Russian Federation
(59th) and Italy (43rd) are the countries of G-8 with poorest position on innovation
ranking.
2.2. What is happening in the World?
According to World Economic Forum (2006), Japan is the country that registed
the best position on world ranking at level of innovation, it is in 1st position, being the
country of the world that is governing better the innovation (see annex – table 1).
In the 2nd position appear the United States, and in 3rd we have Switzerland. In
the last position, we have Timor-Leste (124th), Paraguay (123rd) and Chad (122nd).
The poorest positions at this level are the African countries such as Angola
(121st), Burundi (119th), Chad (122nd), Ethiopia (114th), Lesotho (117th), and others like
Timor-Leste (as we had already seemed).
According to graphic 1, we can see that the best position on world ranking at
level of innovation are the countries with high level of education and training, for
example, if we see the table 1 (see annex), its easy to understand that United States is in 2nd position at level of innovation and it is in 5th position at level of higher education
and training, the same it happens to Finland that it is in 4that level of innovation and has
the best position in higher education and training (1st position). Whereas countries like
Zambia that is in 117th at level of higher education and training and it is in 118th in
innovation, the same it happens to Mauritania, that is in 121st at level of higher
GOVERNANCE OF INNOVATION IN THE DIFFERENT COUNTRIES OF THE WORLD
4
GRAPHIC 1 –Higher Education and Training vs. Innovation
AngolaBurundi
Burkina FasoBotswanaChinaMauritiusPhillipinesBrazil
South AfricaIndia
Malta Malaysia
SloveniaEstoniaNew Zealand
Austria Germany Canada Ireland Japan FranceUnited
KingdomSingaporeNetherlands
SwitzerlandUnited States
Belgium Sweden
DenmarkFinland
R2= 0,7998
0 1 2 3 4 5 6 7
0 2 4 6 8
Higher education and Training Score
In n o v a ti o n S c o re
India had registed better position than China, having India registed the 26th
position and China the 46th. And it is important to refer that India has more higher
education and training level than China, and if we see the table 1 (see annex), we can
verify that China is in 77thposition and India is in 49that this level.
3. CONCLUSIONS
We saw the state of innovation of the different countries of the World and to
understand so which countries are governing and managing better/poor the innovation
in era globalization.
We concluded that the richest countries are continuing to register the best
position according to information edited by World Economic Forum (2006), and the gap
between North and South is visible at level of governance and management of
innovation.
The improve of cooperation between richest and poorest countries and between
the poorest countries (between South Africa and Zambia, for example) is necessary to
extract lessons and so to solve problems at level of what is necessary, what is missing
and what is falling at the progress of nations more poor in knowledge that is cause of
BIBLIOGRAPHICAL REFERENCES
FAGERBERG, Jan, MOWERY, David C, et al (2005), The Oxford Handbook of
Innovation,First Published, Oxford University Press, Oxford and New York
OCDE (2001), A Governância no Século XXI, Gabinete de Estudos e Prospectiva
Económica (GEPE) do Ministério da Economia, Lisboa
WORLD ECONOMIC FORUM (2006), The Global Competitiveness Report
2006-2007, Edited by Michael E. Porter, Klaus Schwab, Xavier Sala-i-Martin and
GOVERNANCE OF INNOVATION IN THE DIFFERENT COUNTRIES OF THE WORLD
6
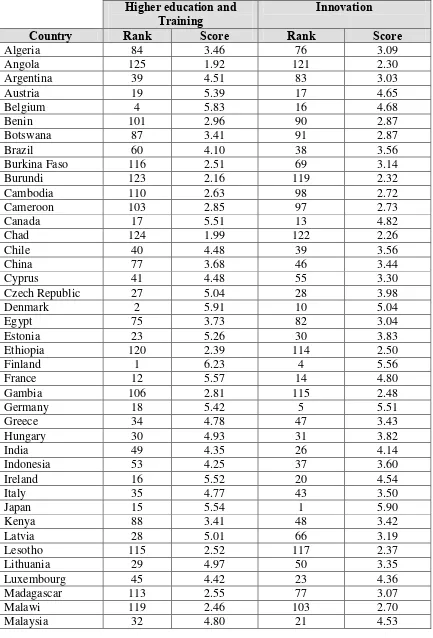
TABLE 1 –Higher education and Training and Innovation in the different Countries of the World
Higher education and Training
Innovation
Country Rank Score Rank Score
Algeria 84 3.46 76 3.09
Angola 125 1.92 121 2.30
Argentina 39 4.51 83 3.03
Austria 19 5.39 17 4.65
Belgium 4 5.83 16 4.68
Benin 101 2.96 90 2.87
Botswana 87 3.41 91 2.87
Brazil 60 4.10 38 3.56
Burkina Faso 116 2.51 69 3.14
Burundi 123 2.16 119 2.32
Cambodia 110 2.63 98 2.72
Cameroon 103 2.85 97 2.73
Canada 17 5.51 13 4.82
Chad 124 1.99 122 2.26
Chile 40 4.48 39 3.56
China 77 3.68 46 3.44
Cyprus 41 4.48 55 3.30
Czech Republic 27 5.04 28 3.98
Denmark 2 5.91 10 5.04
Egypt 75 3.73 82 3.04
Estonia 23 5.26 30 3.83
Ethiopia 120 2.39 114 2.50
Finland 1 6.23 4 5.56
France 12 5.57 14 4.80
Gambia 106 2.81 115 2.48
Germany 18 5.42 5 5.51
Greece 34 4.78 47 3.43
Hungary 30 4.93 31 3.82
India 49 4.35 26 4.14
Indonesia 53 4.25 37 3.60
Ireland 16 5.52 20 4.54
Italy 35 4.77 43 3.50
Japan 15 5.54 1 5.90
Kenya 88 3.41 48 3.42
Latvia 28 5.01 66 3.19
Lesotho 115 2.52 117 2.37
Lithuania 29 4.97 50 3.35
Luxembourg 45 4.42 23 4.36
GOVERNANCE OF INNOVATION IN THE DIFFERENT COUNTRIES OF THE WORLD
8
Mali 118 2.48 80 3.04
Malta 47 4.36 62 3.26
Mauritania 121 2.33 108 2.60
Mauritius 68 3.98 65 3.23
Mexico 71 3.88 58 3.29
Mozambique 122 2.30 110 2.58
Namibia 105 2.82 88 2.91
Netherlands 8 5.67 11 4.90
New Zealand 22 5.33 25 4.23
Nigeria 100 3.04 52 3.33
Paraguay 102 2.93 123 2.20
Philipines 63 4.02 79 3.05
Poland 33 4.79 44 3.47
Portugal 37 4.63 32 3.81
Russian Federation 43 4.44 59 3.28
Singapore 10 5.59 9 5.04
Slovak Republic 38 4.52 42 3.51
Slovenia 26 5.07 34 3.71
South Africa 56 4.17 29 3.92
Spain 31 4.86 35 3.68
Sweden 3 5.85 6 5.44
Switzerland 6 5.77 3 5.72
Thailand 42 4.44 33 3.74
Timor-Leste 111 2.62 124 2.14
Tunisia 36 4.72 27 4.05
Uganda 107 2.78 72 3.11
United Kingdom 11 5.57 12 4.89
United States 5 5.82 2 5.72
Uruguay 55 4.19 74 3.10
Vietnam 90 3.39 75 3.10
Zambia 117 2.48 118 2.35
Zimbabwe 96 3.10 93 2.86