Ground Water Quality Assessment using Data Mining
Techniques
Kamakshaiah.Kolli
Research Scholar SVU College of Engineering SV University, Tirupati-India
R. Seshadri,
Ph.D Director,
SVU Computer Center SV University, Tirupati-IndiaABSTRACT
Water is a key resource in all economic activities ranging from agriculture to industry. Only a tiny fraction of the planet’s abundant water is available to us as fresh water. Assessment of water quality has always been paramount in the field of environmental quality management. It is the foundation for health, hygiene, progress and prosperity.With ever increasing pressure of human population, there is severe stress on water resources.Therefore efficient water management is essential to civil society for betterment of quality of life. The present study emphasizes on the groundwater quality, sources of ground water contamination, variation of groundwater quality and its spatial distribution. The basis for groundwater quality assessment are groundwater bodies and representative monitoring network enabling determination of chemical status of groundwater body.For this study, water samples were collected from 40 of the bore wells and open wells representing the entire corporation area of Guntur. The water samples were analyzed for physico-chemical parameters like TDS, TH, Cl and NO3, using standard techniques in the laboratory and compared with the standards. The results obtained in this study and the Association rules will be helpful for monitoring and managing ground water pollution in the study area in terms of water quality.
Keywords
Water quality, Data mining, Association rules, Water Contamination, Quality Management.
1.
INTRODUCTION
Groundwater is a valuable natural resource that is essential for human health, socio-economic development, and functioning of ecosystems. Groundwater is the major source of drinking water in rural India. However, uncontrolled extraction without commensurate recharge and leaching of pollutants from pesticides and fertilizers into the aquifers has resulted in pollution of groundwater supplies. In addition to leachates from agriculture, ground water is threatened with pollution from various sources viz., domestic wastes, industrial wastes, agricultural wastes, run off from urban areas and soluble effluents. The quality of water is a vital concern for mankind since it is directly linked with human welfare. In India, most of the population is dependent on groundwater as the only source of drinking water supply. The groundwater is believed to be comparatively much clean and free from pollution than surface water. Groundwater can become contaminated naturally or because of numerous types of human activities; residential, municipal, commercial, industrial, and agricultural
activities can all affect groundwater quality. Contamination of groundwater can result in poor drinking water quality, loss of water supply, high clean-up costs, high costs for alternative water supplies, and/or potential health problems. A wide variety of materials have been identified as contaminants found in groundwater. These include synthetic organic chemicals, hydrocarbons, inorganic cations, inorganic anions, pathogens, and radionuclides.
1.1
The Quality Standards
Water that is clear and colorless gives an impression that it is safe for human consumption. This may not be always true as many of the bacteria and objectionable matter may be present in visible form. These may be added to water either naturally or due to certain activities and therefore it is important to understand their environmental significance. Water quality attributes are classified as physical, chemical and biological nature. The quality of water is judged by authentic standards. There are standards of drinking water quality but needing review under following reasons. World Health Organization (WHO) has recommended guideline values for drinking water for developing countries, which are taken as base for formulating the local values. The department of rural water supply of GOI (Rajeev Gandhi National Drinking Water Mission) has recommended water quality standards in its publication “Operational Guidelines for Rural Water Quality Surveillance” (AIWH-Kolkata). Similarly the Ministry of Urban development (CPHEEO) has published water quality standards in its manual of water supply. The Ministry of health (ICMR) has also published water quality standards. The Bureau of Indian Standards (BIS) has published drinking water standards under IS: 10500 (1991). There appears to be No. uniformity in these standards. They differ for some of the parameters like TDS, Fluoride and Nitrate. How can there be different standards for different departments? Can we request the authorities to review and update the quality standards wherever necessary and implement uniform standards? The need of the hour is to establish regular surveillance and monitoring of the water quality supplied to the community. This is required both for rural as well as urban areas
1.2
Ground Water Quality
groundwater and the related landscape elements that control the distribution of particular resource, if represented in the form of proper maps, are amenable to better insight so that development and management strategies could be derived. Since groundwater is available on the landscape and the community uses it for their sustenance, each habitation has particular history related to the quality attached with it. The conventional method of preparation of maps, keeping the records of chemical analysis and trying to relate to the analytical procedures like multi-layer integration, tabular / attribute data linkage needed for planning becomes laborious and time consuming. At the same time, the multi-dimensions of information if linked properly and provided with a synoptic view, creates a knowledge base that is essential for development oriented planning. The village wise database has been generated and analytical data have been grouped into two class’s viz., permissible limit and above permissible limit categories. The highest number of samples falling in any one category have been considered for average calculations and tabulated in XLS format. For generating the concentration (water quality contour maps) maps, surfer, Arc/Info and Arc/View software’s were used.
Salient features of the present study are:
Village wise, source wise groundwater quality characterized and compared with standard Norms and data organized around Arc/ Info and presented using Arc/View
Talukwise, district wise water quality variation maps prepared
Water quality hot spots developed for the Taluks and individual quality analysis linked to the database.
Village wise census data linked at appropriate level
2.
DATA MINING
Every organization collects its required data to solve some specific problems. Indeed, these data are collected for specific purposes. When the existing data are hoarded (so called data warehouse), some extra information can be extracted from this huge amount of data. This process is known as data mining. In this section, fundamental aspects of data mining, its requirements, processes and analysis approaches are elaborated.
2.1
Data Mining Concepts
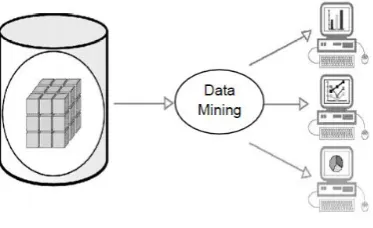
[image:2.595.321.508.74.188.2]Data mining is an approach for information extraction from huge amount of data stored in a database .The concept of data mining is illustrated in Fig1. Recent trends in information technology (IT) and its growing application areas in addition to increase of available databases, along with the data mining are being used to extract and interpret information available in the databases, and explore the necessary information and their relationships to produce useful information/knowledge for decision making.
Fig 1. Data mining concept
In other words, data mining can be considered as an approach to determine the valid, novel, useful and ultimately understandable data patterns in a large database. Valid means that the extracted patterns can be applied for new dataset as well and are not explicitly useful for the data based on which the relationship are derived. Novel means that the patterns are non-trivial and unexpected. Useful means that the extracted patterns can be used for future activities, because the data mining is used as a means of decision support systems. Finally, understandable means that discovered relationships should be simple and interpretable. It has to be pointed out that data mining analyses are valid while having huge amount of data; otherwise, the achieved results may not be extended further. One solution to this problem is to consider data warehousing (DW) concepts. DW can be regarded as the infrastructure for data mining and is a repository that integrates existing data in one or several databases in a corporate database. A DW usually exists to support strategic and scientific decision-making based on integrated and shared information. DWs are also used to save legacy data for library and other purpose.
2.2
Data Mining Stages
Data mining analyses follow several stages including data cleaning, data selection, data reduction, information extraction, interpretation and reporting as shown in Figure 2. Since most data are provided through observations and measurements, they must be checked against errors and distortions. Data cleaning covers cleaning of data in addition to removing noises and duplications. Data selection refers to selection of some fields and records in a database in order to be used in the analysis operations as well as maintaining the data integrity to provide the proper results. Data reduction can be considered as a reselection of data. In this stage, volumes of the selected data are reduced from attribute and records point of view. Furthermore, some records are properly merged or transformed. At information extraction stage, the data are investigated to extract patterns and relationships; therefore, this is the main stage of a data mining process. Finally, at interpretation stage, the discovered patterns are evaluated and integrated using the essential parameters in a data mining process.
[image:2.595.322.538.661.747.2]3.
RELATED WORKS
3.1
Study Area
Tadepalli is on the southern bank of the Krishna River. Tadepalle or Tadepalli in Guntur district is located at 16° 24’N to 16° 24’N latitudes and 80° 34’E to 80° 34’E longitude. It has an average elevation of 22 metres (72 ft). The villages in Tadepalle mandal includes: Chirravur, Gundimeda, Ippatam, Kolanukonda, Krishnanagar, Kunchanapalli, Mellampudi, Penumaka, Prathuru, Tadepalli, Undavalli and Vaddeswaram. Total area consists of 19618.87 acres, the maximum humidity is in summer and early winter is the period of minimum humidity. The Annual rainfall of the study area is1040 mm The maximum temperature is 38 °C, while the minimum is 18 °C and the Population is 80,887 (2001 census).
3.2
Ground water quality data generation
Appropriate number of ground water samples was collected in the study area and the selected water quality parameters are measured by carrying out physicochemical analysis. The selected water quality parameters are pH, Electrical conductivity, chlorides, sulphates, nitrates, total hardness, total dissolved solids, fluorides, alkalinity, sodium, potassium and phosphates. A total number of 45 ground water samples are collected at predetermined locations.
3.3
Water Quality Index
WQI is computed to reduce the large amount of water quality data to a single numerical value that expresses the overall water quality at a certain location and time based on several water quality parameters. It is also defined as a rating reflecting the composite influence of different water quality parameters on the overall quality of water. According to the concept of indices to represent gradation in water quality was first proposed by Horton (1965). The main objective of water quality index is to turn complex water quality data into information that is understandable and useable by the public. Water Quality Index based on some very important parameters can provide a simple indicator of water quality.
3.3.1
Water Quality Index calculation
Water Quality Index is calculated from the following equation. Weighted arithmetic method has been used for calculation of WQI. The Unit weight (Wi) has been found out by using the formulae
i i
k
W
S
Where k = Proportionality constant
9 1 1 1 i i k S
Si = Standard permissible value of ith parameter as in Table 1;
Wi = unit weight of ith parameter
9 1
1 1 1 1 1 1 1 1 1 1
i
i pH Cl Alkalinity CaH MgH TH TDS F nitrates
S S S S S S S S S S
Water quality index (Weighted Arithmetic Mean method)
1 1 n i i i n i i q W WQI W
Where qi= Sub Index the quality rating for ith parameter
100 i i i V q S
Vi = observed value in laboratory; n = number of parameters
taken Si=standard value of ith parameter
4.
RESULTS
4.1
Estimation of Water Quality Index
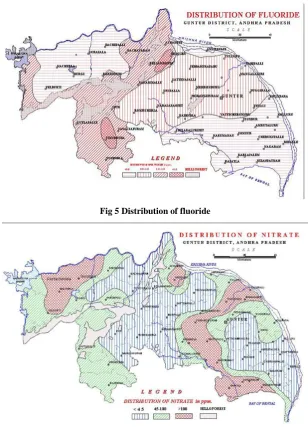
WQI of ground waters collected at 45 different locations at Tadepalli mandal in the months of Sept-Nov 2012 were calculated using the proposed methods Based on the attribute database of the water quality, the mapping of physicochemical analysis has been carried out and the extent of estimated parameters of pollution was mapped using Arc/View software.The results are shown below.
4.2
Groundwater Management
Incidences of the harmful effects of F- on health are on the increase; due not only to the widespread occurrence of F -bearing minerals in the Earth’s crust, but also to the impacts of environmental factors and human activities Therefore, a sustainable management plan on fluorosis is long overdue and is required for the study area. For formulating a sound management plan in the area, the following recommendations are made for the supply of high-quality groundwater with safe concentrations of F
- High F-concentration waters should be discouraged through regulations such as the provision of protected water-supply schemes and the control of groundwater usage for drinking purposes through effective monitoring.
Foods rich in calcium and phosphorous are recommended, as the rate of accumulation of F- in the human body decreases when these are consumed
An ecologically suitable vegetative cover would reduce the evapotranspiration from the soil, increase the rainfall and thus help to reduce the otherwise increasing concentration of salts.
Judicious use of fertilizers to obtain higher crop yields should be based on crop requirements and soil characteristics.
Environmental awareness of the health implications of F- should be emphasized through education of the public and community participation.
5.
CONCLUSIONS
to other locations with the same problem. In order to enable sustainable development of groundwater resources, it is necessary to delineate the safe and unsafe zones with reference to F- content
6.
REFERENCES
[1] N.K.C.Twarakavi, and J.J. Kaluarachchi, J. Environ Manag., 2006, 81, 405-419.2003, 5, 324.
[2] Akira Kawamura and Kenji Jinno, Prediction Method of Concentration Distribution Of Groundwater Pollutants Using A Field Monitoring Network System, Symposium on Groundwater Edited by Gerard.P. Lennon, 1991.
[3] Ashok kumar and et.al., “Understanding groundwater resources in Margajo watershed, Kodarma,Jharkhand-GWIS and GIS approach”.
[4] Das Gupta, M.; Purohit, K.M.; Jayita Datta. Assessment of drinking water quality of river Brahmani. Journal of Environment and Pollution. 2001, 8, 285-291
[5] Datta, P. S. & Tyagi, S. K. (1996) Major ion chemistry of groundwater in Delhi area: chemical weathering process and groundwater flow regime. J. Geol. Soc. India 47, 179–188.
[6] Deshmukh, A. N. & Chakravarti, P. K. (1995) Hydrochemical and hydrological impact of natural aquifer recharge of selected fluorosis endemic areas of Chandrapur district. Gond. Geol. Mag. 9, 169–184.
[7] Subba Rao, N. (1992) Factors affecting optimum development of groundwaters in crystalline terrain of the Eastern Ghats, Visakhapatnam area, Andhra Pradesh, India. J. Geol. Soc. India 40, 462–467.
[8] Subba Rao, N. (1995) Assessment of groundwater conditions in parts of Guntur district, Andhra Pradesh, India. UGCMinor Research Project Report.
[9] Subba Rao, N. (1998) Groundwater quality in crystalline terrain of Guntur district, Andhra Pradesh, India. Visakha Sci. J. 2, 51–54.
[10] Subba Rao, N. (2002a) Geochemistry of groundwater in parts of Guntur district, Andhra Pradesh, India. Environ. Geol. 41, 552–562.
[11] Subba Rao, N. (2002b) Groundwater chemistry in two different hydrogeologic environments. J. Appl. Geochem. 4, 61–70.
[12] Subba Rao, N. (2003) Groundwater prospecting and management in an agro-based rural environment of crystalline terrain of India. Environ. Geol. 43, 419–431.
[13] Subba Rao, N. & John Devadas, D. (in press) Evaluation of groundwater quality in rural areas of Guntur district, Andhra Pradesh, India. Environ. Geochem.
[14] Subba Rao, N. & John Devadas, D. (2003) Fluoride incidence in groundwaters in a part of Peninsular India. Environ. Geol. (in press)
[15] Subba Rao, N. & Rao, A. T. (2003) Fluoride in groundwaters in a developing area of Guntur district, Andhra Pradesh, India. J. Appl. Geochem. 5, 94–100.
[16] Subba Rao, N., Krishna Rao, G. & John Devadas, D. (1998a) Variation of fluoride in groundwaters of crystalline terrain. J. Environ. Hydrol. 6, 1–5.
[17] Subba Rao, N., Prakasa Rao, J., Nagamalleswara Rao, B., Niranjan Babu, P., Madhusudhana Reddy, P. & John Devadas, D. (1998b) A preliminary report on fluoride content in groundwaters of Guntur area, Andhra Pradesh, India. Current Sci. 75, 887–888.
[18] Subba Rao, N., Srinivas Rao, G., Venkateswara Rao, S., Madhusudhana Reddy, P. & John Devadas, D. (1999) Environmental control of groundwater quality in a tribal region of Andhra Pradesh, India. Indian J. Geol. 71, 299–304.
[19] Suma Latha, S., Ambika, S. R. A. & Prasad, S. J. (1999) Fluoride concentration status of groundwater in Karnataka, India. Current Sci. 76, 730–734.
[20] Susheela, A. K. (1999) Fluorosis management programme in India. Current Sci. 77, 1250–1256.
[21] Twort, A. C., Hoather, R. C. & Law, F. M. (1974) Water Supply. Edward Arnold Publ. Ltd, London, UK.
[22] Venkateswara Rao, S., Krishna Rao, G. & Subba Rao, N. (1996) Factors controlling groundwater quality in parts of Srikakulam District, Andhra Pradesh, India. J. Indian Acad. Geosci. 39, 33–39.
A. RESULTS
Fig. 3 Map showing the investigated area and its features
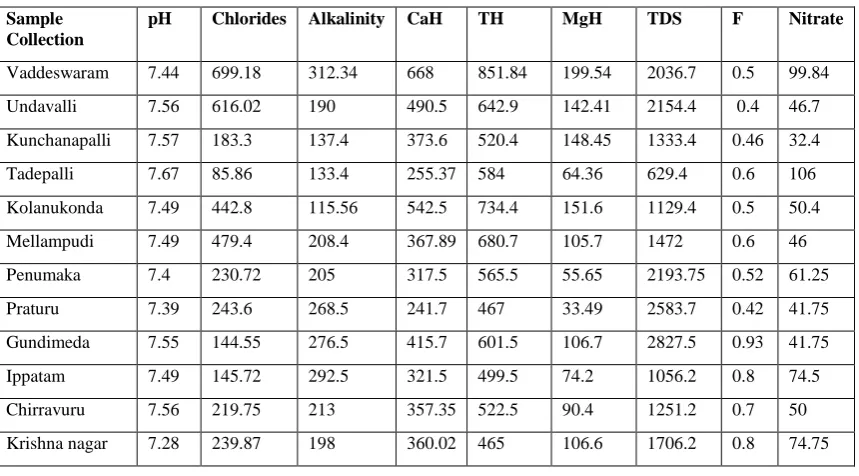
Table-1: The analytical results showing quality of ground water in the study area
Sample Collection
pH Chlorides Alkalinity CaH TH MgH TDS F Nitrate
Vaddeswaram 7.44 699.18 312.34 668 851.84 199.54 2036.7 0.5 99.84
Undavalli 7.56 616.02 190 490.5 642.9 142.41 2154.4 0.4 46.7
Kunchanapalli 7.57 183.3 137.4 373.6 520.4 148.45 1333.4 0.46 32.4
Tadepalli 7.67 85.86 133.4 255.37 584 64.36 629.4 0.6 106
Kolanukonda 7.49 442.8 115.56 542.5 734.4 151.6 1129.4 0.5 50.4
Mellampudi 7.49 479.4 208.4 367.89 680.7 105.7 1472 0.6 46
Penumaka 7.4 230.72 205 317.5 565.5 55.65 2193.75 0.52 61.25
Praturu 7.39 243.6 268.5 241.7 467 33.49 2583.7 0.42 41.75
Gundimeda 7.55 144.55 276.5 415.7 601.5 106.7 2827.5 0.93 41.75
Ippatam 7.49 145.72 292.5 321.5 499.5 74.2 1056.2 0.8 74.5
Chirravuru 7.56 219.75 213 357.35 522.5 90.4 1251.2 0.7 50
[image:5.595.85.515.442.680.2]Fig 4 Distribution of Chloride
Fig 5 Distribution of fluoride
B. RULE SET GENERATION
[image:7.595.109.488.277.341.2]Table 2: Criteria for acceptability and rejection in water quality
Table 3: Classification of water based on TDS
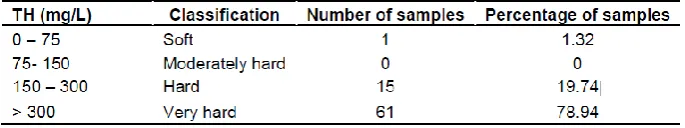
Table 4: Classification of water based on TH
[image:7.595.128.471.377.441.2]