Munich Personal RePEc Archive
Labour Market Flexibility: the Case of
Visegrad Countries
Tvrdon, Michal
Silesian University - School of Business Administration
2007
Online at
https://mpra.ub.uni-muenchen.de/12314/
LABOUR MARKET FLEXIBILITY: THE CASE OF
VISEGRÁD COUNTRIES
Michal Tvrdoň, Silesian University in Opava, School of Business Administration in
Karviná, Department of Economics, Univerzitní nám. 1934/3, 733 40 Karviná, Czech
Republic; e-mail: tvrdon@opf.slu.cz
Abstract
The presented article deals with labour market institutions and labour market flexibility in
the Visegrád countries. We can find out in theoretical literature a traditional set of institutional
aspects such as employment protection legislation, structure of wage bargaining, taxation of
labour, active labour market policies, the system of unemployment and social benefits. All
these aspects determine the institutional framework of the labour market. Theoretical
literature also has defined labour market flexibility as an instrument for adjustment process in
case of asymmetric shock. The article is composed of the comparative analysis of selected
criteria and corresponding economic indicators of the EU member states (EU-15 and V-4).
The evidence shows that the values of labour market flexibility in the Visegrád group
countries were higher than average of old EU-15 member states.
Keywords: labour market, institutional aspects, employment protection legislation, tax
wedge, labour market flexibility, unemployment benefits, active labour market policies,
Visegrád countries, European Union
JEL Classification: F 15, J08, J30, J65, J80
Introduction
The presented paper deals with the various problems associated with labour market
performance in the Czech Republic and other Visegrád group countries (V-4). The main goal
of the article is to evaluate an institutional framework of V-4 labour markets within EU and in
the context of future adopting single currency. Labour markets in EU new member states are
blamed for insufficient flexibility which has stemmed from persisting but still weakening
influence of precedent system of central planned economy. This argumentation has been
supported by the development of main macroeconomic indicators such as high unemployment
rate, respectively low employment rate and high share of long term unemployment on overall
monetary policy which is perceived as effective instrument of economic policy in case of an
asymmetric shock. Then we can ask if any alternative instrument exists. Economic theory
defined fiscal policy as one of the main instruments but because of Maastricht ´s fiscal criteria
and long-term state-budget deficits in most V-4 countries this instrument will hardly to be
used. Then the only possible instrument is labour market flexibility.
1. Conception of labour market flexibility
In this part of the paper I focus on institutional framework of the labour market or more
precisely I try to outline main theoretical approaches to individual institutional aspects.
The labour market is more complicated in general way. In accordance with [3] the labour
market is affected by culture, institutional, legislative or political mechanism. Generally, we
can find this structure of labour market institutions in theoretical literature:1 employment protection legislation, structure of wage bargaining, active labour market policies, taxation of
labour and unemployment benefits.
Most studies are focusing on influence of institutional aspects on unemployment or
employment, both in positive or negative direction - (i) some institutional aspects may
generate higher unemployment rate; (ii) some institutional aspects may influence the nature of
unemployment but have an ambiguous effects on unemployment rate and (iii) some
institutional aspects do not influence both the nature of unemployment or unemployment rate.
The analysis of an influence of these aspects may be carried out in two directions: first, we
can analyse the degree of labour market regulation, secondly, we can try to find an optimal
setting of institutional framework.
Freeman [13] discriminates two approaches to labour market regulation. The first one
(institutionalist view) considers these aspects desirable as significant instrument of social
protection and they can incite growth of productivity. These aspects can also operate as
moderate measures in case of aggregate demand decline. The second one (distortionist view)
highlights the benefit of market mechanism and takes it, that these institutional aspects
impede the adjustment process in case of economic shocks.
Betcherman et al [3], on the basis of World Development Report, Workers in an
Integrating World, the World Bank (1995), emphasizes four different reasons for public
intervention in the labour market:
1. Uneven market power - workers may find themselves in a weak bargaining position.
1
2. Discrimination - workers belonging to groups with little voice or power (e.g., due to age,
gender, ethnicity, etc.) may experience particular disadvantages in the labour market.
3. Insufficient information - workers and some employers may not have adequate
information to make informed decisions about the conditions of work.
4. Inadequate insurance against risk - workers are typically unable to formally insure
themselves against labour market-related risks associated, for example, with
unemployment, disability, or old age.
Blanchard and Wolfers [4] pursued how labour market institutions form the impact of
shocks on unemployment in two directions. First, they examined aspects influence on the
impact of shocks on unemployment. Secondly, the authors examined their influence on the
persistence of unemployment. In context of European labour market the authors conclude:
„There is enough heterogeneity in labor market institutions within Europe to potentially
explain differences in unemployment rates today. As to the evolution of institutions over time,
it is clear that neither the view that labor market institutions have been stable through time,
nor the view that the labor market rigidities are a recent development are right.“2
If labour market flexibility may be an instrument of adjustment process in case of an
asymmetric shock I matter to define labour market flexibility and its aspects. We can find out
pregnant definition of labour market flexibility in Eamets and Masso [11]: “We can say that
labour market flexibility shows how quickly markets adjust to the external shocks and
changing macroeconomic conditions.” 3
Klau and Mittelstadt [17] distinguish four broad aspects of labour market flexibility: (i)
real labour cost flexibility at the economy-wide level; (ii) adaptability of relative labour costs
across occupations and enterprises; (iii) labour mobility and (iv) flexibility of working time
and work schedules. The first two are macro- and microeconomic aspects of labour-cost
flexibility, while the latter two relate to the quantitative and qualitative adaptability of the
supply and use of labour. Some of these elements interact. Eamets and Masso [11] also
subdivide flexibility into microeconomic and macroeconomic level. Macroeconomic level can
be further divided into institutional flexibility and wage flexibility. The first one represents to
what degree the institutions and labour unions are involved in regulation of labour market.
The latter one indicates how the wages are sensitive to market fluctuations. Microeconomic
flexibility is associated with the labour market flows analysis. The labour market can be
characterized by various flows of workers (transitions between labour market states,
2
Blanchard and Wolfers [4, p.16]
3
occupational mobility and geographical mobility) and by jobs flows (job creation and job
destruction).
2. Employment protection legislation
First observed institutional aspect is employment protection legislation (EPL). We can
understand EPL as rules refer to hiring and firing process (e.g. unfair dismissals, termination
of employment for economic reasons, severance payments, minimum notice periods,
administrative authorization for dismissals, and prior consultations with trade union and/or
labour administration representatives).
Betcherman et al [3] considers EPL along a rigidity/flexibility continuum. At the rigid end
these regulations are enforced: temporary employment is restricted, hiring standards for
employers are in force, employer´s decision on workers dismissal is limited by legislation or
by severance, notice, and administrative requirements. At the flexible end liberal concept of
EPL is enforced: statutory (or collectively bargained) regulations are minimal and market
mechanisms largely determine hiring and firing.
According to Eamets and Masso [11] some of these rules of law were adopted as a
“pillow” in case of labour demand decline which can have negative effects on employment
while others are designed to protect employees from arbitrary dismissals.
We can find out two parallel view of EPL. The first one supposes that strict EPL can
impede effective labour market performance and implicitly the economy. The latter one is
based on an opinion that employment will be more stabile and individual contracts long-term
if strict EPL exists. In other words – strict EPL reduces hiring and firing and stabilize the
flows within labour market.
We can determine the level of strictness of labour market legislation through the use of
indexes, which were created by World Bank within the frame of Doing Business Program.
OECD Strictness of Employment Protection Legislation is an alternative option. I used in this
article World Bank approach.
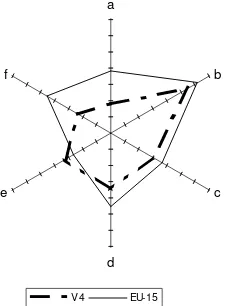
Single axes of the hexagon are following: axis a represents Difficulty of Hiring Index and
it means difficulty of hiring a new worker; axis b represents Rigidity of Hours Index and it
means restrictions on expanding or contracting the number of working hours; axis c
represents Difficulty of Firing Index and it means difficulty and expense of dismissing a
redundant worker; axis d represents Rigidity of Employment Index and it means an average
percentage of the worker’s salary; axis f represents Firing costs (cost of a redundant worker,
[image:6.595.118.231.148.301.2]expressed in weeks of wages).4
Figure 1. Hexagon of labour market legislation (2005)
a
b
c
d e
f
V4 EU-15
Source: Doing Business: http://www.doingbusiness.org
Figure 1 compares the valuables of three groups – EU15 and V-4. My conclusions in this
section are as follows:
- V-4 countries had lower legislation regulation than EU-15 average;
- EU-15 average employment protection legislation was the higher but considerable
differences existed (countries with low level of regulation e.g. Denmark or United
Kingdom on the one hand and countries with significant higher degree of regulation e.g.
Greece or Spain).
3. Structure of wage bargaining
We understand trade union as: „a continuous association of wage earners for the purpose
of improving the conditions of their employment”. 5
Trade unions are established on the basic of asymmetry in contracting between individual
workers and employers. This inconsonance rises from existence of human and labour rights.
Aidt and Tzannatos [1] show both costs arising from existence trade unions and potential
benefits. Trade unions play key role in wage bargaining within EU and they have impacts on
labour costs. Higher negotiating power of trade unions tends to increase wage level above
equilibrium level. Buscher et al [7] argues that this effect could be forced if strict EPL and
generous unemployment benefits exist.
4
Methodology is available on http://www.doingbusiness.org/MethodologySurveys/EmployingWorkers.aspx
5
Borghijs and van Poeck [5] distinguish three levels of wage negotiations: (i) firm or plant
level (decentralised bargaining); (ii) industry level (bargaining at the intermediate level) and
(iii) national or country wide level (centralised bargaing).
De Grauwe [14] argues: „...countries with either strong centralization or strong
decentralization of wage bargaining are better equipped to face supply shocks, such as oil
increase, than countries with an intermediate degree of centralization. In these „extreme“
countries there will be a greater wage moderation than in the intermediate countries. As a
result, the countries with the extreme centralization or decentralization tend to fare better, in
terms of inflation and unemployment, following supply shocks, than the others.“6
This institutional aspect is hard to search because of data´s accessability and their
harmonisation from different sources. I made use of [19] and [20]. I added one new partial
indicator – coefficient of coverage/density. Following table summarizes main indicators for
[image:7.595.71.514.364.633.2]appraisal of the structure of wage bargaining.
Table 1. Wage bargaining in selected EU countries
Centralization1 1995 – 2000
Co-ordination2 1995 - 2000
Trade Union Density 2000
Collective bargaining coverage (as % ) - 2000
Coefficient coverage/density 2000
Belgium 3 4,5 56 90 1,6
Denmark 2 4 74 80 1,08
Finland 5 5 76 90 1,18
France 2 2 10 90 9
Ireland 4 4 38 n.a. -
Italy 2 4 35 80 2,28
Germany 3 4 25 68 2,72
Netherlands 3 4 23 80 3,43
Portugal 4 4 24 80 3,33
Austria 3 4 37 95 2,56
Spain 3 3 15 80 5,33
Sweden 3 3 79 90 1,13
United
Kingdom 1 1 31 30 0,96
Czech Republic 1 1 27 25 0,92
Hungary 1 1 20 30 1,5
Poland 1 1 15 40 2,67
Slovakia 2 2 36 50 1,39
Note:
a) Centralisation:
1 = Company and plant level predominant.
2 = Combination of industry and company/plant level, with an important share of employees covered by company bargains.
3 = Industry-level predominant.
4 = Predominantly industrial bargaining, but also recurrent central-level agreements. 5 = Central-level agreements of overriding importance.
b) Co-ordination:
1 = Fragmented company/plant bargaining, little or no co-ordination by upper-level associations.
6
2 = Fragmented industry and company-level bargaining, with little or no pattern-setting.
3 = Industry-level bargaining with irregular pattern-setting and moderate co-ordination among major bargaining
actors.
4 = a) informal co-ordination of industry and firm-level bargaining by (multiple) peak associations;
b) co-ordinated bargaining by peak confederations, including government-sponsored negotiations (tripartite agreements, social pacts), or government imposition of wage schedules;
c) regular pattern-setting coupled with high union concentration and/or bargaining co-ordination by large firms.
d) government wage arbitration.
5 = a) informal co-ordination of industry-level bargaining by an encompassing union confederation; b) co-ordinated bargaining by peak confederations or government imposition of a wage schedule/freeze, with a peace obligation.
Source: OECD [19]; [20]; own calculation
Trade unions ´s negotiating power is a factor which has impacts on rigidity degree of the
labour market. This is a result of a fact that unions control wage bargaining effectively not but
that they have few members as we can see in a table. Last but one column represents
collective bargaining coverage (as percentage). The significant contrast was the situation in
France, where only 10 % of workers were members of trade unions but 90 % of workers were
covered by collective agreements. The coverage was high also in Scandinavian countries but
this was with one difference – these countries were distinguished by high degree of union
density which compensated the high coverage. On the other hand both indicators were low in
some countries – Anglo-Saxon countries and V-4 countries, where both density and coverage
reached low valuables. If we attach these indicators in a fraction (numerator is the coverage
and denomination is a density) we get new coefficient (in table this is the last column).
I believe that this coefficient is important factor of overall labour market flexibility. If the
coefficient reaches value close to one, then the negotiating power of unions conforms to size
of union´s membership. If we look at previous table we can see that United Kingdom, Czech
Republic, Slovakia or Scandinavian were close to this value. I have tried to demonstrate that
low unions ´s density does not mean their low negotiating power by definition.
4. Labour taxation
Taxis on employment refer to both sides on labour market – labour supply (labour force
pay income taxes) on the one hand and labour demand (employers, who pay payroll taxes) on
the other side.
Economists have created so-called tax wedge which expresses overall taxation of labour
(see figure 2).
Figure 2. Tax wedge
Source: Dolenc and Vodopivec [10]
Buscher et al. [7] argues that labour taxation widen the wedge between employer´s costs
and employee´s income. If taxis are transferred on employers then employment costs rise and
eventuality is that labour demand will fall. If firms compensate this additional costs by lower
wages than the wage/price of product ration will not change. Indeed, the consumption
wage/price of product ratio declines. Then more households can obtain social benefits and
their incentive to work is reduced. Hence, rising labour taxes have a negative impact on
employment. Daveri and Tabellini [9] controvert this argumentation on the basis of
Scandinavian countries – they ask why unemployment is so low while high labour taxation in
continental Europe evokes high unemployment. One possibility how to make clear this
contrast is connectedness of high degree of centralisation and co-ordination, which can reduce
wage claims.
According to [2] tax wedge means that real take-home pay is lower than pre-tax real wage.
If that tax wedge increases, than implicitly consumption grows more slowly. Authors make
reference to tax wedge changes may affect not only the bargaining stance of unions but also
individual labour – supply decisions. This holds if generous unemployment benefits exist.
Table 2 represents total tax wedge and its components. The tax wedge is expressed through
the use of percentage rate of overall labour costs. The individual components of tax wedge
differed significantly – V-4 countries had the lowest income taxes (except Hungary) and its
percentage rate was almost half in comparison with EU-15 average (14,2 %). Scandinavian
countries (Denmark, Finland and Sweden) and Germany or Belgium had the highest income
taxes. We can see significant differences in the percentage rates of social security contribution
too - workers in Poland, Netherlands, Austria or Germany paid the highest amounts while
workers in Ireland, Spain, Finland or Sweden paid the lowest amounts. If we look at
employer´s social security contribution rates, employees in France, Hungary, Czech Republic,
Sweden, Italy, Spain and Germany had the highest rates in EU. The lowest rates existed in
Anglo-Saxon countries: USA, United Kingdom and Ireland.
We can find some comparative advantage in the last column. This column represents
labour costs in US dollars with equal purchasing power. The tendency is that labour costs in
new member states convergence to EU average. So it is evident that this comparative
advantage will not last forever. We have to look at other indicators to determine long-term
criteria of competitive strength on the basic of the future outlook. This alternative indicator
advantage will disappear. V-4 countries (except Slovakia) had higher total tax wedge in
comparison with EU average. I argue that foreigner investors can make decision on the basic
of the total tax wedge (because total labour costs converge in long-term period in EU) which
it may subsequently end in that they can prefer countries with lower rate of the total tax
[image:10.595.73.496.185.498.2]wedge.
Table 2. Labour taxation (as % of labour costs, 2005)1
Country Tax wedge Income tax Social security contribution rates Labour costs2
employee employer
Belgium 55,4 21,4 10,7 23,3 53 581
Germany 51,8 17,3 17,3 17,3 53 278
United Kingdom 33,5 15,7 8,2 9,6 50 982
France 50,1 10,8 9,6 29,7 47 824
Austria 47,4 10,9 14,0 22,6 47 692
Netherlands 38,6 9,5 19,7 9,5 45 910
Sweden 47,9 18,1 5,3 24,5 43 916
Finland 44,6 20,1 5,1 19,4 43 443
Denmark 41,4 30,2 10,6 0,5 38 664
EU-15 42,1 14,2 10,0 17,8 36 205
Italy 45,4 13,6 6,9 24,9 36 011
Spain 39,0 10,7 4,9 23,4 34 545
Ireland 25,7 11,4 4,7 9,7 34 395
USA 29,1 14,6 7,3 7,3 34 144
Greece 38,8 4,3 12,5 21,9 33 050
Portugal 36,2 8,1 8,9 19,2 24 933
Czech Republic 43,8 8,6 9,3 25,9 20 559
Poland 43,6 5,3 21,3 17,0 19 548
Hungary 50,5 14,3 10,0 26,3 18 559
Slovakia 38,3 6,9 10,6 20,8 15 748
Note: 1 Single individual without children at the income level of average worker.
2
US dollars with equal purchasing power. Source: OECD
If we look at V-4 countries we can see, except Hungary, minimal differences between two
observed groups. If we look more precisely we find out some differences between countries –
e.g. Czech Republic applied high level of employer ´s social contribution rates, but in Poland
employees paid more than employer. Hungary applied high tax progressiveness in contrast to
other V-4 countries.
5. Active labour market policies
According to Scarpetta [21] active labour market policies (ALMPs) encompass different
measures, including training and re-training programmes, search counselling,
The main aim of ALMPs is to improve the possibilities of unemployed to re-enter labour
market. These policies are well founded in case of low income and low skilled labour force.
ALMPs may have several effects on employment and Estevao [12] alludes to at least five
channels:
- ALMPs may generate more efficient matching between job vacancies and unemployed
workers because of adjustments in job-seekers’ skills (for instance, through training
programs) or more effective searching (for instance, through more active employment
agencies);
- labour force productivity may increase, owing to either training programs or on-the-job
learning, in the case of direct subsidies to job creation;
- ALMPs may keep unemployed workers attached to the labour force, even after a longer
period of inactivity;
- job creation programs (e.g., direct subsidies to low-skill employment) may generate
windfall effects;
- ALMPs may lower the disutility of being unemployed, as they provide an occupation to
otherwise unemployed workers, some income, and a hope of keeping their labour skills.
Table 3 shows the composition of expenditure on LMP measures by category for 2004.
The largest share of expenditure among selected EU countries felt on measures providing
training. The second most important category was employment incentives. These measures
support the recruitment of unemployed people into regular market jobs, typically through
wage-subsidies or exemptions to employers social contributions. If we look at the table we
can see significant share of expenditure differences among EU countries even among V-4
countries7. In Czech Republic and Hungary employment incentives represented the most important area of expenditure in 2004, whereas in Slovakia the most imporant area was direct
job creation. The specific situation was in United Kingdom, where training was much used
and consumed 82,6% of ALMPs expenditure. Another imporant area of ALMPs was
integration of disabled and this categore represented the largest share of expenditure in
Scandinavian countries (Denmark and Sweden) and Netherlands. Start-up incentives, which
aim is to promote enterpreneurship by encouraging the unemployed and other target groups to
start their own business or to become self-employed are relatively not important and they
consumed small share of ALMPs expenditure (except Slovakia and Greece).
Table 3. Share of expenditure on ALMPs measures by category, 2004
7
Training Employment incentives
Integration of disabled
Direct job creation
Start-up incentives
Belgium 21,3 16,5 11,8 50,0 0,4
Czech Rep. 12,8 35,7 25,0 22,7 3,8
Denmark 35,5 30,3 34,2 0,0 -
Germany 42,5 9,9 17,2 15,1 15,3
Spain 22,2 42,7 12,8 14,7 6,1
France 42,5 13,6 11,7 31,7 0,5
Ireland 36,8 14,6 7,1 41,5 -
Italy 41,4 45,5 1,2 1,8 9,6
Hungary 22,3 45,7 4,5 24,9 2,7
Netherlands 31,8 2,6 49,7 15,9 -
Austria 64,8 12,9 11,9 9,5 0,9
Portugal 52,8 31,0 8,3 7,4 0,5
Slovakia 14,1 10,9 1,2 48,7 25,0
Finland 51,9 15,9 12,8 10,9 1,9
Sweden 34,6 18,5 43,0 - 3,3
United Kingdom
82,6 1,0 13,6 2,5 0,3
Greece 18,5 25,3 19,6 - 36,5
Source: Melis [18]
6. Unemployment benefits
System of unemployment benefits and employment protection legislation are two way how
to protect workers in case of loss of employment. While EPL protects labour force which is
employed and do not invoke any tax burden explicitly, unemployment benefits provide
insurance to better part of labour force and UB are financed by social security contributions.
Grubb [15] makes reference to most national labour legislations on providing these
benefits are strict in one aspect – after certain duration of providing unemployment benefits
the unemployed workers are obliged to accept whatsoever job regardless of qualification.
Some authors argue that „the longer unemployment benefits are available the longer
unemployment lasts“. 8 Higher level of unemployment benefits and longer period of providing reduce the gap between income from working activity and transfers which means that the
initiative to work is lower. According to Jackman, Layard and Nickell [16] unemployment
benefits operate through dual mechanism: i) they reduce fear of being unemployed and ii)
they restrain the effectiveness of filling new jobs by unemployed and subsequently employers
are hustled to wage increase.
Negative effects of generous system of unemployment benefits can be offset by active
labour market policies (if their providing is time-limited and the rules for qualifying exist –
e.g. mandatory re-skilling).
8
International comparison of this institutional aspect is also complicated because only one
level of replacement rate does not exit in any state. Individual unemployment benefits systems
in member states of EU take into account number of specific personal and family
circumstances of unemployed, previous job history. Hence EU member states apply different
system of unemployment and social insurance. In some countries unemployment benefit are
taxable.
OECD in order to compare unemployment benefits systems creates an indicator called
replacement rate. This indicator gives the relation between income during employment and
income during period of unemployment. We can count this indicator as a ratio which means
that the closer the values are the less difference between wage and unemployment benefit is.
We distinction between i) gross replacement rate, which is pre-tax ratio of wage and
unemployment benefits and ii) net replacement rate, which is after-tax ratio of wage and
unemployment benefits.
If the net replacement rate does not much differ from income from employment than we
[image:13.595.72.527.427.674.2]talk about unemployment trap.
Table 4. Main indicators of system of unemployment benefits (2004)
Unemployment insurance benefit duration (months, equivalent initial rate)
Initial net replacement rate (as % of net earnings in work)
Average of net replacement rates over 60 months of
unemployment (as % of net earnings in work)
Social expenditures on unemployed (as % of total social protection
expenditures)
Belgium No limit 61 61 12,4
Austria 9 63 57 6,0
Denmark 48 70 70 9,8
Finland 23 70 65 9,9
France 23 75 57 7,9
Germany 12 69 66 8,6
Ireland 15 49 64 8,4
Italy 6 54 22 1,8
Netherlands 24 74 66 6,2
Greece 12 55 35 5,7
Portugal 24 83 68 5,5
Spain 21 67 49 13,3
Sweden 28 75 63 5,9
United Kingdom 6 54 53 2,7
Czech Republic 5 56 53 3,9
Hungary 9 49 39 2,8
Poland 12 59 54 4,0
Slovakia 8 56 40 5,8
Source: OECD [19]
If we follow OECD recommendations we can discover some implications. As far back as
in 1994 OECD Job Strategy reflected some conclusions of economic theory – generous
unemployment benefits, which are provided for a long time, have negative impacts on labour
financial stability in period of job search. This is very difficult to reach if the unemployed
person does not have government ´s financial support. That why OECD did not recommend
any measures to achieve optimum length of providing of unemployment benefits. We can find
out some recommendation about the generosity of the system – in terms of its reduction.
Second finding is that OECD recommended to re-value the condition of qualifying for
providing unemployment benefits. This step is associated with assuring of active job search
during being unemployed.
Denmark and Belgium are distinguished by a long period of unemployment insurance
benefit duration (in Belgium exists unlimited duration). In addition, not only the initial
replacement rate was relatively high but also replacement rate over 60 months of
unemployment and social expenditures on unemployed were relatively high. Italy and Greece
form opposite approach – short period of unemployment insurance benefit duration,
significant lower replacement rate over 60 months of unemployment or social expenditures on
unemployed.
V-4 countries have similar approach – period of unemployment insurance benefit duration
was short compared with EU-15 average value, social expenditures on unemployed were half
compared with EU-15 average value and both initial and over 60 months of unemployment
replacement rates were lower compared with average.
Group of countries (Austria, United Kingdom and Germany) had similar data as V-4
countries. Scandinavian countries (Finland, Sweden and Denmark) had initial replacement
rate which did not much differ from replacement rate over 60 months of unemployment. Their
social expenditures on unemployed were close to 10 % of total social expenditures.
7. Comparison overall labour market flexibility
Before our own labour market flexibility analysis I submit some conclusions, which are
taken from [19]. First, I discuss data which are contained in Table 5. The table was set up by
simple statistics methods in order to identify empirical patterns between different conceptions
of an institutional framework of labour market.
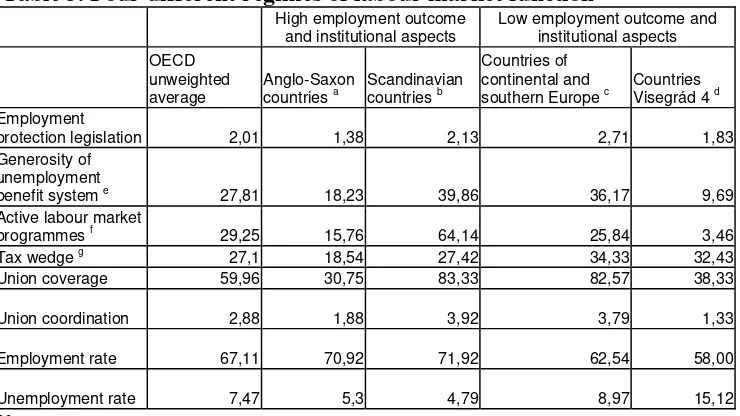
Whether we look at right part of left part of the table, it stands to reason that achievement
of the same labour market performance is possible by different conceptions of labour market
policy. It is also a question, if we can implicitly determine general framework of
economic-political recommendations for optimal labour market performance. I argue that it is good to
follow recommendations made by OECD. Therefore it is necessary to implement other
course, current setting of the institutional framework of labour market (e.g. lowering tax
wedge should be accompanied with parallel reform of social and health system with a view of
keeping a balance between government revenues and expenditures). In other words, it is not
maintainable, in long run view, to use Anglo-Saxon system of taxation of labour and parallel
[image:15.595.73.443.185.393.2]exercitation of Scandinavian unemployment benefits.
Table 5. Four different regimes of labour market function
High employment outcome and institutional aspects
Low employment outcome and institutional aspects
OECD unweighted average
Anglo-Saxon countries a
Scandinavian countries b
Countries of continental and southern Europe c
Countries Visegrád 4 d Employment
protection legislation 2,01 1,38 2,13 2,71 1,83
Generosity of unemployment
benefit system e 27,81 18,23 39,86 36,17 9,69
Active labour market
programmes f 29,25 15,76 64,14 25,84 3,46
Tax wedge g 27,1 18,54 27,42 34,33 32,43
Union coverage 59,96 30,75 83,33 82,57 38,33
Union coordination 2,88 1,88 3,92 3,79 1,33
Employment rate 67,11 70,92 71,92 62,54 58,00
Unemployment rate 7,47 5,3 4,79 8,97 15,12
Note:
a) This group of countries includes Australia, Canada, Japan, Korea, New Zealand, Switzerland, the United Kingdom and the United States.
b) This group of countries includes Austria, Denmark, Ireland, the Netherlands, Norway and Sweden. c) This group of countries includes Belgium, Finland, France, Germany, Italy, Portugal and Spain. d) This group of countries includes the Czech Republic, Poland and the Slovak Republic.
e) Average unemployment benefit replacement rate across two income situations (100% and 67% of APW earnings), three family situations (single, with dependent spouse, with spouse in work), over a five-year period of unemployment.
f) ALMP expenditures per unemployed workers as a percentage of GDP per capita.
g) Tax wedge between the labour cost to the employer and the corresponding net take-home pay of the employee for a couple with a dependent spouse and two children earning 100% of APW earnings.
Source: OECD [19]
Another significant finding in [19] is heterogeneity in economy policy setting and relation
to overall labour market performance within OECD countries. This analysis provides
following considerations:
- positive labour market indicators development (employment and unemployment rate)
could be associated with different levels of interventionism.
- it depends on a mix between supply and demand side economic policy.
If we look at analysed data from previous parts of the paper, these concluding remarks
occur:
- Most V-4 countries had slightly higher tax wedge compared to EU-15.
- Coefficients of union density and union coverage of V-4 countries were close to valuable
of 1 (except Poland) which means that bargaining power is corresponding to union
membership.
- Wage bargaining coordination was among V-4 countries significant lower. This is given
in that wage bargaining takes place on firm level.
- Duration of providing unemployment replacement rates was shorter in V-4 countries than
EU-15.
- Labour markets in V-4 countries appeared to be more flexible than in EU-14 but level of
flexibility is much lower compared to the USA.
As part of the ongoing reassessment of its recommendations to address issues of high
unemployment and low labour-force participation, the OECD in study [6] has carried out a
thorough assessment of labour market reforms on which this section relies heavily. All policy
measures implemented ALMPs, taxes and social security contributions, EPL, unemployment
benefit systems, wage formation and industrial relations, working-time flexibility and
part-time work and old-age pension systems and early retirement schemes.
Table 6. Aggregate reform intensity indicator, reform intensity indicator by area (1994-2004)
Summary reform intensity indicator1
Reform intensity indicator by area1
Score Ranking2
ALMPs Tax wedge EPL
Unemployment benefits
Wage formation
Working time flexibility
Early retirement, invalidity and old-age pension system Czech
Republic 6,2 28 17 0
-3 12 -5 -17 33
Hungary 12,3 19 31 25 -7 19 -9 0 33
Poland 11,2 23 29 0 -3 15 5 17 0
Slovakia 13,0 18 12 25 14 19 0 17 8
Note: 1 all reform intensity indicators are expressed as a percentage of the maximum possible score
2
Ranking within 30 OECD countries
Source: Brandt, Burniaux and Duval [6].
Table 6 represents the reform intensity indicators. According to Brandt, Burniaux and
Duval [6] there is no clear relationship between the initial conditions of labour market
performance and subsequent reform efforts. Some countries have taken only modest action
despite a poor starting point (Poland, Slovakia and Hungary) compared with the rest of OECD
countries. Only few reforms have been reported for the Czech Republic (mainly because of
favourable initial labour market performance compared with the rest of V-4 countries during
[image:16.595.71.499.411.567.2]Conclusions
This paper deals with labour market perfomance in V-4 countries. If the autonomous
monetary policy is no more available, economic theory defined the labour market flexibility
as an instrument for adjustment process in case of asymmetric shock. Another need of the
labour market flexibility is resulting from maintenance or increase of competitive strength.
On the assumption that Eurozone states, which had mostly lower overall labour market
flexibility then V-4 countries, then I suppose that accession of Czech Republic or other EU
new Member states will not mean increased costs for present Eurozone states. It is true, that
Eurozone has not been hit by significant asymmetric shocks which would prove theoretical
literature conclusions yet. Though I am in essential agreement with argumentation that labour
market reforms are unavoidable. This holds especially for countries of continental Europe or
south Europe. If we look at situation in V-4 countries I assume that the need for labour market
reform arise not either from future adopting single currency but from demographic situation
and structure of social and pension system. In these boundaries future accession into
Eurozone may subserve as an exogenous anchor (we can see similarity in accession of the
Czech Republic into EU, which also subserved as an exogenous anchor during complicated
transition process). Then the lowering of labour taxation, the reform of pension system and
the long-term unemployment are the main tasks for political authorities. Some of these
reforms have been already taken in the Czech Republic but we can thin of these reforms as
partial ones (in the Slovak Republic these reforms were much more intensive).
Claims on increased labour market flexibility arise with probable scenario of inconsistent
business cycle of V-4 countries and the rest of Eurozone. If we look at economic forecast then
higher annual growths are predicted in case of V-4 countries in comparison with Eurozone
ones. Then ECB will have tied hands because it will have only one monetary instrument for
adjustment process in two different stage of business cycle. Finally, I stress need of sufficient
labour market flexibility for adjustment process again.
References
[1] AIDT, T.; TZANNATOS, Z. 2001: The Cost and Benefits of Collective Bargaining: A Survey. [Social Protection Discussion Paper Series, No. 0120]. Washington, DC.: The World Bank, 2001.
[2] BAKER, D.; GLYN, A., HOWELL, D.R., SCHMITT, J. 2005: Labour Market Institutions and Unemployment: A Critical Assessment of the Cross-Country Evidence. In HOWEL, D.R. (ed.). Fighting Unemployment: The Limits of Free Market Orthodoxy.
[3] BETCHERMAN, G.; LUINSTRA, A.; OGAWA, M. 2001: Labour Market Regulation: International Experience in Promoting Employment and Social Protection. [Social Protection Discussion Paper Series, No. 0128]. The World Bank. 2001.
[4] BLANCHARD, O.; WOLFERS, J. 1999: The Role of Shocks and Institutions in the Rise of European Unemployment: The Aggregate Evidence. [Working Paper No. 7282]. Cambridge (MA): NBER, 1999.
[5] BORGHIJS, A.; VAN POECK, A. 2001: EMU and Labour Reform: Needs, Incentives and Realisations. [Working paper N. 2001022]. University of Antwerp, 2001.
[6] BRANDT, N.; BURNIAUX J. M.; DUVAL, R. 2005: Assessing the OECD Jobs Strategy: Past Development and Reforms. [Economic Department Working Paper No. 429]. Paris: OECD, 2005.
[7] BUSCHER, H.; DREGER, CH.; RAMOS, R.; SURINACH, J. 2005: The Impact of Institutions on Employment Performance in European Labour Markets. [Discussion Paper No.1732]. Bonn: IZA, 2005.
[8] CHECCHI, D.; LUCIFERA, C. 2002: Unions and Labour Market Institutions in Europe. [Working Paper n.16]. Milano: Dipartimento di Economia Politica e Aziendale, 2002. [9] DAVERI, F.; TABELLINI, G. 1997: Unemployment, Growth and Taxation in Industrial
Countries. Washington: World Bank, 1997.
[10]DOLENC, P.; VODOPIVEC, M. 2005: Tax wedge on labour: Slovenia vs. EU and OECD countries. [Working Paper]. Hans Böckler Stiftung, 2005.
[11]EAMETS, R.; MASSO, J. 2004: Labour Market Flexibility and Employment Protection Regulation in the Baltic States. [Discussion Paper N. 1147]. Bonn: Institute for the Study of Labor, 2004.
[12]ESTEVAO, M. 2003: Do Active Labor Market Policie Increase Employment? [Working Paper 03/2003]. Washington: IMF, 2003.
[13]FREEMAN, R.B. 1993: Labor Market Institutions and Policies: Help or Hindrance to Economic Adjustment?” Proceedings of the World Bank Annual Conference on Development Economics, 1992. Supplement to the World Bank Economic Review and the World Bank Research Observer.
[14]GRAUWE DE, P. 2003: Economics of Monetary Union. New York: Oxford University Press, 2003. 258 s. ISBN 0-19-925651-9.
[15]GRUBB, D. 2000: Eligibility Criteria for Unemployment Benefits. [Economic Studies No. 31]. Paris: OECD, 2000.
[16]JACKMAN, R.; LAYARD, R.; NICKELL, S. 1996: Combating Unemployment: Is Flexibility Enough? [Discussion Paper No. 293]. London: Centre for Economic Performance, London School of Economics and Political Science, 1996. ISBN 0 7530 0539 5.
[17]KLAU, F.; MITTELSTADT, A. 1986: Labour market Flexibility. Paris: OECD. 1986. [18]MELIS, A. 2006. Expenditure on Labour Market Policies in 2004. Statistic in focus.
European Communities, 2006. ISSN 1024-4352
[19]OECD. 2006. Employment Outlook 2006. Boosting Jobs and Incomes. Paris: Organization for Economic Cooperation and Development, 2006. ISBN 92-64-02384-4. [20]OECD. 2004. Employment Outlook 2004. Employment Protection Regulation and
Labour Market Performance, 2004.