http://dx.doi.org/10.4236/ojee.2015.44007
How to cite this paper: Aliyu, A.K., Bukar, A.L., Ringim, J.G. and Musa, A. (2015) An Approach to Energy Saving and Cost of Energy Reduction Using an Improved Efficient Technology. Open Journal of Energy Efficiency, 4, 61-68.
http://dx.doi.org/10.4236/ojee.2015.44007
An Approach to Energy Saving and Cost of
Energy Reduction Using an Improved
Efficient Technology
Abubakar Kabir Aliyu1*, Abba Lawan Bukar2, Jamilu Garba Ringim3, Abubakar Musa4 1Faculty of Electrical Engineering, Centre of Electrical Energy System, Johor Bahru, Malaysia
2Department of Electrical Engineering, Faculty of Engineering, University of Maiduguri, Maiduguri, Nigeria 3Federal Airport Authority of Nigeria, Katsina, Nigeria
4Department of Electrical Engineering, Faculty of Engineering, Ahmadu Bello University, Zaria, Nigeria
Received 15 August 2015; accepted 23 November 2015; published 26 November 2015
Copyright © 2015 by authors and Scientific Research Publishing Inc.
This work is licensed under the Creative Commons Attribution International License (CC BY).
http://creativecommons.org/licenses/by/4.0/
Abstract
The electricity consumption in commercial places like universities has tremendously increased recently. Modern and advanced energy efficient appliances are highly needed to substitute the conventional ones. Energy saving is of great important instead of its wastage, as utilizing the energy efficiently reduces the cost of energy. Energy consumption varies for commercial building due to several factors such as electrical appliance usage, electrical appliance type, management, etc. Due to the advancement in technology, there are new emergence appliances that are of high efficiency and have less energy consumption. A case study is conducted on selected five tutorial rooms, level 4 buildings in the Faculty of Electrical Engineering 19 A, Universiti Teknologi Malay-sia. The paper proposes new emergence equipments with high efficiency and less power con-sumption to replace the existing ones. A survey is conducted on the number of electrical ap-pliances used for each of the tutorial rooms, time table for each tutorial room and the Tenaga Na-sional Berhad pricing and tariff are taken into consideration in the analysis of the energy con-sumption and the cost of energy. This paper aims at reducing the amount of energy concon-sumption by replacing the existing electrical equipments with high efficient electrical equipments; it also tends to reduce the cost of energy paid to the utility. By observing the results, it shows that the proposed efficient electrical equipments are more efficient, less power consumption and less cost compared to the existing electrical equipments.
Keywords
Energy Efficiency, Payback Period, Energy Saving, Energy Auditing, Energy Efficiency Measures
1. Introduction
The per capital electricity consumption of the developing countries has been considerably increased due to the increase in population and high demand for energy. Energy growth in Malaysia has been increasing in residen-tial, commercial, industrial and transport [1]. An increase in energy consumption has a great implication on the environment and global warming, therefore the policy to use the energy efficiency should be taken into account [2].
However, an efficient Management of Electrical energy Regulatory was introduced on 15 December, 2008 for the purpose of promoting energy efficiency in Malaysia. Thus, they make it compulsory for large commercial and industrial electrical consumers to manage their equipments so as to develop and implement EEMs to reduce energy losses, cost of energy and enforce efficient utilization of electrical energy [3].
Due to the advancement of technology, researchers and engineers are always working to see that they produce an apparatus or equipments which are very efficient in terms of energy. Energy efficiency can be defined as us-ing less energy to produce the same amount of services or useful output, for example, residential sector, com-mercial sector and industrial sector. Energy efficiency in terms of mathematical expression can be defined as the ratio of the useful output of a process and the energy input into a process, and it is expressed in percentage [4].
Energy efficien Output
I cy
nput
=
The factors that contribute to high energy usage can be grouped into three.
Firstly, electricity consumption of the equipments itself. That is the purchase of fairly used equipment and non-energy efficient equipments.
Secondly, the number of equipments used for a particular place. As it is known that the number of equipments is directly proportion to the energy consumption. The used of many numbers of equipments such as fans, lights, air conditioner etc. than the design requirements.
Thirdly, the duration usage of the equipments. Long duration use of electrical equipment is directly proportion to the energy consumption [5].
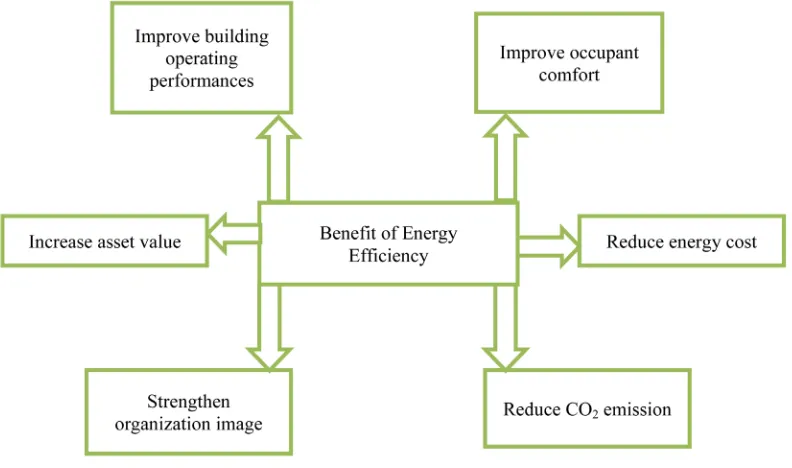
[image:2.595.116.512.476.710.2]Buildings in the university are usually characterized by high amount of energy consumption. A large portion of energy is being channeled to lecture halls since learning and teaching are the main activities in the campus. As this building consumes a large portion of energy, the energy that being waste should be identified and also should find a way of achieving energy efficiency is very important, that is using less energy to provide the same amount [6]. Some of the advantages of efficient use of energy is shown inFigure 1 [7].
This paper aims at reducing the amount of energy consumption by replacing the existing electrical with high efficient electrical appliances; these also tend to reduce the cost of energy paid to the utility. It also presents the results and analysis of energy audit of five tutorial rooms, level 4 buildings in the Faculty of Electrical Engi-neering 19 A, University Teknologi Malaysia (UTM).
2. Methodology
In this section, the method and the steps carried out is briefly described based on the case study. In order to un-derstand fully the concept, energy consumption, price of equipments, cost of energy saving, bill of saving and the payback period are clearly explained and analyzed.
2.1. Energy Management and Energy Auditing
Due to an increase in energy consumption worldwide, energy management and energy auditing are considered to be a global challenge [8].
Energy management is termed as the strategy of adjusting and optimizing energy, using systems and proce-dures so as to reduce energy requirements per unit of output while holding constant or reducing total cost of producing the output of the systems while the users leave permanent access to the energy they need. The main objectives of energy managements are: resources conservation, climate protection and cost savings [9].
An energy audit is a fundamental of energy management services which employs methods of energy analysis to evaluate the energy usage and develop energy efficiency measures EEMs in the building. The energy audit for this case study disclosed electrical energy usage for lighting, air conditioner and projector. However an im-proved energy efficient equipments or energy efficiency measures EEMs are used aimed at reducing the cost of energy [3].
2.2. Electricity Consumption
The electricity consumption of the existing appliances and the proposed appliances was computed by multiplica-tion of the number of equipments N, power rating W and the operating hours OH. The mathematical expression is given below:
(
)
Electricity Consumption KW
1000
N W× ×OH =
2.3. Cost of Electricity Consumption
Cost of electricity consumption is the multiplication of electricity consumption with the price of electricity per kW∙h [dsm5].
Cost of electricityconsumption=Electricity Consumption price of elctricity×
2.4. Energy Saving
Energy saving is the differences between the energy consumption of existing appliances and the proposed ap-pliances.
Existing proposed
Energy Saving=Electricity Consumption −Electricity Consumption
2.5. Bill Saving
Bill saving was computed by multiplying energy saving with the electricity tariff. The mathematical expression is given as:
Bill Saving=Energy Saving Electricity Tariff×
2.6. Payback Period
savings of an option (or equipment) to equal the investment cost of that option [2].
(
)
incremental cost RM(
(
)
)
Simple payback period years
Annual energy saving RM year
=
3. Study Area
Tutorial Room 1 to 5 located in block P19 at the Faculty of Electrical Engineering (FKE), UTM was selected as the case study area. The classrooms selected are used as a lecture theatre for graduate studies. Electrical wattage and quantity of each of the equipments were studied and recorded. We are able to count and record all the equipments from tutorial Room 1 to 5. Since the tutorial rooms have the same electrical equipments, therefore Table 1shows the quantity of electrical equipments of one of the tutorial rooms, which is TR1.
3.1. Energy Audit of the Existing Equipments.
All the tutorial rooms have three things in common; which are; the air conditioning system, the projector and the lightning. The air conditioning system has the highest power consumption of 91.82%, followed by the projector system 7.39% and then the lightening bulbs 0.79%. The power consumption for each load is summarized inTable 2.
It should be noted that the level of energy consumption by each of the tutorial rooms differs, as each tutorial room has its own lecture time table. In Table 3, analysis of energy consumption characteristics for each of the selected tutorial rooms is carried out.
Although beside the used of lightning, projector and air conditioning, which are mainly provided for the pur-pose of lectures, sometime student comes with their handset chargers, laptop chargers and variety of electrical loads. These miscellaneous electrical loads are not included in this case study.Figure 2 shows the percentage of power consumption of the existing equipments. Air conditioner has the highest power consumption having 98.2% followed by projector with 7.39% and lighting with 0.79%.
Table 1. Quantity of electrical equipments in tutorial Room 1.
Room No. of Lightning No. of Projector No. of Air Conditioning System
TR 1 40 1 6
*
For the five tutorial rooms × 5.
Table 2. Power consumption of existing equipments.
S/N Equipment Model Power Consumption (W)
1 Air Conditioning System DAIKIN FCU-4-13-52A 3730
2 Projector Hitachi CP-EX250 300
3 Lightning Lamps Philips T8 32
[image:4.595.87.540.578.711.2]*For the five tutorial rooms × 5.
Table 3. Analysis of energy consumption characteristics of existing equipments.
Room Hour Class/Week Lightning kW∙hr/Week Energy Consumed by
Energy Consumed by Projector kW∙hr/Week
Energy Consumed by ACON kW∙hr/Week
Total Energy Consumption per Week kW∙hr/Week
Tutorial Room 1 6 7.680 1.8 134.280 143.760
Tutorial Room 2 36 46.080 10.8 805.680 862.560
Tutorial Room 3 15 19.2 4.5 335.700 359.400
Tutorial Room 4 24 30.720 7.2 537.120 575.040
Tutorial Room 5 5 6.4 1.5 111.9 119.8
TOTAL 2060.56
*
Figure 2. Piechart of power consumption of the proposed equipments.
3.2. Proposed Efficient Energy Equipments and the Analysis of Energy Consumption In this section, the energy efficient equipments are proposed to replace the existing equipments.Table 4shows the less power consumption equipments that have high energy efficient than the existent ones.
In selecting the lightning bulb, A T5 lightning bulb with high lumens of about 3200 Lumens and with a power consumption of 21 W was selected to replace the existing one. The existing T8 lamps have lumens of about 2800 lumens. Therefore, using this T5 lamp reduces the number of lamps in each tutorial room from 40 lamps to 35 lamps. A projector with an 80 W energy consumption was also selected to replace the existing one of 300 W and air conditioner of 3 hp was selected to replace the existing one of 3730 W. Table 5shows the of energy consumption for the proposed equipments. Figure 3 shows the percentage of power consumption of the pro-posed equipments, air conditioner has the highest wattage consumption with 95.7% followed by projector with 3.4% then the lighting lamp with 0.9%.
3.3. Analysis for Energy Saving, Cost of Energy and Payback Period
(
) (
)
Energy Savings kW hr Week
Existing Proposed 2060.56 1233.928 826.602 kW hr week ⋅
= − = − = ⋅
Therefore, energy saving per year = 42,983.304 kW∙hr/year
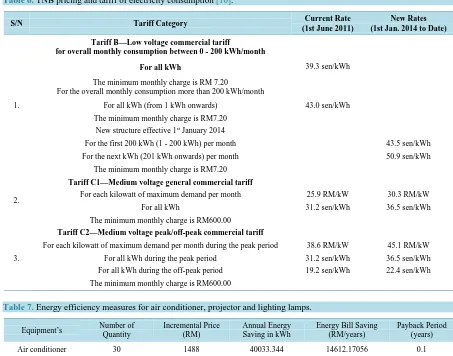
Using the data tariff obtained from the TNB website and as shown inTable 6, the cost energy consumption per kW∙hr is 36.5 sen/kW∙hr.
1) Total energy consumption of the existing equipments per week and per year is 2060.56 kW∙hr/week, and 107,149.12 kW∙hr/year respectively.
Therefore;
Total cost of energy=107149.12 36.5× =3910942.88 sen year=RM 39109.4288 year
2) Total energy consumption of the proposed equipments per week and per year is 1233.928 kW∙hr/week, and 64,164.256 kWhr/year respectively.
Total cost of energy=64164.25636.5=2341995.344 sen year=RM 23419.95344 year
Total cost of energy saving RM 15,688.91/year.
3) The Payback period for the Air conditioner can be calculated as follows:
(
)
incremental cost RM(
(
)
)
Payback period years
Annual energy saving RM year
=
(
)
1488Payback period years 0.1
14612.17056
Figure 3. Piechart of power consumption of the existing equipment
Table 4. Proposed equipments to be replaced.
S/N Equipment Model Power Consumption (W)
1 Air Conditioning System DAIKIN FCQ35C7VEB 2238
2 Projector BEN Q BEMW853UST 80
3 Lightning Lamps Philips T5 21
*
[image:6.595.90.540.408.561.2]For the five tutorial rooms × 5.
Table 5. Analysis of energy consumption characteristics for the proposed equipments.
Room Hour Class/Week Lightning kW∙hr/Week Energy Consumed by
Energy Consumed by Projector kW∙hr/Week
Energy Consumed by ACON kW∙hr/Week
Total Energy Consumption per Week kW∙hr/Week
Tutorial Room 1 6 5.0400 0.480 80.5680 86.0880
Tutorial Room 2 36 30.240 2.880 483.408 516.528
Tutorial Room 3 15 12.600 1.200 201.420 215.220
Tutorial Room 4 24 20.160 1.920 322.272 344.352
Tutorial Room 5 5 4.2000 0.400 67.1400 71.7400
TOTAL 1233.928
*Energy consumption per year × 52.
Therefore the payback period of air conditioner is one (1) year. The same procedure applies to lighting and projector.
Table 7shows the quantity numbers, incremental price (RM) which is the price difference between the pro- posed and existing equipment, annual energy saving (kWh), Energy bill saving (RM/years) and the payback pe-riod (years) of each equipments.
4. Conclusion
Table 6. TNB pricing and tariff of electricity consumption [10].
S/N Tariff Category Current Rate
(1st June 2011)
New Rates (1st Jan. 2014 to Date)
1.
Tariff B—Low voltage commercial tariff for overall monthly consumption between 0 - 200 kWh/month
For all kWh 39.3 sen/kWh
The minimum monthly charge is RM 7.20
For the overall monthly consumption more than 200 kWh/month
For all kWh (from 1 kWh onwards) 43.0 sen/kWh
The minimum monthly charge is RM7.20
New structure effective 1st January 2014
For the first 200 kWh (1 - 200 kWh) per month 43.5 sen/kWh
For the next kWh (201 kWh onwards) per month 50.9 sen/kWh
The minimum monthly charge is RM7.20
2.
Tariff C1—Medium voltage general commercial tariff
For each kilowatt of maximum demand per month 25.9 RM/kW 30.3 RM/kW
For all kWh 31.2 sen/kWh 36.5 sen/kWh
The minimum monthly charge is RM600.00
3.
Tariff C2—Medium voltage peak/off-peak commercial tariff
For each kilowatt of maximum demand per month during the peak period 38.6 RM/kW 45.1 RM/kW
For all kWh during the peak period 31.2 sen/kWh 36.5 sen/kWh
For all kWh during the off-peak period 19.2 sen/kWh 22.4 sen/kWh
[image:7.595.84.537.90.446.2]The minimum monthly charge is RM600.00
Table 7. Energy efficiency measures for air conditioner, projector and lighting lamps.
Equipment’s Number of Quantity
Incremental Price (RM)
Annual Energy Saving in kWh
Energy Bill Saving (RM/years)
Payback Period (years)
Air conditioner 30 1488 40033.344 14612.17056 0.1
Projector 5 2757.1 983.84 359.1016 7.678
Lighting lamps 80 25 1967.68 718.2032 0.035
ciency of the equipments considered for the case study, which are: lighting lamps, air conditioner and projector. Energy management and energy audit help in identifying several energy saving measures so as to improve the energy efficiency and reduce the cost of energy. From the analysis, it is calculated that if the proposed equip-ments are replaced, then the energy saved per year is 42,983.304 kW/hr and the cost of energy saving will be RM 15,688.91/year. If the university management can implement the proposed equipments, the energy con-sumption and the cost of energy will definitely reduce as seen in the analysis. The analysis in this paper is based on five tutorial rooms if compared to the university energy consumption is not up to 1%. Although the proposed equipments have high efficiency and less power consumption, their price is very expensive compared to the ex-isting one. A payback period is calculated to show the time taken to recover its initial outlay from the saving of the cost of energy paid to the TNB.
References
[1] Al-Mofleh, A., Taib, S., Mujeebu, M.A. and Salah, W. (2009) Analysis of Sectoral Energy Conservation in Malaysia. Energy, 34, 733-739. http://dx.doi.org/10.1016/j.energy.2008.10.005
[2] Mahlia, T.M.I., Razak, H.A. and Nursahida, M.A. (2011) Life Cycle Cost Analysis and Payback Period of Lighting Retrofit at the University of Malaya. Renewable & Sustainable Energy Reviews, 15, 1125-1132.
http://dx.doi.org/10.1016/j.rser.2010.10.014
2012, 616-619. http://dx.doi.org/10.1109/pecon.2012.6450288
[4] Patterson, M.G. (1996) What Is Energy Efficiency? Energy Policy, 24, 377-390. http://dx.doi.org/10.1016/0301-4215(96)00017-1
[5] (2012) S. Production and E. Products. Energy Efficiency in Malaysia Sustainable Production and Consumption. [6] Saidur, R., Rahim, N.A., Masjuki, H.H., Mekhilef, S., Ping, H.W. and Jamaluddin, M.F. (2009) End-Use Energy
Analysis in the Malaysian Industrial Sector. Energy, 34, 153-158. http://dx.doi.org/10.1016/j.energy.2008.11.004 [7] Schipper, L. and Meyer, S. (1992) Energy Efficiency and Human Activity: Past Trends, Future Prospects.Press
Syn-dicate of the University of Cambridge, New York.
[8] Study, A.C. and Zaria, A.B.U. (2015)Energy Auditing and Management. Journal of Multidisciplinary Engineering Science and Technology, 2, 1807-1813.
[9] Sameeullah, M., Kumar, J., Lal, K. and Chander, J. (2014) Energy Audit : A Case Study of Hostel Building. Interna-tional Journal of Research in Management, Science & Technology, 2, 36-42.