Comparative Performance of the Integration of ETM-8
and ERS-1 Data for Geological Application
Ayman H. Nasr
National Authority for Remote Sensing and Space Sciences, 23 Joseph Broz Tito
st., El-Nozha El Gedida, P.O. Box: 1564 Alf-Mascan, Cairo, Egypt.
Mohamed R. Metwalli
National Authority for Remote Sensing and Space Sciences, 23 Joseph Broz Titost., El-Nozha El Gedida, P.O. Box: 1564 Alf-Mascan, Cairo, Egypt.
ABSTRACT
Multispectral optical data are sensitive to the physical properties of the ground objects and express their spectral features. While SAR data are more influenced by the geometric properties and express backscatter information. Therefore, this study demonstrates the integration of Landsat ETM-8 and ERS-1 data for improved information, more specific inferences and increased interpretation capabilities. Since SAR images are affected by speckle, some standard speckle reduction filters like Lee-Sigma, Frost, and Gamma-Map were compared. Our focus was on the impact of the fusion on enhancing subsurface features for geological exploration. The fusion was performed using different algorithms namely; Intensity–Hue–Saturation (IHS), Multiplicative Transform (MT), and Gram-Schmidt (GS). The experimental results showed complementary spatial and spectral resolution characteristics. The joint processing contains the details beneath the surface cover of the respective ERS-1 data while maintaining the basic color content of the original ETM-8 data. The fused images have potentially enhanced subsurface features such as structures, paleo drainage, several deposits, and reveals the fluvial features which are not observable in the ETM-8 image. In addition to the visual interpretation, the performance of each method was further quantitatively analyzed by applying the following three measures: The High Pass Correlation Coefficient (HPCC), the Root Mean Squared Error (RMSE) and the Structural Similarity Index Measure (SSIM) which depicted that the Gram-Schmidt (GS) method gives the best synthesized results and outperformed the other methods.
Keywords
Fusion algorithms, Speckle filters, ETM-8 and ERS-1 data.
1.
INTRODUCTION
In many remote sensing applications, complementary information contained in different imagery is useful for studying the nature of the imaged area. The process of combining several kinds of imagery is known as data fusion [1]. A great number of fusion methods for remote sensing images have been developed [2]. The aims of the data fusion vary, they may detect the changes occurred over a period of time, enhance spatial resolution of multispectral images, generate an interpretation of the scene not obtainable with data from a single sensor, and reduce the uncertainty associated with the data from individual sensor [3]. Optical and SAR data fusion is not an easy task due to the different appearance of objects in their imagery. Many different approaches that merge complementary information from SAR and optical data have been investigated [4]. Multi-source remote sensing data fusion: status and trends can be found in [5].
Speckle noise is commonly observed in radar microwave sensing systems. This noise must be reduced before the data can be effectively utilized. Noise in radar images cannot be completely removed. However, it can be reduced significantly. Multi-sensor data fusion has become a discipline which demands more general formal solutions to a number of application cases [6]. In this study different algorithms have been applied namely; Intensity–Hue–Saturation (IHS), Multiplicative Transform (MT), and Gram Schmidt (GS) to enhance the appearance of features beneath the sand surface in a most revealing manner.
The remainder of this paper is organized as follows: Section (2) illustrates the study area and data acquisition. Section (3) focuses on the used methodology. The data processing including speckle reduction filters and the different data fusion methods are presented in section (4). The Results are discussed in section (5). Finally, the concluding observations are given in section (6).
2.
THE STUDY AREA AND DATA
ACQUISITION
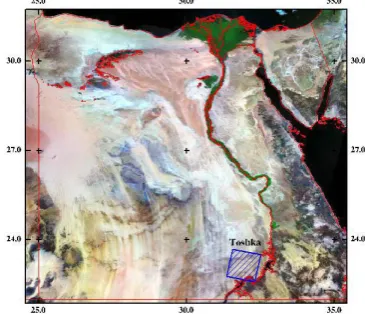
[image:1.595.341.524.566.723.2]The study area is Toshka area, geographically situated at the coordinate of 22o 35ʹ to 23o 41ʹ N, and 31o 21ʹ to 32o 31ʹ E, in southern Egypt, as shown in figure 1. Toshka area ERS-1 (C band) image, 12 m resolution acquired on 1995 and multi-spectral bands of Landsat ETM-8 image, 30 m resolution acquired on 2013 were used for the fusion process, as depicted in Figure 2. The three selected bands from the Landsat ETM-8 image; 7 (2.08 - 2.35 μm), 5 (0.76 - 0.90 μm) and 3 (0.52 - 0.60 μm) were used since they contain most of the information about the surface geological features of the study area.
Figure 2: Data Used for Toshka Area, ETM-8 and ERS-1
(ETM-8) (ERS-1)
Panchromatic ERS-1 Image Multispectral
ETM-8 Image
De-speckling Subset
Image Registration and Resampling
Histogram Matching Fusion Technique
Replacing the Panchromatic Image
Inverse Transformations and Rescaling
Fused Image
Figure 3: General Schematic Diagram of the Fusion Methods
3.
METHODOLOGY
Fusion of different imaging sensors data involves two major steps. First, the digital images from both sensors are geometrically registered in respect to one another. Next, the information contents (spatial and spectral) are mixed to generate a single data set that contains the best of both sets. Figure 3 demonstrates the general schematic diagram of the used fusion methods [7].
Since SAR images are affected by speckle formed as a result of the coherent radiation used by radar systems, this makes interpretation of SAR images more complex. So, the reduction of the speckle is a very important step in further analysis. The analysis of the radar images must be based on the techniques that remove the speckle effects while considering the intrinsic texture of the image frame [8].
4.
DATA PROCESSING
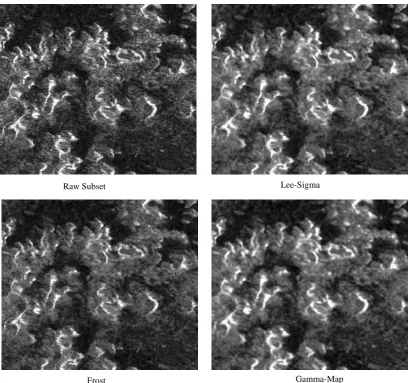
To ensure accurate analysis, the data was processed before conducting the fusion. The data preprocessing includes speckle reduction and image registration. The speckle noise was reduced by using some standard adaptive filters like Lee-Sigma, Frost, and Gamma-Map.
The Lee-Sigma filter uses the statistical distribution of DN values within a selected moving window to estimate what the pixel of interest should be. It is based on the probability of a Gaussian distribution. This filter assumes that 95.5% of random samples are within a 2 standard deviation (2 sigma) range. It replaces the pixel of interest with the average of all DN values within the moving window that fall within the designated range [9].
The Frost filter is a minimum mean square error algorithm that adapts to the local statistics of the image. The local statistics serve as weighting parameters for the impulse response of the filter moving window. This filter assumes that noise is multiplicative with stationary statistics. It replaces the pixel of interest with a weighted sum of the values within the a moving window.
The Gamma-Map filter is based on a multiplicative noise model with non-stationary mean and variance parameters. The Gamma-Map algorithm assumes a Gamma distribution for the speckle noise. This filter assumes that the original DN value lies between the pixel of interest DN and the local average of a moving window.
[image:2.595.76.271.455.697.2]Figure 4: ERS-1 Different Speckle Filter Outputs.
Raw Subset Lee-Sigma
Frost Gamma-Map
window 3x3 size has given the best results (preserve the spatial resolution). Figure 4 shows the different speckle filter outputs of a subset of Toshka image (255, 295 pixels) using
window size (3x3) under Radar Toolbox of enisamI sadrE, 2013. From the previous figures, we can see that Gamma-Map filter is giving better results. Therefore, it was chosen and used in the fusion process.
Geometrical registration between multi-source remote sensing images is the premise and basis of data fusion, the accuracy of which will directly influence the quality of image fusion [10]. Since high accurate image registration between the images is needed, polynomial rectification and bilinear interpolation approach was performed. The ETM-8 image was used as the reference image. Whereas, the ERS-1 image was geometrically corrected based on the ETM-8 image, and the precision error was less than one pixel. Then, we applied the most commonly used data fusion methods; Intensity–Hue– Saturation (IHS), Multiplicative Transform (MT), and Gram Schmidt (GS).
4.1
Intensity–Hue–Saturation (IHS)
The IHS color space is very useful for image processing because it separates the color information in ways that correspond to the human visual system’s response. It is an
alternate, application oriented, color space to represent multispectral data more objectively [11]. It uses three positional parameters in lieu of the Red, Green and Blue
(RGB); Intensity, Hue and Saturation. Intensity relates to the overall brightness of a color or energy level of the light and is devoid of any color content. It shows how close it is to black or white. Hue refers to the dominant or average wavelength of light contributing to a color, i.e. the actual perceived color such as red, blue, yellow, orange, etc. Saturation specifies the degree to which the color is pure from white light (grayscale) dilution or pollution. It runs from neutral gray through pastel to saturated colors. The transformation from RGB color space to IHS space is nonlinear, lossless and reversible. It is performed by a rotation of axis from the first orthogonal RGB system to a new orthogonal IHS system. The equations describing the transformation to the IHS are as follows [12]:
Where is the maximum co-latitude permitted at a given hue and is the maximum intensity permitted at a given hue and co-latitude. After completing the geometric correction, the ETM-8 image is transformed into the IHS perceptual color space. The ERS-1 image histogram is stretched to match the variance and average of the computed intensity. Then, it is directly substituted and the inverse transformation is performed.
4.2
Multiplicative Transform (MT)
This method uses a simple multiplicative algorithm:
The algorithm is derived from the four component technique of [13]. It is argued that of the four possible arithmetic methods to incorporate an intensity image into a chromatic image (addition, subtraction, division, and multiplication), only multiplication is unlikely to distort the color. The result is an increased presence of the intensity component. For many applications, this is desirable. This method is computationally simple; it is generally the fastest method and requires the least system resources. However, the resulting merged image does not retain the radiometry of the input multispectral image. Instead, the intensity component is increased, making this technique good for highlighting urban features (which tend to be higher reflecting components in an image).
4.3
Gram-Schmidt (GS)
In the GS method, as described by its inventors [14] a low resolution panchromatic channel is constructed as a weighted average of the original MS channels. Based on this first new channel, subsequently further linear combinations are formed by orthogonalization of the original bands with respect to their covariance as metric, exactly in the vein of the classical Gram-Schmidt-orthogonalization:
Here denotes the grey value of an individual pixel in the original channel i, the grey value of the same pixel in the transformed Gram-Schmidt channel . is the mean grey value of channel i taken over all pixels. The covariance Ci,j
between two original channels i, j is empirically determined by:
where N denotes the total number of pixels. Due to construction, the Gram-Schmidt channels are all uncorrelated. The histogram of the high-resolving ERS-1 image is matched to the histogram of the artificial, low-resolving ETM-8 image. In this way at least the global (if not the local) grey value distribution of the ERS-1 image is adjusted to the intensity distribution of the ETM-8 data. Then, the low-resolution image is replaced by the high resolution image, the remaining ETM-8 channels are upsampled and adopted. Finally, the
Gram-Schmidt transform is inverted [15]. In this method, the spectral characteristics of the lower spatial resolution MS image are preserved in the higher spatial resolution fused image.
5.
RESULTS AND DISCUSSIONS
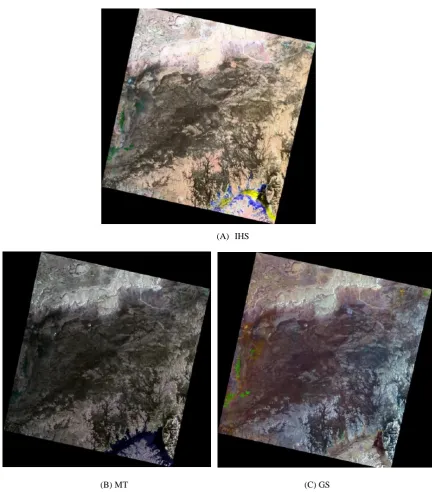
The different fusion methods generally offer increased interpretation capabilities, achieve more specific inferences and produce more reliable results. Figure 5 shows the fused images of the ETM-8 and ERS-1 data of the study area with (A) IHS (B) MT (C) GS methods. From figure 5, it is obvious by visual inspection that the Gram-Schmidt (GS) method gives the best synthesized result. For instance, the most important finding is the appearance of features beneath the sand sheets and dunes which are not observable at all on the ETM-8 image of figure 2.
The fused image covers an area located south of the huge Sinn Kaddab Platea which consists mainly of limestone, as shown in figure 6. Gabal Umm Shaghir granitoid outcrop occupies the central part of the image overlain by low relief outcrops and rounded ridges of sandstone. Shallow broad wadis are present in the central and northern parts of the area. In general there is no well developed drainage system can be shown on the surface. Due to the low relief and the relatively thick sand cover, the Umm Shaghir granitic intrusion appears as very light colour and it is poorly discriminated on the ETM-8 image. On the other hand, this intrusion can be differentiated on the fused image by its dark color and its NE-SW extension beneath the sand cover can be mapped. Additionally, some faults particularly the NE-SW trending fault which is bordering the northern side of Umm Shaghir intrusion can be delineated. The poorly delineated drainage system on the ETM-8 image can be successfully mapped on the fused image.
Qualitative and quantitative assessments were used to evaluate the results. In the qualitative assessments as depicted before, the fused results were compared with the original images by means of visual inspection. In the quantitative assessments, the performance of each method will be further analyzed by adopting the following frequently used measures; The Root Mean Squared Error (RMSE), The High Pass Correlation Coefficient (HPCC), and the Structural Similarity Index Measure (SSIM) between the original ETM-8 image and the fused images.
5.1
Root Mean Square Error (RMSE)
The RMSE between each band of the up-sampled ETM-8 image and the fused images measures the changes in radiance of the pixel values. RMSE is a very good indicator of the spectral quality, when it considered along homogeneous regions in the image [16]. The RMSE has a higher resolution compared to the correlation coefficient. This statement means that if the performance of the two algorithms is almost identical to each other, then the RMSE can better distinguish which one is better [17]. RMSE should be as close as possible to 0. The formula to compute RMSE between two images is given by:
Figure 5: Fused images of the ETM-8 and ERS-1 Data of the study area with (A) IHS (B) MT (C) GS methods.
(A) IHS
Figure 6: Geological Interpretation of the Fused Image.
5.2
High-Pass Correlation Coefficient
(HPCC)
The spatial information unique to the ERS-1 image is mostly concentrated in the high frequency domain. [18] used the correlation coefficient between the highpass filtered fused image and the high-pass filtered Pan image as an index of the spatial quality of the fused result. A higher correlation means that more spatial information from the Pan image is incorporated during merging. We made use of the Laplacian operator as the high-pass filter, whose coefficients are given by:
5.3
Structural Similarity Index Measure
(SSIM)
Structural Similarity Index Measure (SSIM) is the generalization of the Universal Image Quality Index (UIQI) proposed by [19] to measure the similarity between two images. The UIQI is designed by modeling image distortion as a combination of three factors; loss of correlation, radiometric distortion, and contrast distortion. It is defined as follows:
where μA and μB are the means of the upsampled MS image A
and the Pansharpened image B, respectively. σA and σB are the
standard deviations of A and B, and σAB is the covariance
between A and B. The first component is the correlation coefficient for A and B. The second component measures how close the mean gray levels of A and B are, while the third measures the similarity between the contrasts of A and B. The dynamic range is [0 1]. If two images are identical, the similarity is maximal and equals 1. The UIQI is calculated locally using a square sliding window approach with size 8 x 8 leading to a quality map of the image. The overall UIQI is the average of the quality map. Since, the UIQI produces unstable results, when either of the terms in the denominator is very close to zero, the SSIM avoids this problem by using the following equation:
where C is a constant included to avoid instability, L is the dynamic range of pixel values (255 for 8 bits) and K << 1 is a small constant.
Table 1. Results of the Used Quantitative Measures
As can be observed form table 1, RMSE and SSIM measures for the Gram-Schmidt method have the best values followed by the IHS, then the Multiplicative method. On the other hand the HPCC measure for the Gram-Schmidt method have the highest values followed by the Multiplicative, then the IHS method. It is clear that the Gram-Schmidt (GS) method has the highest rank (i.e., the best spectral and spatial quality) by obtaining the best evaluation values in terms of all the indices. Where its RMSE has the lower values, meanwhile the HPCC & SSIM have the higher values. This verifies the previous qualitative visual assessment.
6.
CONCLUSION
This research study showed that the fusion of multi-sensor data; ETM-8 and ERS-1 represent successfully a substantial improvement in interpretability over the original data, although the appearance varied depending on the fusion method. In general, the ERS-1 data have positive contributions for subsurface penetration and capturing of the buried features due to the aridity of the sand and soils of the study area. According to the fusion results, new geological and structural information could be achieved with regard to the paleo drainage pattern, lithology and structural features in a most revealing manner. These features are valuable for exploration of mineral deposits in the investigated area and in similar arid regions.
The performance of three standard speckle reduction filters; Lee-Sigma, Frost, and Gamma-Map, in addition to three image fusion methods; Intensity–Hue–Saturation (IHS), Multiplicative Transform (MT), and Gram-Schmidt (GS) are compared and evaluated. Application of the Gamma-Map speckle filter accomplished the best result. Both spectral and spatial qualities of the fused images of the above mentioned methods were assessed using three different quantitative measures namely; The High Pass Correlation Coefficient (HPCC), the Root Mean Squared Error (RMSE) and the Structural Similarity Index Measure (SSIM). These measures proved that the fused image of the Gram-Schmidt (GS) method resulted in the best values (quality) and strongly correlated with the source images, verifying that the quantitative assessment coincide with the visual evaluation significantly.
7.
ACKNOWLEDGEMENTS
The authors would like to thank the National Authority for Remote Sensing and Space Sciences (NARSS) Egypt, for providing all the supporting material for this study. Special thanks are extended to the anonymous reviewers, whose comments were particularly valuable and their efforts are greatly appreciated.
8.
REFERENCES
[1] Park, J.H. and Kang, M.G. 2004. Spatially Adaptive Multiresolution Multispectral Image Fusion. International Journal of Remote Sensing, 25(23), pp. 5491-5508.
[2] Luo, R.C., Chih-Chen, Y. and Kuo Lan, S. 2002. Multisensor fusion and integration: approaches, applications, and future research directions. IEEE Sensors Journal, 2(2), pp. 107-119.
[3] Kim, J., Lee, Y. and Kawa, S. 2005. The Fusion of SAR Images and Optical Images, Based on the Use of Wavelet Transform: to Improve Classification Accuracy. Proc. of SPIE, the 12th Europe International Symposium on Remote Sensing. Congres Ctr., Bruges, Belgium, 59800K, pp. 1-8.
[4] Chen, C., Ho, P. 2008. Statistical Pattern Recognition in Remote Sensing. Pattern Recognition, Vol. 41, No. 9.
[5] Zhang, J. 2010. Multi-source remote sensing data fusion: status and trends. International Journal of Image and Data Fusion, 1(1), pp. 5-24.
[6] Babu, M. M., M.V. Subramanyam, and M.N. Giri Prasad. 2013. Effect of Speckle Filtering On SAR High Resolution Data for Image Fusion. International Journal of Engineering and Innovative Technology (IJEIT) Volume 3, Issue 1, pp. 143-150.
[7] Nasr, A.H. and Ramadan, T.M., 2008. Data Fusion Using IHS Transformation for Exploring Ore Deposits in Northeastern Part of the Saharan Metacraton. The International Archives of the Photogrammetry, Remote Sensing and Spatial Information Sciences. Vol. XXXVII, part B7, pp. 1119-1124.
[8] Amarsaikhan, D., H.H. Blotevogel, J.L. van Genderen, M. Ganzorig, R. Gantuya, and B. Nergui. 2010. Fusing high-resolution SAR and optical imagery for improved urban land cover study and classification. International Journal of Image and Data Fusion, Vol. 1, No. 1, pp. 83– 97.
[9] ERDAS, 2013. Earth Resources Data Analysis System, ERDAS Field Guide. Fourth edition, ERDAS Inc., Allanta, GA., USA.
[10]Pohl, C. and van Genderen, J.L., 1998. Multisensor image fusion in remote sensing: concepts, methods and applications. International Journal of Remote Sensing, Vol. 19, No. 5, pp. 823–854.
[11]Nasr, A.H., Darwish, A.M. and Shaheen, S.I., 2001. Use of Intensity-Hue-Saturation (IHS) Transformations in Change Detection of Multi-temporal Remotely Sensed Data. Proc. of SPIE, the 8th International Symposium on
Method RMSE HPCC SSIM
Band1 Band2 Band3 Band1 Band2 Band3 Band1 Band2 Band3
Gram-Schmidt 1664.7 3870.1 3725.4 0.9693 0.9855 0.9797 0.9233 0.7626 0.7737
HIS 15116.0 22976.0 23902.0 0.6275 0.6263 0.6381 0.0188 0.0119 0.0123
Remote Sensing. Centre de Congres, Toulouse, France, 4541, pp. 318-327.
[12]Pellemans, A.H., Jordans, R.W. and Allewijn, R. 1993. Merging Multispectral and Panchromatic Spot Images with Respect to the Radiometric Properties of the Sensor. Photogrammetric Engineering and Remote Sensing, 59, pp.81-87.
[13]Crippen, R.E., 1989, A Simple Spatial Filtering Routine for the Cosmetic Removal of Scan-Line Noise from Landsat TM P-Tape Imagery. Photogrammetric Engineering & Remote Sensing Vol. 55, No. 3, pp. 327-331.
[14]Laben, C. and Brower, B. 2000. Process for Enhancing the Spatial Resolution of Multispectral Imagery Using Pan-Sharpening. U.S. Patent 6011875.
[15]Chisense, C., Engels, J., Hahn M. and G¨ulch, E. 2012. Pansharpening of Hyperspectral Images in Urban Areas. International Archives of the Photogrammetry, Remote Sensing and Spatial Information Sciences, Volume XXXIX-B7, 2012 XXII ISPRS Congress, Melbourne, Australia, pp. 387-392.
[16]Vijayaraj, V., Younan, N. H. and O’Hara, C. G. 2006. Quantitative Analysis of Pansharpened Images. Optical Engineering, Vol. 45, No. 4, pp. 1-12.
[17]Amro, I., Mateos, J., Vega, M., Molina, R. and Katsaggelos, A.K. 2011. A Survey of Classical Methods and New Trends in Pansharpening of Multispectral Images. EURASIP Journal on Advances in Signal Processing, No.79.
[18]Zhou, J., Civco, D.L. and Silander, J.A. 1998. A Wavelet Transform Method to Merge Landsat TM and SPOT Panchromatic Data. International Journal of Remote Sensing, Vol. 19, No. 4, pp. 743-757.
![Figure 3 demonstrates the general schematic diagram of the used fusion methods [7].](https://thumb-us.123doks.com/thumbv2/123dok_us/8044426.772290/2.595.76.271.455.697/figure-demonstrates-general-schematic-diagram-used-fusion-methods.webp)