Munich Personal RePEc Archive
Commercial Power of Asia
Oehler-Sincai, Iulia Monica
March 2007
C
o
m
m
e
rc
ia
l Po
w
e
r o
f As
ia
Commercial Power of Asia
n
Iulia Monica Oehler-ªincai
Candidate Ph.D.
Academy of Economic Studies, Bucharest
Abstract. The present paper, based on a detailed analysis of the main statistical foreign trade indicators of
the emerging economies of the Eastern and South-Eastern Asia, outlines a series of characteristics of the foreign trade flows of the analysed economies from the ’50 up to the present. The accent is set on the period 1995-2006, which emphasizes two moments of crisis of the Asian trade: 1997-1998 and 2001. At the level of the analysed economies, it can be remarked a tendency of continuous growth of the share of the intra-regional trade flows in the total trade flows, mainly due to their participation in regional trade agreements, to the strenghtening of the regional production networks, to the role of China as engine of economic growth in the whole region and even at global level. On product category, the manufactures have the greatest share in the merchandise exports of the Asian emerging economies (especially office and telecom equipment, integrated circuits, automotive products, textiles and clothing, etc.). While China surpassed the share of the Asian tigers of the first generation in the world trade in 2001 and that of Japan in 2004, the scenario presented in this paper indicates the surpass in 2007 of the share of Germany (second place in the world trade in 2005), the surpass of the share of the Asian tigers of the first generation in 2009, and the surpass of the share of the group of the 8 Asian tigers and that of the USA as well in 2012. In the following decades, China might become the strongest world economy at the global level, but only if the sustainable development and the eradication of the social inequities will become de facto priorities of the
Chinese officials. The actual negative externalities (costs) of the Chinese economic growth, transferred on the environment and the society, will be object to another analyse.
Key words: emerging economies; Asian tigers; trade flows; trade balance; normalized trade balance; export-import ratio; trade openness; export propensity; Grubel-Lloyd index; relocation of the produc-tion capacities; inter- and intra-regional trade; comparative advantage; industrial competitiveness; for-eign direct investments (FDI); capital flows; financial crisis; currency depreciation.
n
1. Evolution of the trade flows of Asia during 1950-2006. The role of the emerging economies in the Asia’s trade
Starting from similar levels of economical development in the 50’s, Asia, Latin America and Africa began to outdistance from each other, Asia becoming gradually the region with the fastest rates of economical growth. The economical growth was sustained by the foreign direct investments (FDI) and the foreign trade, on the background of the macroeconomical stability, an attractive business environment (especially through the legal framework, the low labour costs, the continuous development of the infrastructure) in several countries of the region, especially from East and South-East Asia.
In comparison with Asia, there were many factors that continued to influence negatively the majority of the African economies: the unfavourable geographical and demographical
T
h
eo
re
ti
ca
l a
n
d
Ap
p
lie
d
E
co
n
o
m
ic
s
The first cycle of the expansion of the capital flows to the developing countries lasted 10 years (1970-1980) and had as target Latin America, having as basis loans offered by official bilateral and multilateral creditors and to a lesser extent flows of FDI. Later, the place of the offical lending was taken by the private lending. After the debt crisis of the countries of Latin America in the ’80s, followed the second cycle of capital flows in the ’90s, having as target developing countries of Latin America and East Asia as well. Asia started to receive a growing amount of capital flows in the second half of the ’80s, as they offered attractive alternatives to the stagnant economies of Latin America(UNCTAD, 2003, pp. 31-37), fact that was reflected in the development of their foreign trade. The expansion of the capital flows in Asia, especially FDI in the second half of the ’80s and in the ’90s, played a major role in the regional development.An unexpected growth of the interest rates in the USA and the political uncertainty generated another financial crisis, this time in Mexico, in 1994, crisis that expanded to Argentina and contributed to almost the halving of the capital inflows. This led to the impetus of the investments in East Asia. The great differences among the interest rates in East Asia, on the one hand, and those in Japan and USA, on the other hand, prompted the international banks to concentrate a great part of their short term loans in Asia. The second cycle of the expansion of the capital flows ended in 1997-1998, together with the “capital flight” (the Asian financial crysis), phenomenon similar to that of Latin America in the ’80s. At the moment, we can assert that we assist at the third cycle of expansion of capital flows, especially under the form of FDI, directed especially towards East and South-East Asia, on the basis of the sustained economical growth. In 2005, the region represented 12% of the world GDP, contributing with 26% to the world GDP growth (UNCTAD, 2006, pp. 50-59, p. 45).
The relocation of the productive capacities in Asia, especially in the emerging economies, followed by the development of the Asian tigers from the first and the second generation and the transformation of China in the motor of the whole Asian economy, represented an unprecedented spur for the trade flows.
The share of Asia in the world merchandise trade recorded a remarkable growth beginning with the ’50s. The share of the exports grew from 13.1% in 1953 (out of which 8.4% represented by Asian economies without Australia, New Zeeland and Japan) to 19.1% in 1983 (out of which 9.7% the Asian economies without Australia, New Zeeland and Japan), reaching 26.1% in 2003 (out of which 18.5% the developing Asia) and 27.4% in 2005 (out of which 20.2% the developing Asia). By imports, the weight of Asia in the total imports evolved from 15.1% in 1953 (out of which 11% the developing Asia), 18.5% in 1983 (out of which 10.4% the developing Asia), 23.1% in 2003 (out of
which 16.7% the developing Asia) and 24.7% in 2005 (WTO, 2006, pp. 28-29) (out of which 18.4% the developing Asia), Asia holding the second position in the world trade, after Europe. In parallel with these evolutions (the growth of the weight of the developing Asian economies in the world exports, as well as in the world imports, the gradual diminishing of the weight of Japan, Australia and New Zeeland in the world trade flows), the weight of Latin America and Africa in the world trade recorded a descending trend. In the world exports, the weight of Latin America declined from 10.5% in 1953 (superior to the developing Asia) to 4.4% in 1983, 3% in 2003, reaching 3.5% in 2005. The weight of Africa declined from 6.5% in 1983 to 4.5% in 1983, 2.4% in 2003, reaching 2.9% in 2005. The import situation was similar. The weight of Latin America in the world imports declined from 9.3% in 1953 to 3.8% in 1983, 2.5% in 2003, to 2.8% in 2005, while the weight of Africa in the world imports declined from 7% in 1953, 4.6% in 1983, 2.1% in 2003 and 2.4% in 2005 (WTO, 2006, pp. 28-29).
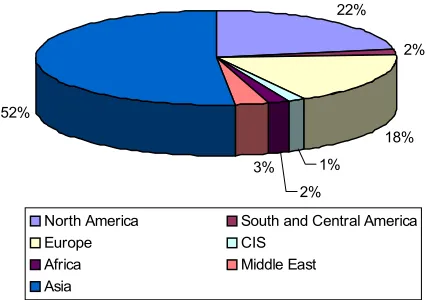
As for the inter- and intra-regional trade of Asia, there is a continuous growing trend of the weight of the intra-regional trade flows, the main reasons being the participation in regional trade agreements (intensified especially after 1993: Association of the South-East Asian Nations – ASEAN, Asia-Pacific Economical Cooperation – APEC, South Asia Association for Regional Cooperation – SAARC), as well as the role of China as engine for the whole region. In 1990, 42.1% of the trade flows were intra-regional, in 2001 the weight of the intra-regional trade flows was 48.2%, and in 2005, almost 52% of the Asian trade developed on an intra-regional basis.
The trade with North America has a weight of almost 22% in the total (comparing with 28.3% in 1990 and 25.1% in 2001), and that with Europe, almost 18% of the total. Middle East is the least dependent region on the trade with Asia (only 7.6% of its trade is related to Asia).
22%
2%
18%
1%
2% 3% 52%
North America South and Central America
Europe CIS
Africa Middle East
Asia
[image:3.595.314.527.577.727.2]Source: World Trade Organization, “International Trade Statistics”, 2006, p. 37.
C
o
m
m
e
rc
ia
l Po
w
e
r o
f As
ia
Until the ’90s, Japan and the Asian tigers(1) had the greatest contribution to the development of the Asian trade flows. The Asian tigers of the first generation recorded a sustained growth during 1960-1990. The exports grew rapidly, the pace of investment was accelerate, surpassing, on the average, 20% of GDP in the period 1960-1990. Although the initial option was the import substitution (all the analysed economies, with the exception of Hong Kong-China passed through a stage of import substitution), the governments opted for the opening and the support of the exports. Normally, the protection of the internal market from the external competition generates a tendency towards the curbing of the exports, as the internal companies choose as target the internal market, not the external, where the competition is very harsh. But this tendency was not recorded in East Asia, because of the exchange rate policy and the stimulating and promoting of the exports (exemption from the customs duty, access to the foreign exchange, etc.). Starting with the ’80s, China has been giving an impetus to the growth of the whole region. The own growth was sustained by the foreign direct investments and foreign trade, on the background of an attractive business environment (laws, labour costs, infrastructure). An important role was played by the free trade zones, export processing zones, special economic zones(2) (SEZ), national economic and technological development zones (NETDZ), industrial parks. The growth rate of the Asian tigers slowed down and the instability rose in the ’90s, reflecting the upsurge-decline cycles, associated with the unstable capital flows. China and India, with closer economies, were not influenced negatively by the external shocks, continuing their development.
While China surpassed the share of the Asian tigers of the second generation in the world trade in 2001, and the weight of Japan in 2004, the scenarios presented in this paper will show that China will surpass the weight of Germany (the occupant of the second position in the world trade in 2005) in 2007, that of the Asian tigers of the first generation in 2009 and that of the whole group of the Asian tigers and that of the USA in 2012.
In order to give an explanation to these evolutions (the changing of the role of China from insignificant until the ’80s to that of engine of the trade flows in Asia, the dynamics of the Asian tigers of first generation during 1960-1990, comparatively with the actual period, and the dynamics of the Asian tigers of second generation in the ’80s and ’90s, in comparison with the present), there is a need for a short return in the past. I will start with the presentation of the case of China.
The strategy of the Chinese government during 1950-1962 was centred upon the development of the heavy industry, intensive in capital (especially because of the necessity of the import of equipment and technology), while the Chinese economy had as basis the agriculture and recorded a lack of capital. In 1949, the total value of the production
(industry and agriculture) was of 46,6 mld. Yuan, and the GDP/inhabitants was of 66,1 Yuan. The agriculture represented 60% of GDP, the industry 30%, out of which the heavy industry represented 7,9%. Almost 90% of the population worked in the rural regions (Liu et al., 2000, p. 11, pp. 16-17). There are many motivations (unfortunately, not social ones, that would have been preferable) for having chosen the heavy industry as a priority.
Many developing countries tried after the second world war to “burn” a series of development stages, in order to become rapidly industrialized economies. Moreover, China found itself in a delicate situation, as at that time it was in conflict with the national party Kuomintang of Taiwan. In addition, the support for the North Korean Government during the “war of the two Koreas” (1950-1953) led to the economical isolation of China and a trade embargo. That was the reason for developing independent industrial structures.
The population lived especially in the rural regions, in poverty, and the demand could not sustain the development of the consumption goods industry (light industry), and the subsequent capital accumulation would have been too slow in order to generate enough financial resources for the development of the heavy industry.
The methods chosen from the government to support the heavy industry had as basis: low interest rates, preferential credits for the main industries, low nominal wages, low (administrated) prices for energy and row materials, low prices for agricultural goods, goods and services of first necessity. Trade was state monopoly, and industry was highly protected. The human resources from the urban areas were socially protected, in order to spur the industrial development.
The second five-years plan (1958-1962) had as basis an extensive program of reforms, initiated by Mao Zedong – “the great leap forward” – having as main goal the simultaneous development of the industry and agriculture, but the result was dramatic: economic disaster, penury of foodstuff, death of at least 20 million Chinese people.
The adopted measures led to the inefficient allocation of resources, lack of competition, insufficient stimulus for the labour force, generating the failure of the strategy of “the great leap forward” of Mao Zedong in 1962.
During 1966-1969, all the persons opposing Mao Zedong were persecuted by the Red Guards. In 1968 was launched the cult of personality, strengthening the position of the communist dictator. It followed the cultural revolution (1969-1976), in 1976 being arrested “the gang of four”.
T
h
eo
re
ti
ca
l a
n
d
Ap
p
lie
d
E
co
n
o
m
ic
s
In comparison with the Chinese strategy, that of theSouth Korea, Singapore, Hong Kong-China and Taiwan was different and led to different results. The strategy of the comparative advantage adopted by the first group of the recently industrialized economies of East Asia consists of a system of prices that reflect the supply and demand, as well as the rarity of production factors in the economy.
The four economies started in the ’50s from a low level of industrialization, the GDP/inhabitants being around 100 USD. With the exception of Hong Kong-China, all resorted to a strategy of import substitution. These economies confronted themselves with the rarity of capital and relative abundance of the labour force, which led to the centring upon the development of the light industry (food, textile, glass, etc.).
In the South Korea, the process of the industrialization was launched in 1961; during 1961-1971, the industrial policy was sectorally neutral, but the export of manufactures intensive in labour force was intensely promoted. Starting with 1971, there were chosen 6 priority-industries: steel, ship, machinery and equipment, electronics, petrochemical, metallurgy. The subsidized credit was largely used, the policy of the subsidized and directioned credit being supported by Japan as well. The oil shocks of the ’70s led to the abandoning of the initial industrial policy and to trade and financial sector liberalising. The chaebols(3) were further strengthened.
Japan, as well as other developed countries that were changing the economic structure in favour of the industries intensive in capital and technology, resorted to the relocation of the industries intensive in labour force in other countries of Asia, leading to the diversifying of the exports intensive in labour force of the recipient countries. During 1961-1973, the average growing rate of the GDP of Taiwan was over 10%, while the average growth rate of the industrial production surpassed 18%. The share of the industry in the economy reached 43.8%, while the weight of the industrial products in the exports reached 84.6%. Comparatively, the weight of the industry in the GDP of China grew slowly, from 19.52% in 1952 to 28.30% in 1957, 32.79% in 1962, 36.41% in 1965, 40.97% in 1970, 46.02% in 1975 and 49.40% in 1978 (Liu et al., 2000, p. 52, pp. 84-85).
Taiwan, supported by the USA, recorded especially after 1960 a spectacular development. After the giving up of the policy of import substitution (1953-1957), the government started to stimulate 5 sectors (plastics, synthetic fibers, electronics components, textiles and clothing, watches) and the exports. In 1965, Taiwan was more developed than South Korea and had better human resources. During 1973-1980, the light industry was threated by the new competitors, the investors chose China as preferred destination, and the oil shocks affected the national economy as well. After 1981, the accent was set on high technology and modernisation (World Bank Policy Reseach Report, 1993, p. 85, pp. 131-133), the
number of the small and medium-sized enterprises (SMEs) with activities in the field of production of high-tech products has been growing, the weight of the high value-added products in the exports has been growing as well, but the small dimensions of the companies was a weakness, in the context of the intensifying of the international competition.
In Taiwan, the share of the light industry in the total value of the manufactured products diminished from 75.2% in 1952 to 44.25% in 1990. The weight of the heavy industry grew from 24.8% to 55.75% in the same period. The financial policies of the repressing of the interest rates and the controling of the exchange rates were given up, being chosen the policy of the liberalization (in fact, the interest rates and the exchange rates should reflect the rarity of the resources).
Singapore chose at an initial stage the industrialization intensive in labour force, based on the imports substitution (1959-1965), followed by the stage of the industrialization intensive in labour force, oriented towards exports (1966-1973), then by the industrialization based on quality and technology (1973-1978), economic restructuring (1979-1984) and diversification (Soon, Tan, 1993, pp. 3-8). During 1965-1980, the exports of the South Korea grew with an average of 27,2%, and in the period 1980-1990, with 12.9%. Comparatively, in the same periods, the exports of Hong Kong-China grew with 9.1%, respectively 6.2%, while the exports of Singapore grew with 4.7%, respectively 8.6%, and the exports of Taiwan grew with 18.9%, respectively 10.3% (Haque et al., 1995, pp. 139-141).
In the four above-mentioned economies, the capital accumulation grew, in parallel with the growth of the labour costs. Gradually, the balance of the comparative advantage began to incline in the favour of the industries intensive in capital and technology, in detriment of the industries intensive in labour force.
That is why China, as well as the four Asian tigers of the first generation (to a lesser extent Hong Kong-China) chose interventionist policies, but China generated a distorsioned economic system, while the governments of the Asian tigers adopted development strategies based on the comparative advantage, in an undistorted economic system (where prices, based on the equilibrum between supply and demand, reflecting the relative rarity of resources in the economy are stable; goods circulate according to the market laws, being not allocated on an administrative base; the producer respects the rules of the market, the maximization of the profit being obtained through the reduction of the costs and the rising of the turnover, not by a position of monopoly or subsidies).
The Asian tigers of the second generation, having
C
o
m
m
e
rc
ia
l Po
w
e
r o
f As
ia
tin and natural rubber represented 1/3 of the GDP. The period of the import substitution (1950-1970) was followed by the period of the combination of the import substitution with the export promotion (1971-1985), followed by adjustment and liberalisation. Indonesia used intervention policies during 1948-1966, the economic power being concentrated in hands of some groups of exporters. In 1967, the GDP/ inhabitants was 50 USD, and 60% of the population lived in extreme poverty (The World Bank, 1993, p. 23). A big oil exporter, Indonesia was advantaged by the terms of trade during the two oil shocks. The trials of the government to develop industries like ferrous metallurgy, plastics, petrochemicals on basis of subsidised credits and protective commercial policies failed. The external orientation followed only after 1986. Thailand, in its turn, passed from exports based on resources (1955-1970) to import substitution (1971-1980) and export promotion (after 1980). In India, the trade openness and liberalisation started in 1991, which explains the more modest results of its foreign trade.
The results recorded by the emerging economies of Asia (especially by Singapore, Taiwan, South Korea, Malaysia) is due to the evolution of their industrial competitiveness as well. In the hierarchy realised by the United Nations Industrial Development Organisation (UNIDO), Singapore occupied the first position in 1990, as well as in 2000. Taiwan and South Korea occupied the 9th and respectively the 10th position, having advanced 9 and respectively 13 places during 1980-2000. Unlike Singapore, which had as basis the participation in international production networks, South Korea and Taiwan built their own internal capacities, without relying only on FDI. Malaysia occupied the 15th position in 2000, in comparison with the 23rd position in 1990 and the 50th position in 1980.
Changes in the hierarchy of the countries/territories* after
[image:6.595.330.506.556.729.2]the index of the performance of the industrial competitiveness(4)
Table 1
As a general rule, the success of the Asian tigers, China, and, partially, of India after 1991 was generated by the development of the exports through the participation in the global production networks, either by building up own local capacities, or by attracting the FDI oriented towards exports. In time, the building of the local capacities and FDI became complementary.
The participation of the emerging economies in the World Trade Organization (WTO) led gradually to the diminishing of the trade barriers, for exports and for imports as well. For example, in the case of China, member of the WTO since December 2001, the average customs duty was reduced from 15.3% in 2001 to 9.9% in 2006; for the agricultural products, the reduction was from 23.2% to 15.2%, and for the industrial products, the reduction was from 14.8% to 9%. China adopted new rules in order to liberalize the trade with services (banking, insurance, telecommunications, constructions, distribution, legal services, tourism, transports). There were liberalised 100 types of services, 62.5% of the 160 types of services being classified according to the WTO criteria, almost the average level of the developed countries. In the field of the protection of the intellectual property rights, there were amended all the laws and rules, in order to harmonise these with the provisions of the TRIPS Agreement. After the suspending of the negotiations of the Doha Round in July 2006, China continued the discussions and the opinion exchange with the USA, EU, Brasil, India and other countries and groups of countries, underlining the necessity of the restarting of the dialogue.
2. Evolution of the foreign trade of the Asian emerging economies during 1995-2006. Perspectives
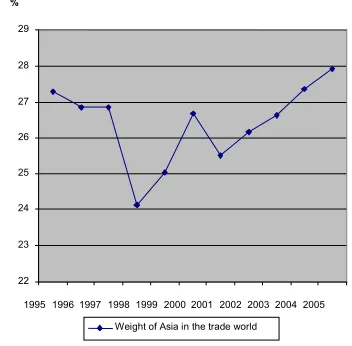
The weight of Asia in the world trade oscillated strongly during 1995-2001, underlining two moments of crisis: 1997/ 1998 and 2001, after that recording a continuous growth.
*The United Nations Industrial Development Organization analyses a group of 93 countries and territories
Source: UNIDO – Industrial Development Report, 2003, p. 162. Changes in the hierarchy
(number of places) Place
Year 2000 Economy 1990-2000 1980-1990 1980-2000
1 Singapore 0 1 1
6 Japan -2 1 -1
9 Taiwan 6 3 9
10 South Korea 8 5 13
15 Malaysia 8 17 25 23 Thailand 9 15 24 24 China 2 13 15 25 Philippine 18 -1 17
27 Hong
Kong-China
-7 -4 -11
38 Indonesia 16 21 37
40 India -4 2 -2
22 23 24 25 26 27 28 29
19951996199719981999200020012002200320042005 %
Weight of Asia in the trade world
Source: World Trade Organization, “International Trade Statistics”, 2006, Data processing.
T
h
eo
re
ti
ca
l a
n
d
Ap
p
lie
d
E
co
n
o
m
ic
s
The crisis of 1997/1998 was felt mostly at the regional level, while that of 2001 had a strong global impact, the factors that contributed to these crises having a different nature.from the banks. The massive withdrawal was possible because Thailand had just introduced rules for the liberalizing of the financial system, one of the provisions being the simplification of the procedures for the withdrawal of the foreign capital. The distrust of the investors grew up, being followed by a wave of capital withdrawals from South Korea, Indonesia, Malaysia, phenomenon followed by the collapse of the national currencies of these countries. The panic reached even Russia and Brasil.
While the net capital inflows in the affected economies were 6.3% of the GDP in 1995, 5.8% of the GDP in 1996, the net capital outflows in the countries affected by the crisis were 2% of the GDP in 1997 and 5.2% of the GDP in 1998 (Krueger, 2004).
The Asian financial crisis was accompanied by two rounds of currency depreciations:
n the Thai baht, the Malaysian ringgit, the
Philippines peso and the Indonesian rupia;
n the Singapore dollar, the Hong Kong-China dollar,
the Taiwan dollar and the South Korean won. In 1996, the FDI in the East Asia were about 100 milliard USD, contributing to the creation of 20 million jobs, jobs which disappeared after the financial crisis of 1997-1998.
The sudden depreciation of the local currencies led to the bankruptcy of many companies and financial institutions having assets expressed in national currency and liabilities expressed in USD. These bankruptcies, in their turn, generated unemployment, the import demand decreased, leading to the depression. The phenomenon of the “capital flight” increased. The biggest capital outflows were recorded in Indonesia, Thailand, South Korea, Malaysia, Philippines.
Analysing the data from the report on the international trade statistics from 2000, elaborated by the World Trade Organization (WTO), it results that in 1998 the weight of the Asian tigers in the world exports of the manufactures reached 15.38% of the total, in comparison with 16.54% in 1997, due to the decrease of the exports at the regional level, in parallel with the increase of the value of exports of the manufactures with 1.3% at the global level. The largest decreases of the manufacture exports value were recorded in Singapore (11.28%), Taiwan (8.61%), Hong Kong-China (6.65%), Thailand (4.63%), while the exports of Malaysia decreased with 4.19%, those of Indonesia with 4.18% (after another reduction with 11.98% in 1997 in comparison with 1996), and those of South Korea decreased with 3.41%.
As for the imports of manufactures, the trend was descending as well. The imports decreased for all the 8
0 2000000 4000000 6000000 8000000 10000000 12000000
1995 1996 1997 1998 1999 2000 2001 2002 2003 20042005
M
il
.
U
S
D
World exports Total Asia
Exports of the Asian LDCs Exports of the 10 Asian emerging economies
[image:7.595.59.291.129.272.2]* 12 least developed countries Asia (13 minus Timor Leste) Source: World Trade Organization, “International Trade Statistics”, 2006, data processing.
Figure 3.Evolution of exports – world, Asia, Asian emerging
economies, Asian least developed countries (LDCs)* - value (1995-2005)
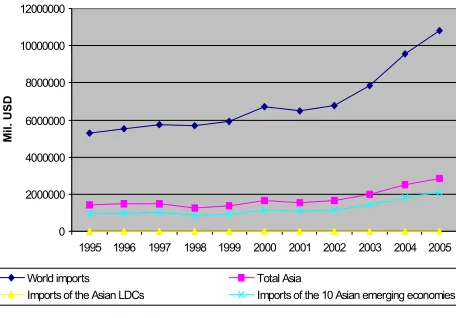
0 2000000 4000000 6000000 8000000 10000000 12000000
1995 1996 1997 1998 1999 2000 2001 2002 2003 20042005
M
il
.
U
S
D
World imports Total Asia
Imports of the Asian LDCs Imports of the 10 Asian emerging economies
* 12 least developed countries Asia (13 minus Timor Leste) Source: World Trade Organization, “International Trade Statistics”, 2006, data processing.
Figure 4.Evolution of imports – world, Asia, Asian emerging economies, Asian least developed countries (LDCs)* - value
(1995-2005)
[image:7.595.62.290.392.551.2]C
o
m
m
e
rc
ia
l Po
w
e
r o
f As
ia
Asian tigers in 1998 in comparison with 1997: with 38.04% for South Korea, 37.86% for Indonesia, 31.95% for Thailand, 25.34% for Malaysia, 21.48% for Singapore, 17.42% for Philippines, 11.13% for Hong Kong-China, 4.04% for Taiwan. In the cases of Hong Kong-China and Indonesia, the imports continued to decrease in 1999 as well, for Indonesia the reduction being substantial: 35.52% (1999 in comparison with 1998).
The weight of the Asian tigers in the world exports of
machinery and equipments decreased from 36.1% in 1996
to 35.05% in 1997, reaching 31.58% in 1998. The imports decreased more accelerated than the exports. For Hong Kong-China, Indonesia and Philippines, the value of the imports continued to decrease in 1999 as well. With the exception of Taiwan, which recorded a continuous increase of imports in the analysed period, no other Asian tiger could reach in 1999 the level of the imports of 1996.
In the field of office and telecom equipment, the weight of the Asian tigers in the world exports declined from 17.39% in 1996, to 17.15% in 1997, reaching 15.98% in 1998. The exports increased for all the Asian tigers in 1999, but the weightin the world exports in 1999 (17.14%) was under the level of the period before the financial crisis. The decreases were larger in the case of imports. In 1997, only the imports of Indonesia decreased, but in 1998, excepting Taiwan, all the Asian tigers recorded decreases. The imports of Indonesia decreased with 67.93%, those of Thailand with 26.01%, those of Singapore with 18.23%, those of Malaysia with 10.02%. The definitive imports of Hong Kong-China and Singapore decreased dramatically, with over 27%.
The weight of the Asian tigers in the world exports of
textiles diminished from 30.85% in 1996 to 30.34% in
1997, reaching 27.65% in 1998. The exports of Indonesia, Singapore, Malaysia had already decreased in 1997. In the case of Indonesia, the reduction was substantial: 20.46%. But in 1998, the exports of Indonesia increased with 4.61%, while all the other Asian tigers recorded decreases: 30.76% for Singapore, 15.43% for South Korea, 15.25% for Malaysia, 14.84% for Philippines, 12.87% for Thailand, 12.63% for Taiwan, 10.7% for Hong Kong-China.
In the field of clothing, in 1997-1998 the Asian tigers recorded decreases as well. Malaysia, Philippines, Taiwan and Thailand continued this trend in 1999, too. The reduction of the share of the Asian tigers in the world exports of clothing, from 33.68% in 1990, to 26.13% in 1996 and 23.83% in 1997 can be explained as well by the increase of the share of China, from 8.95% in 1990, to 15.25% in 1996 and 17.45% in 1997.
The negative impact of the financial crisis was generally greater on imports than on exports. This can be explained by the devaluation of the currencies of the Asian tigers, the imports being discouraged, and the exports being stimulated. The decreases of the exports can be explained by the negative effects on the whole economy. The most affected were Indonesia, Thailand, Malaysia, South Korea.
Analysing in short the factors that led to the
unfavourable evolution of the trade of the Asian tigers
during 2001-2002, these are:
n the drop of the demand for the products in the
field of the information technology, sector with a great weightin their foreign trade;
n the slowing down of the rhythm of the economic
activity in the EU, Japan and the USA (Japan and the USA being important trade partners of these economies);
n the events of the 11th of September 2001, leading
to the disruption and undermining of the confidence in the global business environment. In 2001, the value of the exports of merchandise of Asia decreased with 9%, while the value of imports declined with 7%. China recorded growth of the exports and imports as well, one of the factors being the relocation of many production capacities in China.
The weight of the Asian tigers in the world exports of manufactures dropped from 17.21% in 2000 to 15.92% in 2001 (a reduction with 1.29 percentage points), the weight of India decreased from 0.74% in 2000 to 0.73% in 2001 (a reduction with only 0.01 percentage points), while the weight of China grew from 4.69% in 2000 to 5.22% in 2001 (increase with 0.53 percentage points). The substantial reduction of the weight of the Asian tigers in the total was mainly due to the reduction of the value of exports. The value of exports of the South Korea decreased with 25%, that of Taiwan with 21%, that of Indonesia with 18%, that of Philippines with 17%, that of Singapore with 16%, Malaysia with 14%, Thailand with 13%. Substantial reductions were recorded at imports as well. In 2002, the weight of the Asian tigers in the world manufactures exports reached 16.18%, a level below that of 2000, but higher that of 2001. The weight of China reached 6.21% of the total.
T
h
eo
re
ti
ca
l a
n
d
Ap
p
lie
d
E
co
n
o
m
ic
s
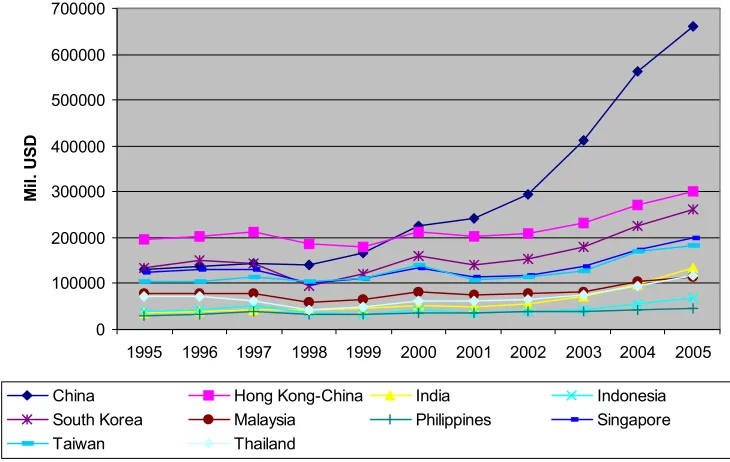
[image:9.595.96.517.58.294.2]Source: World Trade Organization, “International Trade Statistics”, 2006, Data processing.
Figure 5. Evolution of the merchandise exports of the Asian emerging economies (1995-2005)
Source: World Trade Organization, “International Trade Statistics”, 2006, Data processing.
Figure 6.Evolution of the merchandise imports of the Asian emerging economies (1995-2005) 0
100000 200000 300000 400000 500000 600000 700000 800000 900000
1995 1996 1997 1998 1999 2000 2001 2002 2003 20042005
M
il
.
U
S
D
China Hong Kong-China India Indonesia
South Korea Malaysia Philippines Singapore
Taiwan Thailand
0 100000 200000 300000 400000 500000 600000 700000
1995 1996 1997 1998 1999 2000 2001 2002 2003 20042005
M
il
.
U
S
D
China Hong Kong-China India Indonesia
South Korea Malaysia Philippines Singapore
Taiwan Thailand
Among the analysed economies, the most spectaculous evolution was that of China, which surpassed South Korea and Hong Kong-China at exports, as well as at imports.
In the hierarchy of the main exporters at the global level in 2005, China had the third position, with a weight of 7.3% of the world exports, after Germany and the USA. In 1995-1997, the exports of Hong Kong-China were over those of China, but since 1998 until the present, China was the main exporter among the emerging economies, in 2004 surpassing Japan as well, becoming the main
[image:9.595.119.484.346.577.2]C
o
m
m
e
rc
ia
l Po
w
e
r o
f As
ia
At the imports, the hierarchy is similar: China had the third position, after the USA and Germany, with a weight of 6.1% of the world imports. In 1995, China followed Hong Kong-China and South Korea, among the emerging economies. In 1998, it surpassed South Korea, in 2000 surpassed Hong Kong-China, becoming the main importing emerging economy of Asia. In 2003 surpassed Japan, becoming the first importing economy of Asia. Hong-Kong-China had the 11th place in 2005, with a weight of 2.8% of the total, South Korea the 13th place (2.4% of the total), Singapore the 15th place (1.9% of the total), Taiwan the 16th place (1.7% of the total). India had the 17th
position (1.3% of the total), Thailand the 22nd, Malaysia the 24th, Indonesia the 31st, Philippines the 40th. Among these, increases with over 20% at the merchandise imports in 2005 in comparison with 2004 were registered by India (39%), Thailand (25%), Indonesia (27%).
In 2006, the volume of the trade of China (exports plus imports) reached 1,760 milliard USD, the third place in the world trade after USA and Germany. The Chinese authorities forecast that in the following 2 years China will occupy the second place after the USA. The trade surplus of China reached 177.5 milliard USD in 2006, with 74% higher than in 2005 (101.88 milliard USD).
[image:10.595.134.456.236.453.2]Source: World Trade Organization, “International Trade Statistics”, 2006, Data processing.
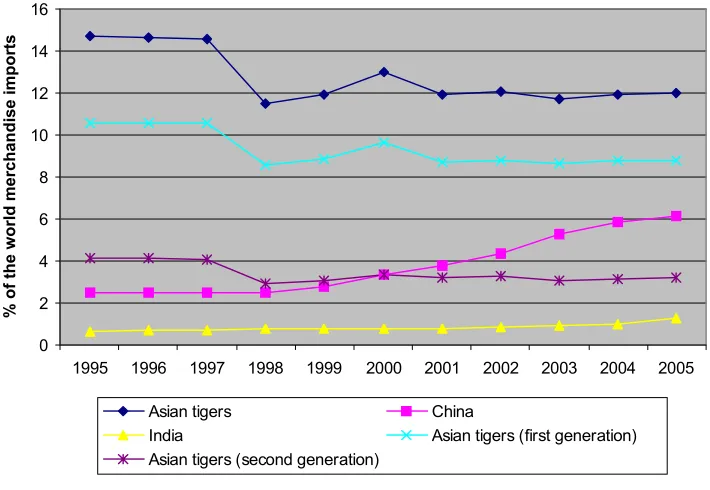
Figure 7. Evolution of the weight of the Asian tigers, China and India in the world merchandise exports (1995-2005)
Source: World Trade Organization, “International Trade Statistics”, 2006, Data processing.
Figure 8. Evolution of the weight of the Asian tigers, China and India in the world merchandise imports (1995-2005) 0
2 4 6 8 10 12 14 16
1995 1996 1997 1998 1999 2000 2001 2002 2003 20042005
%
o
f
th
e
w
o
rl
d
m
e
rc
h
a
n
d
is
e
e
x
p
o
rts
Asian tigers China
India Asian tigers (first generation) Asian tigers (second generation)
0 2 4 6 8 10 12 14 16
1995 1996 1997 1998 1999 2000 2001 2002 2003 20042005
%
o
f
th
e
w
o
rl
d
m
e
rc
h
a
n
d
is
e
i
m
p
o
rts
Asian tigers China
[image:10.595.122.477.509.754.2]T
h
eo
re
ti
ca
l a
n
d
Ap
p
lie
d
E
co
n
o
m
ic
s
0 2 4 6 8 10 12 14 16
1995 1996 1997 1998 1999 2000 2001 2002 2003 20042005 2006 2007 2008 2009 2010 2011 2012
Asian tigers (first generation) China Asian tigers (total) Together, the 10 analysed emerging economies had in
2005 a weight of about 21.5% of the world merchandise exports and 19.4% of the world merchandise imports.
The Asian tigers had in 2005 a weight of 13.25% of the
world merchandise exports, a lower level than that of 14.01% of 1995. The diminishing of the weight of the Asian tigers in the world merchandise exports was due to the two crises: 1997-1998 and 2001 and to the continuous growth of the weight of China in the world trade, from 2.88% in 1995 to 7.3% in 2005. The Asian tigers of the first generation still have a larger share in the world exports than China, but the group of the Asian tigers of the second generation was surpassed by China in 2001. At imports, the situation is similar. The weight of the Asian tigers in the world trade diminished from about 14.7% in 1995 to under 12% in 2005, the main factors being those mentioned in the case of exports, plus the growth of the weight of the USA in the world imports from 14.58% in 1995 to 16.07% in 2005. The weight of China in the world imports recorded a strong growth as well:
from 2.5% in 1995 to 6.12% in 2005, in 2000 having surpassed the group of the Asian tigers of the second generation as weightin the world imports.
It is interesting to analyse the evolution of the exports
of China and of the Asian tigers in the near future, taking into account the following scenario:
n the growth rate of the exports during 1995-2005
projects itself over the next period;
n the growth rate of the exports of China is of minimum
18.4536% yearly in the following period (the average growth rate of 1995-2005);
n the growth rate of the exports of the Asian tigers of
the first generation is of 7.1168% (the average growth rate of 1995-2005);
n the growth rate of the exports of the group of the 8
Asian tigers is of 7.1579% (the average growth rate of 1995-2005);
n the growth rate of the world exports is of 7.5643%
(the average growth rate of 1995-2005).
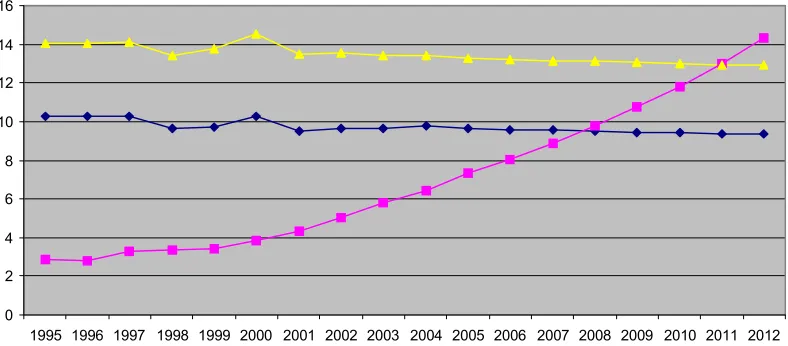
[image:11.595.103.497.336.509.2]Source: World Trade Organization, “International Trade Statistics”, 2006, Data processing.
Figure 9. Evolution of the weight of China, of the Asian tigers of the first generation and of the Asian tigers as a group in the world
merchandise exports (1995-2012)
According to the above-mentioned scenario, in 2008, the weight of China in the world merchandise exports will surpass the weight of the Asian tigers of the first generation, and in 2011 will surpass the weight of the group of the 8 Asian tigers.
At imports, taking into account the following scenario, it comes out that the weight of China in the world merchandise imports will surpass the weight of the Asian tigers of first generation in 2009 and that of the whole group of the Asian tigers in 2012:
n the growth rate of the imports during 1995-2005
projects itself over the next period;
n the growth rate of the imports of China is of
minimum 18.2962% yearly in the following period (the average growth rate of 1995-2005);
n the growth rate of the imports of the Asian tigers of
the first generation is of 6.2665% (the average growth rate of 1995-2005);
n the growth rate of the imports of the group of the 8
Asian tigers is of 6.1641% (the average growth rate of 1995-2005);
n the growth rate of the world imports is of 7.6634%
C
o
m
m
e
rc
ia
l Po
w
e
r o
f As
ia
0 2 4 6 8 10 12 14 16
1995 1996 1997 1998 1999 2000 2001 2002 2003 20042005 2006 2007 2008 2009 2010 2011 2012
%
Asian tigers (first generation) China Asian tigers (total)
0 2 4 6 8 10 12 14 16 18
19 95
19 97
19 99
20 01
20 03
20 05
20 07
20 09
20 11
%
Weight of the USA in the world trade Weight of Germany in the world trade Weight of Japan in the world trade Weight of China in the world trade Weight of India in the world trade Weight of the Asian tigers of the first generation in the world trade Weight of the Asian tigers of the second generation in the world trade Weight of the Asian tigers as a group in the world trade
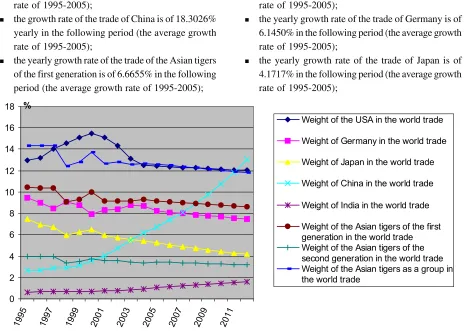
[image:12.595.100.498.60.252.2]Source: World Trade Organization, „International Trade Statistics”, 2006, Data processing.
Figure 10.Evolution of the weight of China, of the Asian tigers of the first generation and of the Asian tigers as a group in the world
merchandise imports (1995-2012)
n the yearly growth rate of the trade of the Asian tigers
of the second generation is of 6.5212% in the following period (the average growth rate of 1995-2005);
n the yearly growth rate of the trade of the USA is of
7.1009% in the following period (the average growth rate of 1995-2005);
n the yearly growth rate of the trade of Germany is of
6.1450% in the following period (the average growth rate of 1995-2005);
n the yearly growth rate of the trade of Japan is of
4.1717% in the following period (the average growth rate of 1995-2005);
Further, it will be taken into account the following scenario at the level of the world merchandise trade:
n the growth rate of the world trade during 1995-2005
projects itself over the next period;
n the growth rate of the world trade is of 7.6143%
yearly in the following period (the average growth rate of 1995-2005);
n the growth rate of the trade of China is of 18.3026%
yearly in the following period (the average growth rate of 1995-2005);
n the yearly growth rate of the trade of the Asian tigers
of the first generation is of 6.6655% in the following period (the average growth rate of 1995-2005);
Source: World Trade Organization, “International Trade Statistics”, 2006, Data processing.
[image:12.595.74.538.407.738.2]T
h
eo
re
ti
ca
l a
n
d
Ap
p
lie
d
E
co
n
o
m
ic
s
The chart from above underlines that China surpassed the weight of the Asian tigers of the first generation in the world trade in 2001 and that of Japan in 2004, the scenario indicating the surpass of the weight of Germany (second place in the world trade in 2005) in 2007, the surpass of the weight of the Asian tigers of the first generation in 2009, and the surpass of the weight of the group of the 8 Asian tigers and that of the USA as well in 2012.The chart underlines the following aspects as well:
n during 1997-1999, the trade of the USA and that of
the Asian tigers had opposite evolutions (“image in the mirror”): while the Asian financial crisis determined the diminishing of the weight of the Asian tigers in the world trade, the weight of the USA grew; the same remark can be made about the evolution of the trade of Germany in comparison with that of the Asian tigers;
n the crisis from 2001 influenced negatively the
weight of the USA and that of the Asian tigers in the world trade as well; by contrast, the weight of China, India and Germany continued to grow, showing that the sector of the information technology does not have the most weightin their trade;
n the share of the USA, Germany and that of the Asian
tigers in the world trade diminished during the period 1995-2005;
n the most accelerated decrease was recorded by
Japan, reflecting the evolution of its economy in the latest decade (the weight of 2005 being at the level of 70% of that of 1995);
n during 1995-2005, the share of China in the world
merchandise trade grew of 2.5 times, while the share of India grew of 1.7 times.
The following arguments will sustain the previous scenario.
On the 21st of July 2005, China chose a controled floating of its currency, with a strong impact on other currencies, as well as on other markets like the bond market and the commodities market. On the basis of the trade balance excedent, the governor of the Central Bank, Zhou Xiaochuan, announced the posibility of the continuation of the revaluation of the yuan (RMB). A greater flexibility of the currency will make possible the use of its policies for economic goals. The effects of the revaluation of the yuan may be absorbed by the exporters, by lower profit margins, in order to let the prices at the actual levels and not to determine inflationary pressures.
Taking into account the declarations of the Chinese authorities, the exports will record lower growth rates, and the imports higher growth rates, but, at the level of the total trade, there will be no major changes. The trade surplus was of 177.5 milliard USD in 2006. The Trade Minister of China, Bo Xilai, announced in January 2007 the launching
of strategies in order to encourage the imports and restrict the exports, for the diminishing of the trade surplus, surplus that worries economies like the USA and the EU, with record deficits in the trade relations with China. But why does the Germany’s surplus not worry anybody, as it grew from 59 milliard USD in 1995 to 196 milliard USD in 2005?
The trade Minister intends to rectructure the sector, by the reduction of the exports intensive in energy and small value added. In 2006, there was launched a package of industrial and fiscal policies for curbing the exports of energy consuming products (especially processing exports), products with a weight of almost 50% in the trade surplus, but with low profit margins. In order to stimulate the imports, the government intends to relax the restrictions and grant fiscal and financial incentives for necessary imports (energy, resources, new technologies and equipments), while the exports of the central and western regions will be further encouraged. The effects of these measures will not be reflected on the short term, that is why in 2007-2008 the surplus will grow further, but at a slower pace.
The Chinese authorities underline some problems, like the low profit of the Chinese companies and the small number of the Chinese trade marks. In the hierarchy of the best 500 international marks, only 4 are Chinese, in comparison with 249 of the USA, 46 of France, 45 of Japan. The competitive capacity of the Chinese companies is smaller than that of the transnational companies. Comparing the strongest 500 international companies with the strongest 500 Chinese companies, in 2005, the rate of total revenues of the two cathegories was 12:1, that of the total profit was 14:1, and that of the total assets was 17:1. The growth rates of the exports and imports of the Asian tigers will have the same trend. On the one hand, the trade dependency of the Asian tigers of China is very strong, on the other hand, the Asian tigers of the first generation, which have the highest weightin the trade of the Asian tigers (72.6% from exports and 73% from imports), are dependent on the import of commodities, and they will further import natural resources.
C
o
m
m
e
rc
ia
l Po
w
e
r o
f As
ia
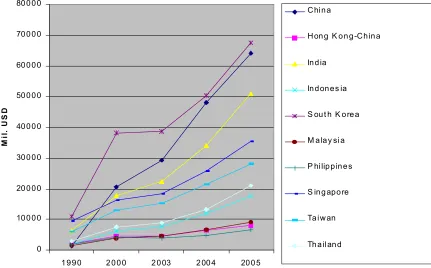
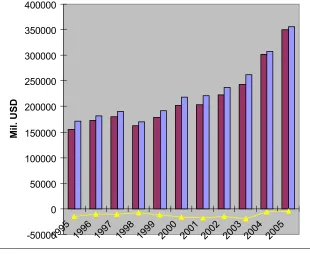
recorded by the economies of CIS, Middle East and some African countries can be explained by the evolution of the natural resources trade and the evolution of prices as well. According to the data of “Key World Energy Statistics 2006”, issued by the International Agency for Energy, in the hierarchy of the main 10 oil exporters in 2004, there was no one of the analysed economy, but in the hierarchy of the imports, China occupied the 3rd position after the USA and Japan, with 5.5% of the total, South Korea had the 4th position, with 5.1% of the total, India the 6th position, with 4.3% of the total. In 2005, in the field of natural gas, in the hierarchy of the main 10 exporters there
were Indonesia, with 4.26% of the total (place 7), after Russia, Canada, Norway, Algeria, Holland, Turkmenistan, while Malaysia was on the 8th place (3.8% of the total). At the imports, the South Korea had the 8th position, with 3.5% of the total. In the field of coal, in the hierarchy of the main exporters in 2005, Indonesia had the 2nd position (14% of the total), China had the 5th position (9.3% of the total; China was the first coal producer in 2005), while in the hierarchy of the main importers, there were South Korea (9.9% of the total, second position after Japan), Taiwan (7.8%, 3rd position), India (4.8% of the total, 6th position), China (3.2% of the total, 8th position).
[image:14.595.82.513.239.507.2]Source: World Trade Organization, “International Trade Statistics”, 2006, Data processing.
Figure 12.Evolution of the imports of fuel of the Asian emerging economies (1990-2005)
That is why the Asian tigers of the first generation, lacking natural resources, had to import them and to specialize in the field of the manufactures and services, while the Asian tigers of the second generation resorted to the export of products with a lower degree of processing. India and China, although have varied resources, have to import resources as well, for the productive consumption and for the consumption of the population, too.
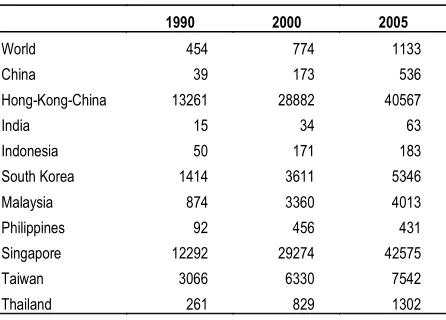
According to the UNIDO Report, “Industrial Development Report 2005”, in the hierarchy of the countries/territories after the export of manufactures/ inhabitants (there were taken in analysis 65 countries and territories), in 2002, Singapore had the 1st position (33,106 USD/inhabitants), Taiwan the 12th position (6,564 USD/ inhabitants), Malaysia the 21st position (4,121 USD/
inhabitants), South Korea the 25th position (3,591 USD/ inhabitants), Hong Kong-China the 27th position (3,212 USD/inhabitants), Thailand the 43rd position (870 USD/ inhabitants), Philippines the 53rd position (482 USD/ inhabitants). China and Indonesia, outside the hierarchy of the 65 countries and territories, recorded a value under 300 USD/inhabitants, 20 positions afterwards coming India.
Processing the data of the World Trade Organization (WTO) and Asian Development Bank (ADB), in the hierarchy of the emerging economies after the export of manufactures/inhabitants, in 2005 on the first place was Singapore, followed by Hong Kong-China (there were taken into consideration the re-exports as well), Taiwan, South Korea, Malaysia, Thailand (all of them over the world
0 10 0 0 0 20 0 0 0 30 0 0 0 40 0 0 0 50 0 0 0 60 0 0 0 70 0 0 0 80 0 0 0
1 9 9 0 2 0 0 0 2 0 03 2 00 4 20 0 5
M
i
l.
U
S
D
C hi n a
H on g -K o n g -C h in a
In d ia
In d on e s ia
S ou t h K o re a
M a la y si a
P hi lip p in e s
S in g ap o re
Ta i w an
T
h
eo
re
ti
ca
l a
n
d
Ap
p
lie
d
E
co
n
o
m
ic
s
average of 1,133 USD/inhabitant), followed by China, Philippines, Indonesia and India (below the world average). [image:15.595.66.289.123.283.2]Export of manufactures/population (USD) Table 2
the global level, the share of the manufactures exports in the world exports is of 72%.
The report on the industrial development of the ONUDI of 2005 (pp. 157-160) indicates a growing trend of the weight of the medium and high technology products in the total exports of manufactures of the analysed economies (with the exception of Hong-Kong-China), the highest rates being recorded by the Asian tigers of the first generation (with the exception of Hong-Kong-China): over 70%, the Asian tigers of the second generation (with the exception of Indonesia): over 60%. Although with a growing trend, the weight of the medium and high technology products in the exports of China and India is of 46% and respectively 20% of their total exports.
3. Analyse of the evolution of the foreign trade indicators of the Asian emerging economies during 1995-2005 (trade balance, normalized trade balance, ratio, index of exports-imports-ratio, trade openness, export propensity, Grubel-Lloyd index)
The characteristics presented before will be emphasized in this section through charts having as basis several
indicators.
- Trade balance BC = X – M
(X = exports; M = imports);
1990 2000 2005
World 454 774 1133
China 39 173 536
Hong-Kong-China 13261 28882 40567
India 15 34 63
Indonesia 50 171 183
South Korea 1414 3611 5346
Malaysia 874 3360 4013
Philippines 92 456 431
Singapore 12292 29274 42575
Taiwan 3066 6330 7542
Thailand 261 829 1302
Sources: World Trade Organization – “International Trade Statistics”, 2006 and Asian Development Bank – “Key Indicators of Developing Asian and Pacific Countries”, 2004, 2005, 2006 (data processing).
Among the analysed economies, Hong Kong-China, China, South Korea and Taiwan have a weight of the manufactures exports in their exports of over 90% (95.8%, 91.9%, 90.7% and respectively 90,7%), Philippines and Singapore have a weight of over 80% (89% and respectively 80.6%), Thailand and Malaysia a weight of over 70% (76.6% and respectively 74.4%), the lowest level being recorded in India (69.4%) and Indonesia (46.9%). At
Source: World Trade Organization, “International Trade Statistics”, 2006, Data processing.
Figure 13. Merchandise trade balance of the Asian emerging economies (1995-2005)
-500000 0 500000 1000000 1500000 2000000 2500000
1995 1996 1997 1998 1999 2000 2001 2002 2003 2004 2005
M
il
.
US
D
Exports of the 10 Asian emerging economies
[image:15.595.170.455.486.740.2]C
o
m
m
e
rc
ia
l Po
w
e
r o
f As
ia
Negative in 1995-1997, the merchandise trade balance of the group of the emerging economies recorded positive values during 1998-2005, reaching a maximum of almost 151 milliard USD in 2005, due in principal to the surplus of China of over 100 milliard USD. China, Indonesia and Taiwan recorded surpluses in the whole interval 1995-2005. India, Hong Kong-China and Philippines recorded the largest deficits, while the trade balances of South Korea, Malaysia and Singapore recorded positive values after 1997. Thailand had a negative balance in the whole interval 1998-2004. During 1995-2005, the trade balance of the group of the 13 least developed countries of Asia was negative, the deficit becoming larger between 2003-2005. Among the other economies of Asia, Papua
New Guinea and Vietnam recorded remarkable results: Papua New Guinea had a positive trade balance in the whole period 1995-2005, and Vietnam, although with a negative balance, had an average growth rate of the exports that surpassed that of China.
The services trade balance of the group of analysed
economies was negative during 1995-2005, the deficit having a decreasing trend. Among the 10 economies, only Hong Kong-China and Singapore have positive balances, but the services play a major role in their economies, the weight of the services in the GDP being 87% in the case of Hong Kong-China and 67.4% in the case of Singapore. For the other 8 economies, the share of the services in the GDP varies between 73.6% (Taiwan) and 40.3% (China).
[image:16.595.129.439.287.541.2]Source: World Trade Organization, “International Trade Statistics”, 2006, Data processing.
Figure 14.Commercial services trade balance of the Asian emerging economies (1995-2005)
Analysing the evolution of the merchandise trade balance of China, in relation with the regions where the main trade partners come from (the USA, Japan, Hong Kong-China, South Korea, Taiwan, Germany, Singapore, Malaysia, Russia, Holland), it comes out that the trade deficit with Asia, which replaced the excedent of before 2000, deepened, the deficit growing from -7.6 milliard USD in 2002 to -27.1 milliard USD in 2003, -36.3 milliard USD
in 2004, to -77 milliard USD in 2005. In parallel, the excedents recorded in the trade flows with North America and Europe have been growing, the excedent with the North America evolving from 7.5 milliard USD in 1995 to 122 milliard USD (growth of 16.3 times or with 1527%). The excedent with Europe grew from 0.9 milliard USD in 1996 to 74.2 milliard USD in 2005 (growth of 82.44 times or with 8144.44%).
-50000 0 50000 100000 150000 200000 250000 300000 350000 400000
1995 1996 1997 1998 1999 2000 2001 2002 2003 2004 2005
M
il
.
US
D
T
h
eo
re
ti
ca
l a
n
d
Ap
p
lie
d
E
co
n
o
m
ic
s
[image:17.595.48.293.53.366.2]Source: World Trade Organization, “International Trade Statistics”, 2006, Data processing.
Figure 15. Merchandise trade balances: Asia,
China-North America, China-Europe (1995-2005)
On the other hand, the evolution of the trade flows between China and Russia is very interesting, evolution having as basis the imports of commodities from Russia and the strategic bilateral relations.
While the year 2006 was oficially “The year of Russia in China”, year 2007 is “The year of China in Russia”. The Sino-Russian agreement of good neighbourhood, friendship and co-operation intensified the relations in fields like politics, economics, science and technology. At the beginning of the month of November 2006, during the week of promotion of the bilateral investments, China and Russia signed in Beijing 8 agreements in order to spur the investments, trade and technical co-operation (including here the production of automotives, development of the infrastructure, mining, wood and glass processing, etc.). The Chinese government estimates that the volume of the bilateral trade will reach 60-80 milliard USD until 2010, and the total Chinese investments in Russia will reach the level of 12 milliard USD until 2020.
[image:17.595.312.532.54.354.2]Source: World Trade Organization, “International Trade Statistics”, 2006, Data processing.
Figure 16.Merchandise trade balance China-Russian Federation (1995-2005)
It is interesting to mention as well that Russia and China are members of the Shanghai Co-operation Agreement (SCO). The SCO is an intergovernmental organization, created on the 15th of June 2001 in Shanghai by China, Russia, Kazakhstan, Kyrgystan, Tadjikistan and Uzbekistan, having as main goals the fight against terrorism, religious extremism and separatism. It must be mentioned as well that the USA did not obtain the status of observer in the SCO, and, on the other hand, the members of the SCO require the USA the withdrawal of the troops from the territory of any member state of the organization.
The normalized trade balance, indicator of the comparative advantage of an economy and, at the same time, indicator of the sign of the trade balance (positive
or with surplus, negative or with deficit). The values of
the normalized trade balance are between -1 (meaning no comparative advantage) and +1 (complete comparative advantage). The formula can be broken down on groups of products.
X M
BCN
X M
− =
+
-100 -50 0 50 100 150
19951996199719981999200020012002200320042005
Ml
d.
U
S
D
Merchandise trade balance China-Asia Merchandise trade balance China-North America Merchandise trade balance China-Europe
-10 -5 0 5 10 15 20
19951996199719981999200020012002200320042005
Ml
d
. US
D
Exports China-Russian Federation
Imports China-Russian Federation
C
o
m
m
e
rc
ia
l Po
w
e
r o
f As
ia
[image:18.595.136.478.64.278.2]Source: World Trade Organization, “International Trade Statistics”, 2006, Data processing.
Figure 17. Normalized trade balance, values between -1 and 1 (1995-2005)
The normalized trade balance indicates, on the one hand, the results reflected by the trade balance, and, in addition, the comparative advantage of an economy.
China, Indonesia and Taiwan had positive balances during 1995-2005. India, Hong Kong-China and Philippines recorded the largest deficits, while South Korea, Malaysia and Singapore had positive values after 1997. Thailand had a positive trade balance during 1998-2004. As an average for the whole period, Indonesia has the highest comparative advantage among the analysed economies, while India has the lowest comparative advantage. Among the two extremes, there are, in a
-1,5 -1 -0,5 0 0,5 1 1,5
1995 1996 1997 1998 1999 2000 2001 2002 2003 2004 2005
Minimum Maximum China
Hong Kong-China India
Indonesia South Korea Malaysia Philippines Singapore Taiwan Thailand
decreasing order: Malaysia, China, Taiwan, South Korea, Singapore, Thailand, Hong Kong-China, Philippines.
The exports-imports-ratio indicates, on the one hand,
which share of the imports can be paid through exports, and, on the other hand, a surplus or a deficit of the trade balance (values < 100% indicate a deficit, 100% indicates a perfect equilibrum, while values > 100% indicate an excedent).
100 X
GA x
M
= (percent)
Source: World Trade Organization, “International Trade Statistics”, 2006, Data processing. Figure 18. Exports-imports-ratio (1995-2005)
0 20 40 60 80 100 120 140 160 180
1995 1996 1997 1998 1999 2000 2001 2002 2003 2004 2005
%
China
Hong Kong-China India
[image:18.595.139.486.516.738.2]T
h
eo
re
ti
ca
l a
n
d
Ap
p
lie
d
E
co
n
o
m
ic
s
0 20 40 60 80 100 120 140 160
1996 1997 1998 1999 2000 2001 2002 2003 20042005
%
China
Hong Kong-China India
Indonesia South Korea Malaysia Philippines Singapore Taiwan Thailand
Analysing the evolution of the exports-imports-ratio, there can be underlined the following trends:
n China, Indonesia and Taiwan recorded in the whole
period 1995-2005 results > 100%, indicating positive balances, Indonesia recording even values over those recorded by China and Taiwan in 1996, 1998-2005. The highest values recorded by China were in 1997-1998 and 2005, the highest values recorded by Indonesia were in the period 1999-2002, and the highest values recorded by Taiwan were in the period 2001-2003;
n South Korea, Malaysia and Singapore recorded since
1998 positive balances, recording in the whole period 1998-2005 exports-imports-ratios > 100%. South Korea recorded the highest value in 1998, Malaysia in 1998-1999 and 2003, and Singapore in 1998, 2003-2005;
n Philippines recorded negative trade balances in the
whole period, with the exception of 1999-2000, while Thailand recorded positive balances in
1998-2004, although the exports-imports-ratio had a decreasing trend after 1999;
n Hong Kong-China and India recorded in the whole
period 1995-2005 negative trade balances, the fluctuations and deficits of India being larger than those of Hong Kong-China.
Index of the exports-imports-ratio (indicator of dynamics, indicating the yearly evolution of the exports-imports-ratio)
1 1 0 1 0
:
0 1 0 1 0
GA X X X M
IGA x
GA M M M X X
= = = =
1 0 1 1 1/ 0
:
0 1 0 0 1/ 0
X
M
X M X M I
x
X M X M I
= = =
>100% - either an increase of the excedent, or the transition from a deficit to an excedent, or the diminishing of the deficit;
<100% - either the diminishing of the excedent, or the increase of the deficit, or the degradation of the balance (transition from a positive to a negative trade balance).
[image:19.595.148.491.352.567.2]Source: World Trade Organization, “International Trade Statistics”, 2006, Data processing. Figure 19. Index of exports-imports-ratio (1995-2005)
China, Indonesia and Taiwan, with positive balances in the whole period 1995-2005, recorded values over 100%, as well as values of under 100%, indicating years when the excedent grew or diminished.
Hong Kong-China and India recorded in the whole period negative balances, the values over 100% indicating the increase of the deficit, the values under 100% indicating the decrease of the deficit.
It should be underlined that the highest variations of the index of the exports-imports-ratio were recorded in the period 1996-1999, especially for South Korea, Philippines, Indonesia, Malaysia.
Further, there will be underlined the trade openness
and the export propensity of the emerging economies of
Asia, using the following formulas:
- Trade openness:
GDE =
X M
PIB
+
x 100 (percent)
- Export propensity:
100 X
IE x
PIB