Georgia State University Georgia State University
ScholarWorks @ Georgia State University
ScholarWorks @ Georgia State University
Public Health Theses School of Public Health
Spring 5-16-2014
An Outcome Evaluation of CHOICES: A Brief Alcohol Abuse
An Outcome Evaluation of CHOICES: A Brief Alcohol Abuse
Prevention Program at Georgia State University
Prevention Program at Georgia State University
Ethan Johnson
Follow this and additional works at: https://scholarworks.gsu.edu/iph_theses
Recommended Citation Recommended Citation
Johnson, Ethan, "An Outcome Evaluation of CHOICES: A Brief Alcohol Abuse Prevention Program at Georgia State University." Thesis, Georgia State University, 2014.
https://scholarworks.gsu.edu/iph_theses/321
1
An Outcome Evaluation of CHOICES: A Brief Alcohol Abuse Prevention Program at Georgia State University
By: Ethan Johnson Bachelor of Science University of Central Florida
A Thesis Submitted to the Graduate Faculty of Georgia State University in Partial Fulfillment
of the Requirements for the Degree
MASTER OF PUBLIC HEALTH
2
Acknowledgements
I would like to Acknowledge Dr. Kymberle Sterling and Madeleine Frey, MPH for their
academic support throughout the process of this evaluation. I would like to also
acknowledge Dr. Mikyta Daugherty, Dr. Jill Lee-Barber, Johnny Gossett and the staff of Georgia State University’s Counseling and Testing Center for their technical and
professional support throughout this process. I would like to acknowledge my parents
Earl and Jewel Johnson for their continued guidance and support, and my uncle and aunt
Milton and Carol King for acting as parents away from home while completing this
program. I’d also like to give a special thanks to my classmate and colleague LaShonda
3
Table of Contents
Executive Summary ………5
Chapter1: Introduction ………8
1.1 Background ………8
1.2 CHOICES ………..9
Chapter 2: Literature Review ………..11
Chapter 3: Program Description ………..21
3.1 CHOICES ………..21
3.2 Program Format ……….22
Chapter 4: Program Objectives & Theoretical Basis ………..24
4.1 Mission ………..24
4.2 Program Theory ……….25
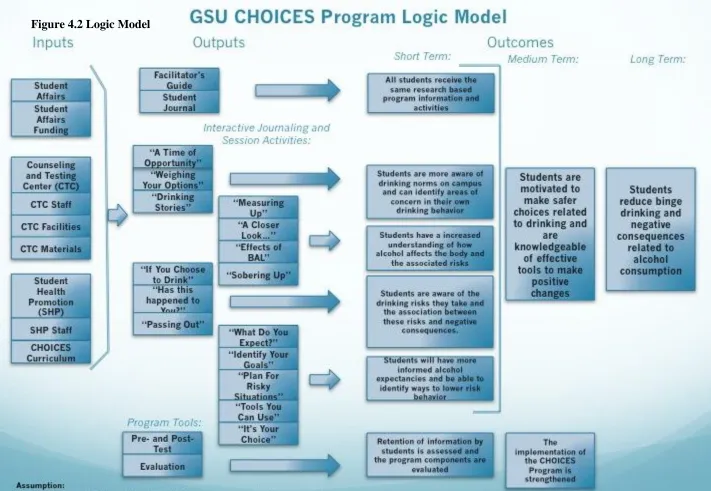
4.3 Logic Model ………..29
Chapter 5: Evaluation Methods ………...30
5.1 Data Collection ………..30
5.2 Evaluation Questions ……….30
5.3 Data Analysis ……….30
Chapter 6: Results ………33
6.1 Summary of Key Results ………47
Chapter 7: Discussion………49
7.1 Recommendations ………...49
7.2 Stregths & Limitations ………50
7.3 Contribution to Public Health ……….51
Bibliography ……….53
Appendices ………55
Appendix A: CHOICES Student Journal ………..55
Appendix B: CHOICES Pre/Post Test ………..71
Appendix C: CHOICES Course Evaluation ………..73
Appendix D: CHOICES Pre/Post Test Code Book ………75
4
APPROVAL PAGE
An Outcome Evaluation of CHOICES: A Brief Alcohol Abuse Prevention Program at Georgia State University
By Ethan Johnson Bachelor of Science University of Central Florida
Approved:
__________________________________________
Committee Chair
__________________________________________
Committee Member
__________________________________________
Committee Member
__________________________________________
5
Executive Summary
Program Description
CHOICES: A Brief Alcohol Abuse Prevention and Harm Reduction Program, is a
research-based intervention program that can assist college students in making safer
choices as it relates to alcohol consumption. Students in CHOICES are informed of the
risks associated with alcohol use and are provided with the tools and strategies necessary
for reducing these risks. Students who complete CHOICES leave with the knowledge and
strategies that are required to modify risky drinking behavior and reduce negative
consequences related alcohol consumption.
Evaluation Questions
The purpose of the evaluation was to determine how effective is the CHOICES
program. Program effectiveness was measured through the assessment of student’s
change in background knowledge, knowledge of health related risks associated with
alcohol consumption, and attitudes towards excesive drinking. Student’s perceived
effectiveness of the program and their likelihood to modify their behavior was also
assessed. Below are the five evaluation questions:
1. Do students display an increase in background knowledge of alcohol
consumption?
2. Do students display an increased knowledge of health-related risks associated
with alcohol consumption?
3. Do students display a change in attitudes towards excessive drinking?
4. Do students consider the CHOICES Program an effective alcohol abuse
6
5. Are students likely to modify their behavior as a result of the CHOICES
Program?
Methods
There were 88 students mandated to participate in and complete Georgia State
University’s CHOICES Program from May 2013 to December 2013. Of those 88
students, 83 of them completed pre- and post-tests, and 84 completed the de-identified
evaluation. The data was entered directly into IBM’s SPSS Statistics Desktop Version 21.
Reliability analyses were conducted to evaluate the internal consistency and reliability of
the scales created to answer the evaluation questions. Frequencies were run on the
responses from the pre-tests, post-tests and evaluations. A paired-samples t-test was used
to compare mean scores of students before and after completing the CHOICES Program.
An independent-samples t-test was used to compare the difference in mean scores
between men and women.
Key Findings
Statistically significant findings suggests that CHOICES is an effective alcohol
abuse prevention program. There was a statistically significant increase in background
knowledge scores from the pre-test to the post-test. These results indicate that students
who complete CHOICES display an increase in background knowledge of alcohol use.
There was also a statistically significant increase in health knowledge scores from the
pre-test to the post-test. This indicates that students who complete CHOICES display an
increase in knowledge of health-related risk associated with alcohol consumption.
7
pre-test to the post-test, indicating that students who complete CHOICES display a
positive change in attitude towards excessive drinking.
Over half of students gave CHOICES an overall rating of “excellent” and 38.6% gave it a rating of “good”. Also, 60.6% of students scored above a 28 on the
Program Effectiveness Scale. These results indicate that students consider CHOICES an
effective alcohol abuse prevention program. 60.7% of students reported that they would
“definitely” change some aspect of their alcohol-related behavior as a result of the
CHOICES Program. 29% reported “maybe”. These results indicate that the majority of
students are likely to modify their behavior as a result of CHOICES. Students who
participate in CHOICES leave the program with increased knowledge, a change in
attitude towards excessive drinking and are motivated to make safer choices related to
8
Introduction
Background
Alcohol consumption and abuse affects the majority of college students in either a direct
or indirect manner (NIAAA, 2013). Over the past few decades the consumption of
alcohol has become engrained in collegiate culture. Approximately four out of five
college students consume alcohol, and half of which do so while binge drinking (NIAAA,
2013). Many students believe that alcohol is a vital ingredient in social success (NIAAA,
2005). Some students perceive alcohol as a tool that can relax them and allow them to be
truer versions of themselves (NIAAA, 2005). The problem with this pervasive culture of
drinking amongst college students is that it leads to many adverse health outcomes.
Here in the United States 1,825 college students die annually from unintentional
injuries related to drinking, more than 690,000 students are assaulted by a student who
has been drinking, and more than 97,000 students are victims of alcohol-related sexual
assault or rape (NIAAA, 2013). The public health implications of college drinking are
more than apparent, and the methods of intervening vary. For alcohol abuse prevention
and intervention programs on college campuses to have campus wide impacts they must
be multi-level and implemented in a way that targets individual students, the student
body, and the surrounding community (NIAAA, 2013). Most alcohol abuse prevention
and intervention programs on college campuses focus on increasing knowledge,
modifying behavior, influencing the culture of drinking on campus, and changing policies
9
Choices
CHOICES is a brief alcohol abuse prevention and harm reduction program geared
towards college students. Historically, alcohol intervention programs for college students
have had an exclusive focus on providing information to students about the risks and
harm associated with alcohol (Marlatt, Parks & Calhoon, 2003). This focus is often
coupled with scare tactics and enforcement threats. This is an approach that has been
proven ineffective. Most college students are aware of the adverse health outcomes and
risks associated with alcohol consumption and decide to drink excessively anyways.
Unlike many prior alcohol abuse prevention programs, CHOICES seeks to assist students
in building the motivation and skills necessary to reduce the risks associated with alcohol
use and the harm it can cause to themselves and others (Marlatt, Parks & Calhoon, 2003).
CHOICES recognizes that abstinence is the only legal option for students under
the age of 21. The program also recognizes that abstinence is the only way to avoid the
risks associated with alcohol consumption all together. With that said, the CHOICES
curriculum outlines abstinence as an important tool and concept, but the curriculum is
also built around the belief that underage students who choose to drink should do so with
the least amount of risks and harm as possible. Students who go through CHOCIES are
expected to self-examine their drinking behavior, increase their knowledge of alcohol
consumption and the risks associated with it, explore drinking norms on their campus and
how those norms differ from their perceived norms, and modify their alcohol
expectancies. This is achieved through a two-session course format where students are
guided through a number of activities that incorporate group discussions, interactive
10
should be motivated to make safer choices related to drinking and are knowledgeable of
11
Literature Review
Alcohol intervention programs on college campuses should be based on
the demographic and behavioral characteristics of the student participants. A study was
published that examined the baseline characteristics of college freshmen enrolled in the
Brief Alcohol Screening and Intervention for College Students (BASICS) program
(Kazemi, Sun, Dmochowski, Nies & Walford, 2012). BASICS is a multiple-component,
individual-focused college drinking intervention program. It has a harm reduction
approach that utilizes brief motivational interviewing. The study participants were
college freshmen between the ages of 18 and 20 who were enrolled in state universities in
the southeast US. Study participants were recruited from freshmen seminar classes. At
the first visit, participants completed the Daily Drinking Questionnaire, the Rutgers
Alcohol Problem Index, and the Government Performance and Results Act. The results
found the study population to be demographically diverse, but also found that participants
shared many of the same high-risk behavior characteristics. Heavy use of alcohol and
other drugs, along with psychological and emotional problems were commonly shared
characteristics. Heightened drinking between Thursday and Saturday was also observed.
The implications from this study suggest that alcohol interventions should be
aimed towards risk and harm reduction. This study highlights the culture of drinking
amongst college freshmen and the importance of extending alcohol interventions beyond
abstinence only education. College freshmen are a high-risk group of drinkers therefore
risk reduction strategies and motivating students to modify behavior should be the focus
of collegiate alcohol abuse prevention programs. CHOICES has a strong emphasis on
12
towards drinking and their likelihood to modify their drinking behavior were assessed.
These are key outcomes in a prevention program such as CHOICES.
First year college students’ estimation of their own drinking and how this
estimation, whether accurate or inaccurate, corresponds to alcohol-related consequences
were examined by Hultgren, Cleveland, Turrisi & Mallett (2014). Social variables and
the impact they have on first year college students’ perceived drinker type were also
examined. The authors of the study hypothesize that students who misperceive
themselves as lighter drinkers are more likely to engage in high risk drinking behavior
and as a result suffer consequences related to alcohol consumption. In contrast, they
hypothesize that students who overestimate their drinker type are less likely to experience
consequences. They also hypothesize that students with more positive social influences
relating to alcohol consumption will be positively associated with underestimation of
drinker type. A northern U.S. university was used for the study population. Incoming
freshmen in 2007 and 2008 were randomly selected for the study for Cohort 1 and Cohort
2 respectively. Four drinking classes were identified with latent class analysis (LCA)
using seven drinking measures. These seven measures included; typical daily drinking,
number of drinks typically consumed on weekdays (Sunday-Wednesday), number of
drinks consumed on Thursdays, number of drinks consumed on weekends (Friday-Saturday), frequency of drunkenness, number of times they’ve consumed 4 or more
drinks in the past 2 weeks (5 or more for males), and peak blood alcohol content. The
four drinking classes that were derived from these measures were non-drinkers, weekend
13
The study found that both underestimation and overestimation increase the risk of
consequences from alcohol consumption in first year college students. It’s noted that
these results could be attributed to the Alcohol Expectancy Theory, which explains that
individuals will act as though they are intoxicated if they believe they are drinking
alcohol, even when they are not actually consuming alcohol. The study also found that
students who are in social environments that reinforce positive expectancies of alcohol
have increased risky drinking. This study highlights the importance of college students’
own perception of their drinking habits. In CHOICES students participate in interactive
journaling throughout the program. This activity allows students to assess their personal
relationships with alcohol in a meaningful way. This exercise, coupled with a series of
activities, challenges students to assess how much alcohol they actually consume.
Students then compare their drinking habits and perceived drinking habits of others to
actual drinking norms. Self-reflecting is a vital component of alcohol abuse prevention
programs and allows students to identify areas of concern in their own drinking habits.
Realization of accurate drinking norms can be reflected in student’s change in attitude
towards drinking.
A goodness of fit assessment was conducted on an alcohol intervention program
and the underlying theories of change (Ramos & Perkins, 2006). Theories of change
guide the development and implementation of intervention programs; therefore it is vital
that program elements align with the theories of change in order to ensure positive
program outcomes. This particular study examined the goodness of fit between program
elements in the Alcohol Intervention Program Level 2 (AIP2) at Pennsylvania State
14
program elements were evaluated and the health promotion theories attached to this
program were identified. The theories that consistently matched each program element
focused on college students and factors that lead to alcohol consumption. The four
theories identified were The Health Belief Model, The Social Learning Theory, The
Social Norms Theory and The Transtheoretical Model of Change. These components are
utilized throughout the entire intervention, but the authors still give several
recommendations that could improve the intervention program and strengthen the
theories that are being used.
The social norms theory can be seen in the intervention through the heightened
comprehension technique. Students compare their perceptions of drinking norms to actual
drinking norms of their peers. The authors suggest that an activity-based intervention that
addresses the universal perceptions of behavior norms related to college drinking could
strengthen the Social Norms Theory. Many components of The Social Learning theory
are utilized in the peer interventionist and education-based framework. The authors
suggest that the Social Learning Theory could be strengthened through improved
discussions of negative outcomes from drinking. The discussion should utilize
activity-based handouts and videos to focus the discussion on more serious outcomes of heavy
drinking. The Health Belief Model is used in the section of the program that identifies
drinking patterns by frequency and amount as a potential health-related risk. Adding an
assessment of participants’ lifestyles could strengthen this model. This will aid in
increasing awareness of high-risk behaviors. The Transtheoretical Model of Change
operates a primary guide to the implementation of AIP2. This could be even better
15
intervention so that discussions can be better tailored to individual participants’ needs.
Peer interventionist should develop intervention plans that target individuals’ needs at
each stage of change.
One can conclude from this article that not only is the inclusion of theories of
change vital to intervention programs’ implementation, but the degree to which they are
incorporated play a integral part in program outcomes. CHOICES uses the
Transtheoretical Stages of Change Model as a theoretical framework for the program. It
is not expected that two 90 minute sessions will result in the immediate change in
students drinking behavior, but the CHOICES curriculum was designed to reach students
who fall anywhere in the stages of change model. Fidelity to the curriculum and the facilitator’s guide ensures that all students receive the same research based program
information and activities. This allows for students at every stage of change to be
impacted by the program. The fidelity to the stages of change construct and the
CHOICES curriculum was assessed through students’ perceived effectiveness of the
program and their increase in knowledge.
Many alcohol interventions on college campuses are voluntary or implemented
through freshmen classes. Other alcohol interventions are mandated for students to attend
and are incorporated into punitive sanctions for students violating the code of conduct as
it relates to alcohol consumption. In an article from the Journal of Substance Abuse
Treatment a systematic review was conducted on alcohol intervention programs that
college students are required to attend (Barnett & Read, 2005). MEDLINE and
PsycINFO were the two primary resources used to find and review published research on
16
were; participants had to be required to attend an alcohol intervention program or an
alcohol related infraction, and post-intervention outcomes were reported. Thirteen single
group studies and three randomized control trials were included in the study. The study
found that the existing research points towards mandated alcohol intervention programs
having a positive impact on college students. Participants in these types of interventions
report positive responses and display an increased knowledge of alcohol consumption.
This study was not without limitations, most of these studies used qualitative or
quasi-experimental designs and did not include comparison or control groups, had small sample
sizes, lacked behavioral measures of alcohol consumption, and had no follow-up, low
follow-up rates, or short follow-up intervals. A couple of the studies also had some
voluntary students included in their interventions. Even with that said, the authors
concluded that mandatory interventions do show promise in modifying risky drinking
behavior among college students.
CHOICES students at Georgia State are mandated to participate in the program
upon violation of the code of conduct. CHOICES students also must pay a registration fee of 35 dollars. A hold is put on the student’s accounts and is removed once the
program is completed. Analyzing the mean differences from pre- and post-test scores will
reveal the effectiveness of the mandated version of CHOICES.
The Brief Alcohol and Screening Intervention for College Students(BASICS)
was evaluated for effectiveness by DiFulvio, Linowski, Mazziotti & Puleo (2012). There
were 2,672 students who participated in the program between 2006 and 2008 and were
included in the evaluation. Self-reported drinking behavior was collected at baseline and
17
behavior was collected again. Students in the comparison group did the same. Typical,
peak and heavy episodic drinking were analyzed using several measures. Typical alcohol
consumption was assessed by average number of drinks per social drinking occasion, and
by total number of drinks in a typical drinking week. Peak alcohol consumption was
assessed by number of drinks consumed on the heaviest drinking occasion in the past 30
days, and by total number of drinks per heaviest week. Heavy episodic drinking was
assessed by the number of times a student drank five (four for female students) or more
drinks in one sitting within the two weeks prior to taking the survey. Knowledge of the
consequences from alcohol use was measured using the Rutgers Alcohol Problem Index.
The effectiveness of the intervention was examined based on single-episode drinking
concentrations, weekly cumulative alcohol consumption, high-risk drinking behaviors,
and knowledge of negative consequences. The study concluded that participants reduce
their drinking rates, but they are still drinking in significantly high-risk ways. The results
of this study indicated that implementing the program with fidelity might reduce risky
drinking behaviors. The results also indicated that a program such as this is less effective
for low-risk behavior students. In the evaluation for CHOICES pre- and post-test data
collected at the beginning and the end of the program will be examined. Course
evaluation data was examined. These data are sufficient for assessing short-term
outcomes, but to analyze the long-term impact of CHOICES future studies will need to
include collection of follow-up data.
The efficacy of expectancy challenge Interventions to reduce college student
drinking was reviewed using meta-analysis (Garey, Carey, Terry, Scott-Sheldon & Carey,
18
expectations from drinking. Different beverages are given to groups of drinkers. Some of
the drinks contain alcohol and others contain a placebo beverage. Participants engage in
activities that promote social interaction, and afterwards participants are asked to evaluate
whether other participants were drinking alcohol or the placebo. This opens up discussion
on the effects of alcohol attributable to expectancies. In this meta-analysis intervention
success was measured by alcohol expectancies and alcohol consumption. The authors
hypothesized that college students who received an EC intervention would report lower
positive alcohol expectancies, greater negative alcohol expectancies, and reduced alcohol
consumption. 14 studies were examined that evaluated 19 interventions challenging
alcohol-related expectancies among 1,415 college students. The authors found that
compared with controls, EC interventions were more successful at reducing positive
alcohol expectancies, the quantity of alcohol consumed, and the frequency of heavy
drinking. EC interventions are not a part of the CHOICES curriculum, but depending on
the likelihood of behavior modification and CHOICES perceived effectiveness, adding
EC interventions as a component of CHOICES could be a potiential program
enhancement.
A community model for inclusion in the university setting for an alcohol
treatment program for college students was examined (Palombi, 2006). The use of the
community intervention model at a midwestern university for alcohol treatment was
described. A community model of embeddedness, interdependence, intradependence, and
evolution (CMEIIE) has been used to create this approach to intervention and treatment.
This model takes into account current alcohol prevention programs and studies on
19
resources within the university and local community, clarifies the role of each of these
agencies, and charges the University Counseling Center to coordinate a systems approach
to intervention and treatment through collaboration and intradependence. CMEIIE is a
way to consolidate resources and ideas that can aid in alcohol education and
interventions. CMEIIE is a tool that aids universities in designing their own community
model that takes into account policies, resources and funding around the University and
surrounding community. The article concludes that a campus environment that supports
alcohol treatment aids in students’ achieving their academic goals. While CHOICES is a
program that specifically targets high-risk students, it is important to work across campus
with different agencies and organizations to not only encourage risk-reduction, but also
modify the culture of drinking on campus.
Alcohol consumption is a major public health problem across the country;
therefore evidence-based interventions are a necessity for every college campus.
Prevention programs should exist for all students entering their first year of college, and
intervention programs should be implemented for students who display high-risk drinking
behaviors. Best practices in college level alcohol interventions dictates that interventions
should focus on behavior modification and risk reduction. Abstinence should be included
in prevention programs but is by no means a gold standard. Although demographics and
backgrounds of college students differ, they share many of the same high-risk behavior
characteristics. Self-reflection that explores college student’s perceived drinker type is
also an important aspect of intervention. Students who under-perceive the amount of
alcohol they consume are at a much higher risk of harm related to alcohol. Theoretical
20
utilized in alcohol intervention programs plays a role in the degree of positive outcomes.
Lastly, college interventions should have a holistic campus wide approach. Interventions
that reach across the entire campus can be more cost effective and have a greater
21
Program Description
CHOICES
CHOICES: A Brief Alcohol Abuse Prevention and Harm Reduction Program, is a
research-based intervention program that can assist college students in making safer
choices as it relates to alcohol consumption. Students in CHOICES are informed of the
risks associated with alcohol use and are provided with the tools and strategies necessary
for reducing these risks. Students who complete CHOICES leave with the knowledge and
strategies that are required to modify risky drinking behavior and reduce negative
consequences related alcohol consumption.
George Parks and Alan Marlatt developed the CHOICES Program in
collaboration with The Change Companies. Marlatt and Parks based the curriculum for
CHOICES off of more than 20 years of research funded by The National Institute of
Alcohol Abuse and Alcoholism (NIAAA) on alcohol harm reduction programming for
college students at the University of Washington (Marlatt, Parks & Calhoon, 2003). They
found that interventions focusing on moderation are more effective than interventions
that focus on abstinence only. Alcohol abuse intervention programs that focus on harm
reduction rather than abstinence only can reduce drinking rates and alcohol related
negative consequences among college students (Marlatt & Witkiewitz, 2002). The
research also concluded that although it is important to recognize the illegal nature of
underage drinking it is equally as important to provide college-aged young people with
information and strategies that can aid in reducing their risk of harm if they choose to
22
The Alcohol Skills Training Program (ASTP) Interventions are the product of this
research and serve as the basis for the development of several alcohol intervention
programs, the CHOICES curriculum included. CHOICES was designed as a
intervention/prevention tool to deliver the research-based Alcohol Skills Training content
in a brief and flexible facilitated group setting.
Program Format
CHOICES can be administered to a variety of different groups, in a variety of
different settings, and in a variety of different ways. CHOICES can be presented in a
campus-wide format, or it can be facilitated in more targeted settings such as freshmen
classes, fraternity/sorority houses, or mandated groups. Individuals with group facilitation
skills and general background knowledge about alcohol tend to be the best facilitators,
but counselors, resident assistants; teachers and coaches are all good candidates.
CHOICES is preferably implemented in a two 90-minute session format. The time
between the two sessions allows for time to monitor alcohol consumption experiences,
give students structured feedback and tailor the program activities to the specific needs of
the participants. Two 90-minute sessions are not always feasible and in these cases it is
possible to deliver the program in one session, but two sessions are much more preferable
if time permits. Before students begin CHOICES they complete a web-based personal
alcohol assessment and receive feedback. Following the web-based assessment students
complete a screening with a counselor at Georgia State’s Counseling and Testing Center
in order to collect basic information on the student’s current drinking habits and alcohol
expectancies. Students are then able to register for the CHOICES class, which is led by a
23
session students take a pre-test and are introduced to facts about alcohol and the risk
associated with the consumption of it. The second session emphasizes the material
learned in the first, and focuses on the results of self-monitoring exercise and the
application of harm reduction strategies. The Student Journal aids in guiding the students
through four primary themes; Myths & Realities of Drinking, Facts About Alcohol,
Drinking Risks & Harm, and Strategies For Reducing Risks (Appendix A). Woven
throughout the program is an interactive journaling exercise the students return to after
covering each theme. Interactive journaling is experiential writing that provides small
amounts of information and helps students apply the information they are learning by
asking “What does this mean to you?” in a variety of ways (Marlatt, Parks & Calhoon,
2003). Interactive journaling enables students to think about their relationship with
24
Program Objectives & Theoretical Basis
CHOICES Mission
The mission of CHOICES is to, “educate college students about the effects of
alcohol on their behavior, to promote self-evaluation of drinking patterns and to facilitate
the acquisition of effective coping strategies so that students can make informed
decisions and reduce their alcohol-related risk and harm.” The main two objectives of
CHOICES is for students to realize for themselves that their alcohol expectancies may
not match their actual experiences, and that high risk drinking behaviors lead to negative
consequences that can adversely affect their goals pertaining to their social life,
academics and even their future career. There are nine basic premises of the CHOICES
curriculum that aid in fulfilling this mission and achieving these objectives:
1.) All change is self-change.
2.) As young-adults, college students are deserving of our respect and compassion.
3.) Students are responsible for the choices they make.
4.) Students are more likely to make low-risk choices regarding drinking if they have
accurate information about alcohol.
5.) Abstinence is one of many options available to students. It is the only legal one
for underage students and the only no-risk alternative for all students.
6.) Knowledge does not equal change.
7.) Motivation can be enhanced by raising awareness of consequences and of the
discrepancy between current behavior and important goals.
8.) Motivation can be enhanced by providing students with options and alternatives.
25
Program Theory
CHOICES is based on the belief that college-aged students who are given
accurate information about the negative effects of alcohol, motivated to change high risk
drinking behavior and equipped with the right tools and strategies to make positive
changes will be most successful in reducing harm related to drinking for themselves and
others. To achieve this, CHOICES uses the Transtheoretical Stages of Change Model as a
theoretical framework for the program. The Transtheoretical model is, “an integrative
framework for understanding how individuals and populations progress toward adopting
and maintaining health behavior change for optimal health. The Transtheoretical model
uses stages of change to integrate processes and principles of change from across major
theories of intervention.” (McKenzie, Neiger & Smeltzer, 2005). The core constructs of
this theory are stages of change, the processes of change, the pros and cons of changing,
and self-efficacy. The stages of change and the processes of change are vital constructs in
the development and implementation of CHOICES. The stages of change model presents
the temporal dimensions of change. Stages are as follows 1.) The precontemplation stage
people have no intention to take action within the next six months, 2.) The contemplation
stage when people now intend to take action within the next six months, 3.) The
preparation stage people intend to take action in the next 30 days and have taken some
behavioral steps in this direction, 4.) The action stage when overt behavior has been
changed for less than six months, and 5.) The maintenance stage which is when overt
behavior has been changed for more than six months. All of these stages lead to
termination, which is when behavior is 100% modified and no temptation to return to old
26
that two 90 minute sessions will result in students immediate change in behavior, but
CHOICES was designed to reach students who fall anywhere in the stages of change
model. For some students the program may only pique their interest in drinking behavior
modification, for others the program may help them commit to a change, and in some
[image:27.612.90.501.210.534.2]cases CHOICES may reaffirm commitments that students have already made.
Figure 4.1 Stages of Change (McKenzie, Neiger & Smeltzer, 2005)
The processes of change are the covert and overt activities that people use to
progress through the stages of change (McKenzie, Neiger & Smeltzer, 2005). Processes
that are categorized as experimental are more often emphasized in the earlier stages
because they increase intention and motivation, and processes categorized as behavioral
are more often emphasized in the later stages because they aid in the maintenance of
27
which processes are most emphasized at each stage of change. Many of the processes of
change are incorporated into the Interactive Journaling activities as a way to guide
students through a more personal change process.
Table 4.1 Stages of change in which processes are most emphasized (McKenzie, Neiger & Smeltzer, 2005)
Stages of Change
Precontemplation Contemplation Preparation Action/ Maintenance
Consciousness raising
Dramatic relief
Environmental reevaluation
Processes
Self-reevaluation Self-liberation
Contingency management
Helping relationships
Counter conditioning
Stimulus control
Motivational Enhancement Strategies are also a large part of the theory for the
CHOICES program. The main strategy used in CHOICES is Motivational Interviewing.
Motivational Interviewing is a collaborative, person-centered form of guiding to elicit
and strengthen motivation for change ("Motivational interviewing basics," 2012). This
strategy focuses on exploring and resolving ambivalence and centers on motivational
processes within the individual that aid in the facilitation of change. The method differs
greatly from the more traditional coercive approaches for motivating change being that it
does not impose or suggest change, but rather supports change in a manner that aligns
28
Motivational interviewing is utilized in a major way in CHOICES to raise discrepancy
between college students’ current use of alcohol and important goals in their lives that
29
30
Evaluation Methods
Data Collection
From May 2013 to December 2013, 88 students were mandated to participate in and
complete Georgia State University’s CHOICES Program. The CHOICES curriculum
comes with pre- and post-tests and a course evaluation form. The test and the evaluation
can be found in Appendices B and C. Of the 88 students, 83 of them completed both the
pre- and post-test, and 84 completed the de-identified evaluation. Analysis of these data
was conducted to answer the evaluation questions below.
Evaluation Questions
Table 5.1 Evaluation Questions Program Outcomes:
1.) Do Students display an increase in background knowledge of alcohol use?
2.) Do students display an increase in knowledge of health-related risk associated with alcohol consumption?
3.) Do students display a change in attitudes towards excessive drinking?
Program Satisfaction:
4.) Do students consider the CHOICES Program an effective alcohol abuse prevention program?
5.) Are students likely to modify their behavior as a result of the CHOICES Program?
Data Analysis
IBM’s SPSS Statistics Desktop Version 21 was used to analyze data collected
from the student participants. Table 5.2 depicts the measures, scales and items used to
answer the evaluation questions. The evaluation data and the test data were run in two
31
Responses for the tests and the evaluations were input directly into SPSS.
Reliability analyses were conducted to evaluate the internal consistency and reliability of
the scales created to answer the evaluation questions. Frequencies were run on the
responses from the pre-tests, post-tests and evaluations. A paired-samples t-test was used
to compare mean scores of students before and after completing the CHOICES Program.
Due to the lack of availability of demographic data gender was assigned based on the
[image:32.612.86.521.292.747.2]names of the student participants.
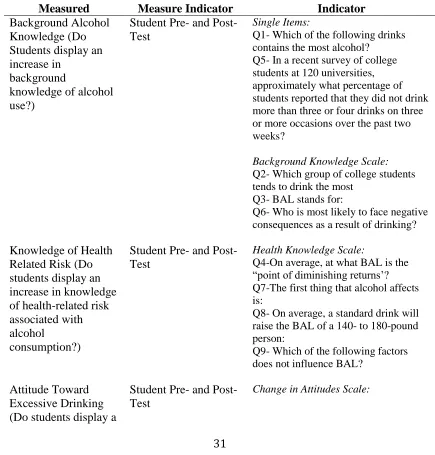
Table 5.2 Measures Indicator to be
Measured
Tool Used to Measure Indicator
Items and/or Scales Used to Assess Indicator
Background Alcohol Knowledge (Do Students display an increase in
background
knowledge of alcohol use?)
Student Pre- and Post-Test
Single Items:
Q1- Which of the following drinks contains the most alcohol?
Q5- In a recent survey of college students at 120 universities, approximately what percentage of students reported that they did not drink more than three or four drinks on three or more occasions over the past two weeks?
Background Knowledge Scale:
Q2- Which group of college students tends to drink the most
Q3- BAL stands for:
Q6- Who is most likely to face negative consequences as a result of drinking?
Knowledge of Health Related Risk (Do students display an increase in knowledge of health-related risk associated with alcohol
consumption?)
Student Pre- and Post-Test
Health Knowledge Scale:
Q4-On average, at what BAL is the “point of diminishing returns’? Q7-The first thing that alcohol affects is:
Q8- On average, a standard drink will raise the BAL of a 140- to 180-pound person:
Q9- Which of the following factors does not influence BAL?
Attitude Toward Excessive Drinking (Do students display a
Student Pre- and Post-Test
32
change in attitudes towards excessive drinking?)
Q10- I think it’s important to be aware of how much I am drinking when I choose to consume alcohol.
Q11- I think a lot of alcohol in a short period of time would put me at risk. Q12- I don’t need to drink alcohol in order to have fun at a party.
Q13- Drinking to get drunk is not worth it.
Q14- I think it’s important to have a plan in mind to limit my drinking before I go to a party.
Q15-My personal goals (e.g., academic, athletic) keep me from drinking too much.
Q16- If a friend passes out from drinking, I would not leave him/her alone to sleep it off.
Q17- I am comfortable turning down a drink at a party if I don’t want it. Q18- I limit my drinking so that I won’t face negative consequences.
Program Effectiveness (Do students consider the CHOICES
Program an effective alcohol abuse
prevention program?)
Student Evaluation Single Item:
Q1- Overall, how would you rate this program
Program Effectiveness Scale:
Q2- How effective were each of the following program components in motivating you to make low-risk drinking choices for yourself? Facts about alcohol
Facts about BAL The biphasic chart
Self-assessment of drinking habits Strategies for reducing risk Interactive Journal/Workbook Your instructor
Group discussion
Behavior Modification
(Are students likely to modify their behavior as a result of the CHOICES Program?)
Student Evaluation Single Item:
33
Results
A reliability analysis was run on the Background Knowledge Scale. Initially the
Background Knowledge Scale was composed of questions 1, 2, 3, 5 and 6 from the pre-
and post-test. With these items the reliability analysis yielded a Cronbach alpha score of
.377 and a mean inter-item correlation of .129 (Tables 6.1 and 6.2). These values
indicated poor internal consistency of the scale. SPSS determined that by removing
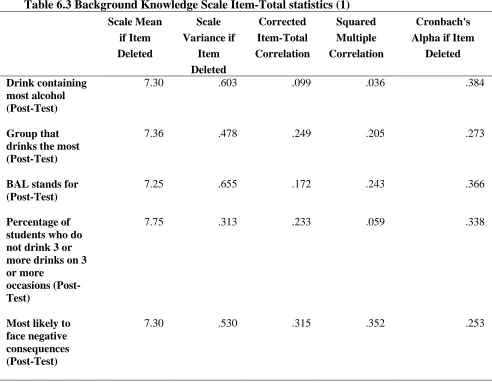
questions 1 and 5 the internal consistency could be improved (Table 6.3). Upon the
removal of these items the reliability analysis yielded a Cronbach alpha score of .461 and
a mean inter-item correlation of .256 (Tables 6.4 and 6.5). Cronbach alpha values are
sensitive to the number of items in a scale; therefore with short scales such as this one it
is not abnormal to find quite low values (a Cronbach alpha coefficient of a scale should
be above .7) (Pallant, 2013). In cases such as this, it is common to report the mean
inter-item correlation for the scale. The recommended optimal range for an inter-inter-item
correlation value is .2 to .4. With an inter-item correlation of .256 this scale has good
internal consistency.
Table 6.1 Background Knowledge Scale Reliability Statistics (1)
Cronbach’s Alpha Cronbach’s Alpha Based on Standardized Items
Number of Items
.377 .425 5
Table 6.2 Background Knowledge Scale Summary Item Statistics (1)
34
Inter-Item Correlations
[image:35.612.66.558.165.554.2].129 -.064 .436 .500 -6.804 .026 5
Table 6.3 Background Knowledge Scale Item-Total statistics (1) Scale Mean if Item Deleted Scale Variance if Item Deleted Corrected Item-Total Correlation Squared Multiple Correlation Cronbach's Alpha if Item
Deleted
Drink containing most alcohol (Post-Test)
7.30 .603 .099 .036 .384
Group that drinks the most (Post-Test)
7.36 .478 .249 .205 .273
BAL stands for (Post-Test)
7.25 .655 .172 .243 .366
Percentage of students who do not drink 3 or more drinks on 3 or more
occasions (Post-Test)
7.75 .313 .233 .059 .338
Most likely to face negative consequences (Post-Test)
7.30 .530 .315 .352 .253
Table 6.4 Background Knowledge Scale Reliability Statistics (2)
Cronbach’s Alpha Cronbach’s Alpha Based on Standardized Items
Number of Items
.461 .508 3
Table 6.5 Background Knowledge Scale Summary Item Statistics (2)
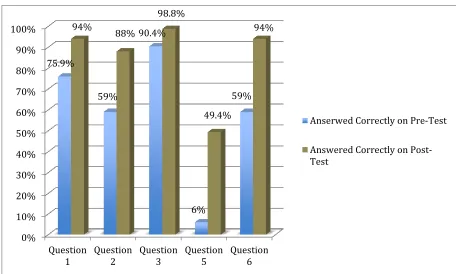
35 0% 10% 20% 30% 40% 50% 60% 70% 80% 90% 100% Question
1 Question2 Question3 Question5 Question6 75.9% 59% 90.4% 6% 59% 94% 88% 98.8% 49.4% 94%
Anserwed Correctly on Pre-Test
Answered Correctly on Post-Test
Inter-Item Correlations
.256 -.041 .436 .477 -10.671 .054 3
Frequencies were run on the responses for questions 1,2,3,5 and 6. These results
can be seen in figure 6.1. The responses for the pre- and post-test scores were coded as 2
for a correct response and 1 for an incorrect response. Using this code the highest
students could score on the background knowledge scale was a 6 and the lowest they
could score was a 3 (larger numbers indicating a higher level of background knowledge).
Frequencies were run on the background knowledge scores from both the pre- and
post-test. Figure 6.2 depicts the change in background knowledge scores from the pre-test to
the post-test. A paired-sample t-test was conducted to evaluate the impact CHOICES had
on students’ background knowledge of alcohol. There was a statistically significant
increase in background knowledge scores from the pre-test (M = 5.084, SD = .71916) to
the post-test (M= 5.8072, SD= .50504), t (82) = -8.382, P< .001 (two-tailed) (Table 6.6).
The mean increase in scores was .722 with a 95% confidence interval ranging from
[image:36.612.73.529.508.782.2]-.89446 to -.55132 (Table 6.7). The eta-squared statistic (.46) indicated a large effect size.
36 0% 10% 20% 30% 40% 50% 60% 70% 80% 90%
Score of 3 Score of 4 Score of 5 Score of 6 1.2% 18.10% 51.8% 28.9% 0% 4.8% 9.6% 85.5%
Background Knowledge Scores Pre-Test
[image:37.612.71.540.90.433.2]Background Knowledge Scores Post-Test
Figure 6.2 Background Knowledge Scores
Table 6.6 Background Knowledge Scale Paired-Sample Statistics
Mean Number Std. Deviation Std. Error Mean Pre-Test 5.0843 83 .71916 .07894
Post-Test 5.802 83 .50504 .05544
Table 6.7 Background Knowledge Scale Paired-Samples Test
Mean Std. Deviation
Std. Error Mean
95% Confidence Interval of the
Difference
Lower Upper
t df Sig. (2-tailed)
Background Knowledge Pre- and Post-Test
37
A reliability analysis was run on the Health Knowledge Scale. The Health
Knowledge scale is composed of questions 4, 7, 8 and 9 from the pre- and post-tests.
With these items the reliability analysis yielded an inter-item correlation mean of .258
indicating that the scale has good internal consistency (table 6.8). Frequencies were run
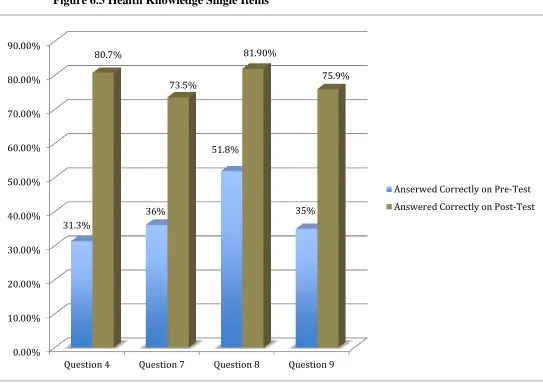
on the responses for questions 4, 7, 8 and 9. The results are shown in figure 6.3. The
responses for the pre- and post-test scores were coded as 2 for a correct response and 1
for an incorrect response. Using this code the highest students could score on the health
knowledge scale was an 8 and the lowest they could score was a 4 (larger numbers
indicating a higher level of knowledge of health-related risk associated with alcohol
consumption). Frequencies were run on the background knowledge scores from both the
and post-test. Figure 6.4 depicts the change in health knowledge scores from the
pre-test to the post-pre-test. A paired-sample t-pre-test was conducted to evaluate the impact
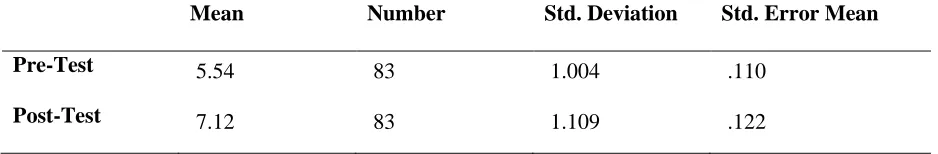
CHOICES had on students’ health knowledge of alcohol. There was a statistically
significant increase in health knowledge scores from the pre-test (M = 5.54, SD = 1.004)
to the post-test (M= 7.12, SD= 1.0084), t (82) = -10.995, P< .001 (two-tailed) (Table 6.9).
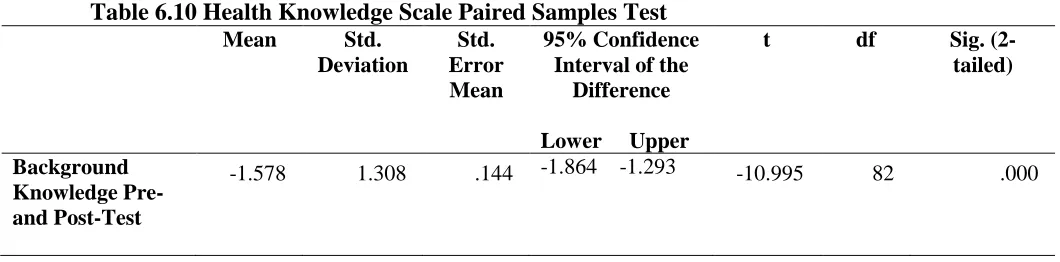
The mean increase in scores was 1.578 with a 95% confidence interval ranging from
-1.864 to -1.293 (Table 6.10). The eta-squared statistic (.59) indicated a large effect size.
Table 6.8 Health Knowledge Scale Summary Item Statistics
Mean Minimum Maximum Range Max/ Min Variance Number of Items
Inter-Item Correlations
38
Figure 6.3 Health Knowledge Single Items
0.00% 10.00% 20.00% 30.00% 40.00% 50.00% 60.00% 70.00% 80.00% 90.00%
Question 4 Question 7 Question 8 Question 9 31.3%
36%
51.8%
35% 80.7%
73.5%
81.90%
75.9%
39
[image:40.612.89.558.528.605.2]Figure 6.4 Health Knowledge Scores
Table 6.9 Health Knowledge Scale Paired Sample Statistics
Mean Number Std. Deviation Std. Error Mean
Pre-Test 5.54 83 1.004 .110
Post-Test 7.12 83 1.109 .122
0% 10% 20% 30% 40% 50% 60%
Score of 4 Score of 5 Score of 6 Score of 7 Score of 8 15.7%
33.7% 33.7%
14.5%
2.40% 3.6%
6%
15.7%
24.1%
50.6%
40
Table 6.10 Health Knowledge Scale Paired Samples Test
Mean Std. Deviation
Std. Error Mean
95% Confidence Interval of the
Difference
Lower Upper
t df Sig. (2-tailed)
Background Knowledge Pre- and Post-Test
-1.578 1.308 .144 -1.864 -1.293 -10.995 82 .000
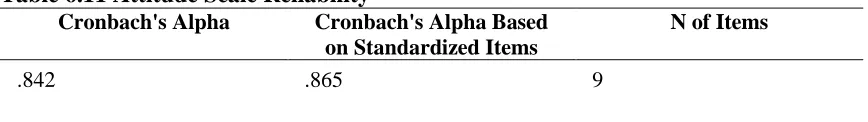
A reliability analysis was run on the Attitude Scale. The Attitude Scale is
composed of questions 10 through 18 from the pre- and post-tests. With these items the
reliability analysis yielded a Cronbach Alpha value of .842 indicating that the scale has
strong internal consistency (table 6.11). Frequencies were run on the responses for
questions 10 through 18 and the results are shown in figure 6.5. The responses for the
pre- and post-test scores were coded as 1 for strongly disagree, 2 for disagree, 3 for agree
and 4 for strongly agree. Using this code the highest students could score on the Change
in Attitudes Scale was a 36 and the lowest they could score was a 9 (larger numbers
indicating a more positive attitude change). Frequencies were run on attitude scores from
both the and post-test. Figure 6.6 depicts the change in attitude scores from the
pre-test to the post-pre-test. A paired-sample t-pre-test was conducted to evaluate the impact
CHOICES had on students’ change in attitude. There was a statistically significant
increase in attitude scores from the pre-test (M = 31.29, SD = 3.568) to the post-test (M=
33.09, SD= 3.327), t (81) = -5.220, P< .001 (two-tailed) (Table 6.12). The mean increase
in scores was -1.793 with a 95% confidence interval ranging from -2.476 to -1.109 (Table
41 0% 10% 20% 30% 40% 50% 60% 70% 80% 90% 100%
Question 10 Question 11 Question 12 Question 13 Question 14 Question 15 Question 16 Question 17 Question 18
96.4% 95.1% 92.7%
74.4%
92.6%
88% 92.8%
100% 97.5%
100% 100% 97.6%
84.3%
98.8%
89.2%
95.1%
100% 97.6%
[image:42.612.90.524.82.143.2]Agreed or Strongly Agreeed on Pre-Test Agreed or Strongly Agreed on Post-Test Table 6.11 Attitude Scale Reliability
Cronbach's Alpha Cronbach's Alpha Based on Standardized Items
N of Items
.842 .865 9
[image:42.612.35.568.210.679.2]42 0% 5% 10% 15% 20% 25% 30% 35% 40% Score of
23 Score of25 Score of26 Score of27 Score of28 Score of29 Score of30 Score of31 Score of32 Score of33 Score of34 Score of35 Score of36
1.2% 3.7% 7.3% 6.1% 7.3% 6.1% 11% 8.5% 4.9% 12.2% 7.3% 6.1% 18.3% 0% 0% 3.6% 7.2% 4.8% 3.6% 4.8% 6% 4.8% 6% 9.6% 12% 37.3%
[image:43.612.21.580.106.590.2]43
Table 6.12 Attitude Scale Paired Sample Statistics
Mean Number Std. Deviation Std. Error Mean Pre-Test 31.29 82 3.568 .394
Post-Test 33.09 82 3.327 .367
Table 6.13 Attitude Scale Paired Sample Test
Mean Std. Deviation
Std. Error Mean
95% Confidence Interval of the
Difference
Lower Upper
t df Sig. (2-tailed)
Background Knowledge Pre- and Post-Test
-1.793 3.110 .343 -2.476 -1.109 -5.220 81 .000
Frequencies were run on question 1 of the evaluation. This question asked for
[image:44.612.90.471.467.706.2]students to give the program an overall rating. The responses are depicted in figure 6.7. Over half of students gave the program an overall rating of “Excellent”.
Figure 6.7 Overall Program Rating
6%
38.6% 55.4%
44
A reliability analysis was run on the Program Effectiveness Scale from question
number 2 of the evaluation. The Program Effectiveness Scale is composed of 8 program
components. The reliability analysis yielded a Cronbach Alpha value of .855 indicating
that the scale has strong internal consistency (table 6.14). The responses for the scale
were coded as 1 for not applicable, 2 for not effective, 3 for somewhat effective and 4 for
very effective. Using this code the highest students could score on the Program
Effectiveness Scale was 32 and the lowest they could score was 8 (larger numbers
indicating higher levels of perceived program effectiveness). Frequencies were run on the
scores of the Program Effectiveness Scale and are reported in figure 6.7. 60.6% of
students scored above a 28 on the scale.
Table 6.14 Program Effectiveness Scale Reliability Analysis
Cronbach's Alpha Cronbach's Alpha Based on Standardized Items
N of Items
45
Figure 6.7 Program Effectiveness Scores
Frequencies were run on question 8 of the evaluation. This question asked
students how likely they are to change some aspect of their alcohol-related behavior as a
result of the CHOICES Program. The responses are depicted in figure 6.8. 60.7% of
students reported that they would definitely change some aspect of their alcohol-related
behavior as a result of the CHOICES Program. 0%
5% 10% 15% 20% 25% 30% 35% 40%
Score
of 17 Scoreof 18 Scoreof 21 Scoreof 24 Scoreof 25 Scoreof 26 Scoreof 27 Scoreof 28 Scoreof 29 Scoreof 30 Scoreof 31 Scoreof 32
1.2% 1.2% 2.4% 8.3%
6.0% 6.0%
10.7%
3.6% 9.5%
7.1% 8.3%
46
Graph 6.8 Likelihood of Changing Alcohol-Related Behavior
Six independent samples t-test were conducted to compare the background
knowledge, health knowledge and attitude scores for males and females on the pre- and
the post-tests. The student participants were 41% female and 59% male. The only
statistically significant differences were found in the scores for background knowledge.
There was a statistically significant difference on the pre-test between males (M= 4.9388
SD= .61237) and females (M= 5.2941 SD= .62906; t(81)= -2.269, P= .026, two-tailed)
(Table 6.15). The magnitude of the differences in the means (mean difference = .36 CI:
-.66694 to -.04374) was small (eta squared= .012). There was also a statistically
significant difference on the post-test between males (M= 5.7143 SD= .61237) and
females (M= 5.9412 SD= .23883; t(66.69)= -2.349, P= .022, two-tailed) (Table 6.16).
The magnitude of the differences in the means (mean difference = .23 CI: .41971 to
-11%
29% 60.7%
47
.03407) was small (eta squared= .012). These findings indicate that females who
participate in CHOICES have higher pre-existing background knowledge of alcohol use,
and higher background knowledge of alcohol use after the completion of CHOICES.
Table 6.15 (Pre-Test) Background Knowledge Independent-Samples T-test (males and females)
Levene’s test for equality of variances F Sig
t df Sig. (two-tailed) Mean Difference Std. Error Difference 95% Confidence Interval of Difference
Lower Upper Equal variance
assumed
.000 .993 -2.269 81 .026 -.35534 .15661 -.66694 -.04374
Equal variance
not assumed -2.341 77.917 .022 -.35534 .15179 -.65754 -.05315
Table 6.16 (Post-Test) Background Knowledge Independent-Samples T-test (males and females)
Levene’s test for equality of variances F Sig
t df Sig. (two-tailed) Mean Difference Std. Error Difference 95% Confidence Interval of Difference
Lower Upper Equal variance
assumed 20.632 .000 .000 81 .043 -.22689 .11058 -.44692 -.00686
Equal variance
not assumed -2.349 66.690 .022 -.22689 .09660 -.41971 -.03407
Summary of key results
There was a statistically significant increase in background knowledge scores
from the pre-test to the post-test. There was also a noticeable increase in correct
responses for the single items question 1 and 5. These results indicate that students who
complete CHOICES display an increase in background knowledge of alcohol use. There
was also a statistically significant increase in health knowledge scores from the pre-test to
[image:48.612.62.576.195.333.2] [image:48.612.60.575.384.519.2]48
knowledge of health-related risk associated with alcohol consumption. Statistical
significance was also found in the increase of student’s attitude scores from the pre-test to
the post-test, indicating that students who complete CHOICES display a change in
attitude towards excessive drinking. Males and females tended to score around the same
on the Attitude Scale and the Health Knowledge Scale, but female scores were
significantly higher than males on the Background Knowledge Scale.
55.6% of students gave CHOICES an overall rating of “excellent” and
38.6% gave it a rating of “good”. Also, 60.6% of students scored above a 28 on the
Program Effectiveness Scale. These results indicate that students consider CHOICES an
effective alcohol abuse prevention program. 60.7% of students reported that they would “definitely” change some aspect of their alcohol-related behavior as a result of the
CHOICES Program. 29% reported “maybe”. These results indicate that the majority of
49
Discussion
Recommendations
Students who complete CHOICES leave with an increase in knowledge and a
willingness to modify behavior. Some small enhancements in the implementation and
ongoing program monitoring may raise the effectiveness of CHOICES and increase
program efficiency.
A few outliers were present in the pre- and post-tests data. There were a small
number of cases where pre-test scores were higher than post-test scores. This could be
attributed to some students’ apathy towards participation in the program. Requiring a
passing grade on the post-test will encourage students to be more engaged in the program
content and will aid in evaluating the continued effectiveness of CHOICES. Requiring a
passing grade on the post-test will more than likely have no effect on student’s attitudes
towards drinking, but potentially could raise the likelihood of students retaining
background knowledge of alcohol consumption and knowledge of the health-related risks
associated with alcohol consumption.
During the pre-assessment phase of the program demographic data is collected on
the students. Once ongoing program monitoring commences it will be important to assess
the differences in program outcomes between different genders, ethnicities and racial
backgrounds. To simplify the evaluation process students should also complete a short
demographic survey at the beginning of their first CHOICES session that, upon
50
Scheduling face-to-face follow-up meetings with students three to four months
after the completion of CHOICES will enhance the continued evaluation of the program.
This will give students a chance to report their most recent alcohol expectancies and
drinking behavior allowing for further evaluation of the program’s effectiveness. This
will also be an opportunity for further motivational interviewing if necessary. Along with
follow-ups, regular evaluation of CHOICES should be completed to monitor the
effectiveness of the program and explore ways to broaden its impact on the student
participants. Future evaluations should also include the assessment of the qualitative data
provided by the course evaluation. This could lead to program enhancements. The
Department of Student Health Promotion employs three Graduate Assistants (GAs),
giving one of the GAs the responsibility of overseeing the continued evaluation of
CHOICES will ensure the timely collection and analysis of data.
Strengths and Limitations
The results of this evaluation were significant and generalizable largely because
of the sample size. There were 88 students who participated in CHOICES from May
2013 to December 2013. Pre- and post-test data was collected from 83 participants, and
evaluation data was collected from 84 participants. The large sample size of this
evaluation was one of its greatest strengths. The tools used for this evaluation (the pre-
and post-test and the course evaluation) were created by the authors of the CHOICES
curriculum and strategically composed of items that assess the program outcomes of
CHOICES. The use of these tools was another key strength of this evaluation.
Upon completion of CHOICES students participate in the Brief Alcohol
51
to reduce alcohol use in order to decrease the negative consequences associated with
drinking (Parks, 2014). It is delivered over the course of two 1-hour interview sessions.
Occasionally students come for more than two sessions depending on their motivation to
change. The assessment of BASICS was not a part of this evaluation and therefore the
outcomes of this evaluation may be an underestimate of student’s attitudes towards
drinking upon completing the entire CHOICES process in the Counseling and Testing
Center at Georgia State. Ongoing monitoring of CHOICES and future evaluations should
include evaluation data from CHOICES as well as BASICS.
Due to the lack of access to demographic data all data analyzation of male and
female differences was subject to bias. In this evaluation gender was assigned based on
the names of participants. Self-reporting of willingness to change and effectiveness of the
program on the course evaluation also introduced bias and therefore is a limitation of this
evaluation as well.
Lastly, the lack of follow-up limits the extent to which program effectiveness can
be evaluated. Students who report that it is highly likely for them to modify their
behavior as a result of CHOICES may or may not actually modify behavior. Students
who display an increase in knowledge of alcohol consumption and the risk associated
with it after the completion of CHOICES may or may not retain the information learned
over an extended period of time.
Contribution to public health
CHOICES at Georgia State has proven to be an effective alcohol abuse prevention
program. Students who participate in CHOICES leave the program with increased
52
safer choices related to drinking. College students are one of the most high-risk groups
for binge drinking, drinking and driving, and sexual assault crimes related to drinking.
Alcohol abuse prevention programs, such as CHOICES, play a vital role in addressing