www.hydrol-earth-syst-sci.net/14/271/2010/ © Author(s) 2010. This work is distributed under the Creative Commons Attribution 3.0 License.
Earth System
Sciences
Technical Note: Comparing and ranking soil drought indices
performance over Europe, through remote-sensing of vegetation
E. Peled1, E. Dutra2, P. Viterbo2,3, and A. Angert1
1The Institute of Earth Sciences, The Hebrew University of Jerusalem, Jerusalem 91904, Israel 2IDL, CGUL, University of Lisbon, Lisbon, Portugal
3Institute of Meteorology, Lisbon, Portugal
Received: 24 August 2009 – Published in Hydrol. Earth Syst. Sci. Discuss.: 5 October 2009 Revised: 27 January 2010 – Accepted: 8 February 2010 – Published: 12 February 2010
Abstract. In the past years there have been many attempts to produce and improve global soil-moisture datasets and drought indices. However, comparing and validating these various datasets is not straightforward. Here, interannual variations in drought indices are compared to interannual changes in vegetation, as captured by NDVI. By comparing the correlations of the different indices with NDVI we evalu-ated which drought index describes most realistically the ac-tual changes in vegetation. Strong correlation between NDVI and the drought indices were found in areas that are classified as warm temperate climate with hot or warm dry summers. In these areas we ranked the PDSI, PSDI-SC, SPI3, and NSM indices, based on the interannual correlation with NDVI, and found that NSM outperformed the rest. Using this best per-forming index, and the ICA (Independent Component Anal-ysis) technique, we analyzed the response of vegetation to temperature and soil-moisture stresses over Europe.
1 Introduction
Having reliable information on the spatial and temporal vari-ability of soil-moisture is a key to many practical and sci-entific problems. Reliable soil-moisture data crucially im-prove long-term weather forecasts (Seneviratne et al., 2006; Ferranti and Viterbo, 2006), and help to prepare better for drought. In addition, long-term changes in soil-moisture and especially droughts, induced by climate-change (Sheffield and Wood, 2007), can have important effects on the
ter-Correspondence to: A. Angert
restrial biosphere, which feedback into the climate system through the carbon cycle (Angert et al., 2005; Fung et al., 2005).
Given these needs, there have been many attempts to pro-duce and improve global soil-moisture and drought indices datasets (Dai et al., 2004; Dutra et al., 2008; McKee et al., 1993; Palmer, 1965; Wells et al., 2004). Allegedly, some of these datasets have advantages over others. However, com-paring and validating these various datasets is not an easy task.
Ground-based soil-moisture measurements are accurate, but hard to compare to the large scale datasets because of their point-based nature, their limited coverage, and the well-known high spatial variability of soils. Remote sensing meth-ods on the other hand, provide extensive spatial and temporal coverage of soil-moisture, but these methods can only sense the top few centimeters of soil, and become less sensitive to soil-moisture in vegetated regions as the vegetation wa-ter content increases (Wang et al., 2007). Another approach focuses on assessing soil-moisture, not by modeling, but by remote sensing of vegetation.
controlling vegetation and factors like temperature and man-agement can also come into play. Using NDWI (Normalized Difference Water Index) instead of NDVI did not produce improved correlations (Gu et al., 2008).
Due to the limitations of the various methods for val-idating soil-moisture indices discussed above, we suggest here a somewhat different approach for using the NDVI sig-nal. In the current study, interannual variations in indices for drought are compared to interannual changes in vegeta-tion, as captured by NDVI. The NDVI signal is affected by changes in vegetation leaf area and chlorophyll content, in-duced not only by soils-moisture but also by other natural and anthropogenic factors such as temperature, and manage-ment. However, in areas and seasons in which soil-moisture is the main limiting factor, a better drought (as an indicator of soil-moisture stress) estimate will result in a better cor-relation with NDVI. Thus, comparing the corcor-relation of the different indices with NDVI will enable to evaluate which drought index provides the most reliable representation of water stress. This is of course true only if all drought indices are derived independently of NDVI (for example, no opti-cal reflectance data were used to create them). One should emphasize that the correlation for a single pixel may be ran-domly high. However, by integrating large areas, and by focusing on long time series of interannual variability, we mostly eliminate this problem. We have set our focus on the time of year when drought stress is mostly expected – namely summer (and to a lesser extent, spring). In addition to rank-ing the drought indices based on correlation with NDVI, we have explored the spatial distribution of this correlation, and its relationship with other variables. In particular we have looked on how the relationship between soil-moisture and NDVI changes with land-cover.
It must be stressed that in our view, NDVI cannot serve as a direct proxy for soil-moisture, both because no NDVI dataset captures perfectly the changes in vegetation, and be-cause of the other, natural and manmade, factors which con-trol vegetation (mentioned above). In a perfect situation, val-idation and ranking of drought indices would be done ver-sus in-situ measurements. In practice however, the extent of datasets covering in-situ, point based, measurements, is far from providing a complete temporal and spatial coverage, against which large-scale drought products can be tested. Thus, while point based measurement will continue to be the primary source for validation, the NDVI approach we sug-gest here can be very useful in complementing it.
2 Data and methods
2.1 Drought indices
In the current research we have used five indices for drought.
2.1.1 The Palmer Drought Severity Index (PDSI)
This index is a standardized measure of surface soil-moisture conditions which integrates moisture inputs (precipitation), and outputs (drainage and evapotranspiration) as well as the local Available Water Content (AWC) of the soil. Here, we have used the global PDSI calculated by Dai et al. (2004) at a resolution of 2.5◦ by 2.5◦, based on observed monthly surface air temperature and precipitation.
Despite its popularity, PDSI has several limitations; these include an inherent time scale, and the uncertainty of the in-dex to the amount of water available for plant use in different soil types. A common critique of the PDSI is that the behav-ior of the index at various locations is inconsistent, making spatial comparisons of PDSI values difficult (Heim, 2002; Lloyd-Hughes and Saunders, 2002; Sims et al., 2002). 2.1.2 The Self-Calibrating PDSI (SC-PDSI)
This index was suggested to be a more appropriate index for geographical comparison of climates of diverse regions (Wells et al., 2004). SC-PDSI improves the performance of the PDSI by automating the calculations of the empiri-cal constants used in the PDSI algorithm. This was achieved by determining, for each location, the climatic characteristic weighting factor (K) using the historical climatic data from only that location. In a similar way, the duration factors are calculated separately for wet and dry spells, thus influenc-ing the sensitivity of the index for changes in the moisture regime (Van Der Schrier et al., 2006). Due to the computed modifications, the SC-PDSI is claimed to behave in a con-sistent, predictable manner as well as to represent the cli-mates of diverse locations in a more realistic way (Wells et al., 2004). We have used a 0.5◦grid, monthly temporal reso-lution dataset (Van Der Schrier et al., 2006).
2.1.3 The Standardized Precipitation Index (SPI)
correlations with NDVI (Ji and Peters, 2003). The SPI3 was calculated from two precipitation datasets:
1. The Global Precipitation Climatology Project (GPCP), which merges data from over 6000 rain gauge stations and from satellite observations into a 2.5◦global grid, monthly rainfall dataset (Xie et al., 2003).
2. The European Centre for Medium-Range Weather Fore-casts (ECMWF) Re-Analysis project (ERA-40), which produces a long time-series of consistent meteorologi-cal analyses based on simulations with the best-fit be-tween modeled results and observations (Uppala et al., 2005). We have used the 1◦spatial resolution and av-eraged over the daily precipitation accumulation data to monthly temporal resolution.
2.1.4 The Normalized total depth Soil Moisture (NSM)
The Normalized total depth Soil Moisture is a model-based drought index proposed recently (Dutra et al., 2008). This index represents the standardize anomalies in soil-moisture. Soil-moisture is calculated by the TESSEL land surface model (Viterbo and Beljaars, 1995; Van den Hurk et al., 2000) forced by the ERA-40 precipitation, downwelling ra-diation and near surface meteorology. The model uses four soil layers that vary in depth (0–7, 7–28, 28–100 and 100– 289 cm). The NSM is based on the integrated soil-moisture over these four layers. So far the NSM dataset is available for Europe. The model output 1◦spatial resolution was averaged into monthly time scale.
2.2 NDVI data
In this study, we have used the Global Inventory Modeling and Mapping Studies (GIMMS) version-g NDVI dataset on 1◦by 1◦, and 8 km spatial resolutions and monthly temporal resolution from 1982 to 2002 (Pinzon et al., 2005; Tucker et al., 2005).
2.3 Land-cover data
The Vegetation Continuous Fields (VCF) collection contains estimates of the proportional coverage of woody vegetation, herbaceous vegetation, and bare ground in each grid-cell (500 m resolution). The product is derived from all seven bands of the MODerate-resolution Imaging Spectroradiome-ter (MODIS) sensor onboard NASA’s Terra satellite (Hansen et al., 2003a, b).
2.4 Statistical analyses
All drought indices datasets were re-gridded to 1◦by 1◦by linear interpolation (or by averaging), to enable comparison with the NDVI dataset.
For NDVI (1◦ resolution) and for each drought index, the average summer (June, July, August – JJA) and spring
(March, April, May – MAM) values were calculated for ev-ery grid cell in Europe for the period 1982–2002 (45X66 grid cells). The interannual variability was captured by calculat-ing the JJA and MAM normalized anomalies.
The linear correlation coefficient (r) between the time se-ries of NDVI anomalies and the soil-moisture anomalies in each of the indices was calculated for every grid cell in Eu-rope. In addition, we have calculated the linear correlation coefficient (r) between the time series of area-mean NDVI anomalies and the area-mean soil-moisture anomalies, for specific areas (see results and discussion). We have also applied to the NDVI data set the Independent Component Analysis (ICA), which is an advanced method for separating a multivariate signal into additive subcomponents (Hyvrinen and Oja, 2000). By this analysis we have tried to separate the response of NDVI to temperature and soil-water stress.
One area, Iberia, was chosen for a more detailed case study, in which we examined the correlation between NSM and NDVI at higher resolution of 16 km (re-gridded from the 8km dataset), and the relations between the strength of this correlation and land-cover.
3 Results and discussion
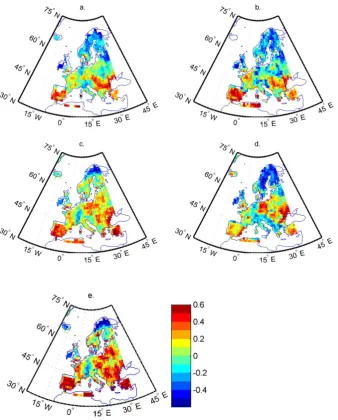
The strength of the correlation between summer NDVI and each drought index is shown in Fig. 1. The correlation maps show few broad areas, where positive correlations are evident in all indices. Other, mostly northern areas, show negative correlation, which is probably related to the correlation be-tween summer temperature and precipitation, and the strong control of temperature on vegetation in these areas. Some areas show positive correlation only with part of the indices. For example, the SPI3-EMCWF and SPI3-GPCP maps show strong correlation in parts of Eastern Europe. However, for all indices, significant positive correlations were found in the rectangle areas covering Iberia (9.5◦W–0.5◦W, 36.5◦N– 43.5◦N), parts of North Africa (6.5◦W–11.5◦E, 35.5◦N– 37.5◦N) and Western Turkey (26.5◦E–31.5◦E, 36.5◦N– 41.5◦N). In these areas, the mean correlation coefficient (r) exceeded 0.4 in the two best performing indices, NSM and SC-PDSI, and the mean p-value was<0.01 (P is<0.01 for r >0.51 andp <0.05 forr >0.37). For these three areas, we have also calculated the correlation between the time-series of NDVI (averaged over each area), and drought indices (also averaged over each area). This averaging brought all datasets to the same (very coarse) resolution, and thus removed bias caused by the different original resolutions.
Fig. 1. Coefficients (r) of correlation between interannual anomalies in Europe JJA NDVI and soil moisture indices: PDSI (a), SC-PDSI (b), SPI3-EMCWF (c), SPI3-GPCP (d) and NSM (e).
Table 1. Correlation coefficients (r) between the (area-mean) in-terannual variability in summer (JJA) NDVI and soil-moisture esti-mated by various indices.
SPI3- SPI3- PDSI SC- NSM NSMS
GPCP EMCWF PDSI
Iberia 0.33 0.71 0.70 0.73 0.78 0.80
N. Africa 0.33 0.68 0.67 0.78 0.76 0.84
W. Turkey 0.31 0.65 0.45 0.56 0.78 0.79
although the former is based on observed precipitation, and the later on modeled one. As we have expected, the corre-lations between soil-moisture and NDVI in spring (MAM)
are not significant in Iberia and Western Turkey (r <0.04 for NSM), and much weaker than in summer in Northern Africa (r=0.25 for NSM versusr=0.76 in summer). This is since soil moisture stress (and the respective drought stress) and its impact on vegetation is higher in summer when compared to spring.
[image:4.595.51.285.587.649.2]Table 2. The mean coefficient of correlation (r) between interan-nual variability in summer NDVI of 16 km by 16 km grid-cells in Iberia, and NSM, stratified by fractional land cover.
r Grass Cover r Tree Cover r Bare Cover
0.15 0–40% 0.35 0–5% 0.22 0–5%
0.26 40–60% 0.30 5–15% 0.30 5–10%
0.31 60–70% 0.28 15–30% 0.32 10–20%
0.30 70–80% 0.21 30–40% 0.37 20–30%
0.30 80–90% 0.18 40–60% 0.44 30–40%
0.25 90–100% 0.14 60–100% 0.44 40–100%
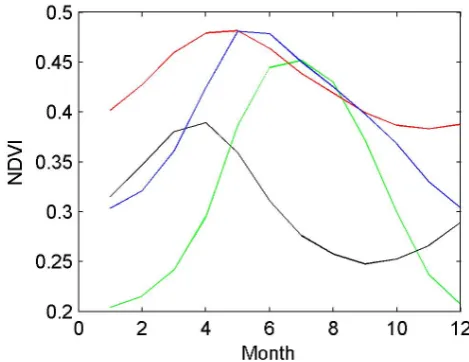
as warm temperate climate (CS) with hot (CSa) or warm (Csb) dry summers. In agreement, the NDVI in these ar-eas is reduced in summer, while the mean for Europe shows seasonal maximum at this time (Fig. 2). We have also found no significant correlation (at P <0.05) between in-terannual variation in JJA temperature and NDVI at these re-gions, which strengthen the conclusion that soil-moisture is the leading source of variability. In addition, the plant func-tional type (PFT) distribution in these areas is different than those of the rest of Europe. According to the Vegetation Con-tinuous Fields dataset (Hansen et al., 2003b), the percentage of area not cover by trees is 85% in Iberia, 95% in Northern-Africa, and 84% in Western-Turkey, while only 78% in entire Europe. Finding theses high NDVI-drought correlations ex-actly where they are expected, i.e., water limited ecosystems, support our claim that the NDVI signal can be used for rank-ing drought indices.
We have performed a more detailed case study for Iberia, using a 16km spatial resolution NDVI dataset (Table 2). The correlations coefficient in this resolution was found to be much lower than that obtained when correlating the time se-ries of each broad geographical area (Table 1). The signif-icant correlations in areas classified as “bare soil” indicate that at least some of these areas are sometime vegetated. The correlation with NSM was found to increase with lower tree cover. Hence, it seems that the response of grasses to soil-moisture stress is higher. Grasses, in contrast to trees, have no access to deep soil water, and as a result, we have ex-pected that areas with low tree cover will have better corre-lation with the normalized soil-water of the first three model layers (down to 100 cm depth) that are used to derive NSM, than with NSM itself. Indeed, the correlation (r) of NDVI at 16km resolution with the normalized soil-water in the surface layers (which we named NSMS – Normalized Soil Moisture at the Surface) at grid-cells where the tree cover is less than 10%, is 0.39 on average, versus 0.33 for the same grid-cells when we use all layers (NSM). In grid-cells where the tree-cover was high (>50%) the correlation of NDVI with the fourth layer (100 cm to 289 cm) was not significant (r=0.19) as was the correlation with NSM (r=0.13). It is possible that in areas with high tree-cover the
Photochemi-Fig. 2. Mean seasonal changes in NDVI over Europe (green), Iberia
(red), Northern Africa (black) and Western Turkey (blue).
cal Reflectance Index (PRI) will be better suited for tracing drought stress than NDVI (Goerner et al., 2009). A follow-up study should also investigate if there is a different response for evergreen and deciduous trees, as well as time lags be-tween drought-stress at monthly time resolution, and vegeta-tion response.
Based on the above results, we have calculated also the correlation of NDVI in 1◦degree resolution with NSMS. The results, summarized in Table 1, show that NSMS is better correlated with vegetation than NSM, in the three geographi-cal areas with relatively high correlations. Moreover, NSMS had higher correlations than any other drought index; mak-ing it the most reliable one based on the criterion we have defined. The higher correlation of tree-covered surface with the fourth layer indicates that NSM also has good reliability, when the interest is estimating the soil-moisture anomalies also at deeper levels. The highly parameterized formulation of PDSI, or the simple approach of the SPI was shown to be less reliable than the more physically based water balance of the NSM, including its four layer structure. These factors seem to be major ones, and not so much the forcing data, since both the NSM and one of the SPI indices were driven by the same ERA-40 precipitation.
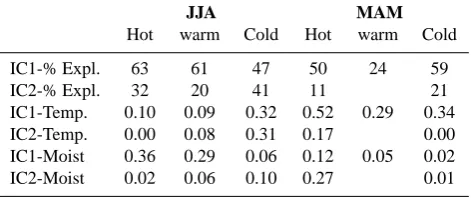
[image:5.595.51.285.110.194.2]Table 3. ICA analysis results for summer (JJA) and spring (MAM)
NDVI for three regions of Europe, separated by the mean sum-mer temperature. Displayed is the percentage of NDVI variance explained by the two leading IC’s, and the coefficient of determina-tion (r2)between each IC and the regions anomalies of temperature and soil moisture (NSM). Empty fields indicate that no second IC was found.
JJA MAM
Hot warm Cold Hot warm Cold
IC1-% Expl. 63 61 47 50 24 59
IC2-% Expl. 32 20 41 11 21
IC1-Temp. 0.10 0.09 0.32 0.52 0.29 0.34 IC2-Temp. 0.00 0.08 0.31 0.17 0.00 IC1-Moist 0.36 0.29 0.06 0.12 0.05 0.02 IC2-Moist 0.02 0.06 0.10 0.27 0.01
This process was then repeated for MAM. The results, summarized in Table 3, indicate that in summer the leading ICs for the hot and warm regions are correlated only with soil-moisture, and there is no evidence for temperature effect on NDVI. In contrast, the hot and warm regions do show de-pendence of NDVI on temperature in spring, and only a weak soil-moisture effect. The cold region shows only temperature effect both in summer and spring. These results indicate that in areas with mean summer temperature above 16◦C, it is possible to separate the contribution of temperature and pre-cipitation on NDVI (and maybe also productivity) by focus-ing on different seasons.
4 Conclusions
The correlations between interannual variations in NDVI and the drought indices are highest in areas with hot and dry summers, as expected. Higher correlation is associated with grassland than with forests. The NSMS index was found to have the highest correlation with NDVI, having the best representation of the interannual variations in the surface soil-moisture stress. NSM carries additional information on deeper soil-moisture. These results have obvious implica-tions for further soil-moisture based studies. ICA analysis of entire Europe found that in areas with summer temperature above 16◦C, the vegetation (as captured by NDVI) responses in summer, on the interannual time scale, only to variation in drought-stress and not to temperature. However, in spring the vegetation in these areas does show sensitivity to temper-ature. These findings have implication for change in vegeta-tion and the carbon cycle under changing climate.
Acknowledgements. We thank Efrat Morin for fruitful discussion, and two anonymous reviewers for their comments. This research was supported by a grant from the Ring Foundation.
Edited by: W. Wagner
References
Angert, A., Biraud, S., Bonfils, C., Henning, C. C., Buermann, W., Pinzon, J., Tucker, C. J., and Fung, I.: Drier summers cancel out the CO2uptake enhancement induced by warmer springs, P. Natl. Acad. Sci. USA, 102, 10823–10827, 2005.
Dai, A. G., Trenberth, K. E., and Qian, T. T.: A global dataset of Palmer Drought Severity Index for 1870-2002: Relationship with soil moisture and effects of surface warming, J. Hydrometeorol., 5, 1117–1130, 2004.
Dutra, E., Viterbo, P., and Miranda, P. M. A.: ERA-40 reanalysis hydrological applications in the characteriza-tion of regional drought, Geophys. Res. Lett., 35, L19402, doi:10.1029/2008GL035381, 2008.
Ferranti, L. and Viterbo, P.: The European summer of 2003: Sensi-tivity to soil water initial conditions, J. Climate, 19, 3659–3680, 2006.
Fung, I. Y., Doney, S. C., Lindsay, K., and John, J.: Evolution of carbon sinks in a changing climate, P. Natl. Acad. Sci. USA, 102, 11201–11206, 2005.
Goerner, A., Reichstein, M., and Rambal, S.: Tracking seasonal drought effects on ecosystem light use efficiency with satellite-based PRI in a Mediterranean forest, Remote Sens. Environ., 113, 1101–1111, 2009.
Gu, Y. X., Hunt, E., Wardlow, B., Basara, J. B., Brown, J. F., and Verdin, J. P.: Evaluation of MODIS NDVI and NDWI for vegetation drought monitoring using Oklahoma Mesonet soil moisture data, Geophys. Res. Lett., 35, L22401, doi:10.1029/2008GL035772, 2008.
Hansen, M., DeFries, R., Townshend, J. R., Carroll, M., Dimiceli, C., and Sohlberg, R.: Vegetation Continuous Fields MOD44B, 2001 Percent Tree Cover, Collection 3, University of Maryland, College Park, Maryland, 2003a
Hansen, M. C., DeFries, R. S., Townshend, J. R. G., Carroll, M., Dimiceli, C., and Sohlberg, R. A.: Development of 500 meter vegetation continuous field maps using MODIS data, IGARSS 2003: IEEE International Geoscience and Remote Sensing Sym-posium, Proceedings, 264–266, 2003b.
Heim, R. R.: A review of twentieth-century drought indices used in the United States, B. Am. Meteorol. Soc., 83, 1149–1165, 2002. Hyvrinen, A. and Oja, E.: Independent component analy-sis: algorithms and applications, Neural Netw., 13, 411–430, doi:10.1016/S0893-6080(00)00026-5, 2000.
Ji, L. and Peters A. J.: Assessing vegetation response to drought in the northern Great Plains using vegetation and drought indices, Remote Sens. Environ., 87(1), 85–98, 2003.
McKee, T. B., Doesken, N. J., and Kleist, J.: The relationship of drought frequency and duration to time scales, 8th AMS Confer-ence on Applied Meteorology, Anaheim CA., 179–184, 1993. Palmer, W. C.: Meteorological drought, US Weather Bureau,
Wash-ington DC, 58 pp., 1965.
Pinzon, J., Brown, M. E., and Tucker, C. J.: Satellite time series correction of orbital drift artifacts using empirical mode decom-position, in: Hilbert-Huang Transform: Introduction and Appli-cations, edited by: Huang, N., 167–186, 2005.
Seneviratne, S. I., Luthi, D., Litschi, M., and Schar, C.: Land-atmosphere coupling and climate change in Europe, Nature, 443, 205–209, 2006.
Sheffield, J. and Wood, E. F.: Projected changes in drought oc-currence under future global warming from model, multi-scenario, IPCC AR4 simulations Climate Dynamics, 31, 79–105, 2007.
Sims, A. P., Niyogi, D. D. S., and Raman, S.: Adopting drought indices for estimating soil moisture: A North Carolina case study, Geophys. Res. Lett., 29(8), 1183, doi:10.1029/2001GL013343, 2002.
Tadesse, T., Brown, J. F., and Hayes, M. J.: A new approach for predicting drought-related vegetation stress: Integrating satellite, climate, and biophysical data over the US central plains, ISPRS J. Photogramm. Remote Sens., 59, 244–253, doi:10.1016/j.isprsjprs.2005.02.003, 2005.
Tucker, C., Pinzon, J., Brown, M., Slayback, D., Pak, E., Mahoney, R., Vermote, E., and El Saleous, N.: An extended AVHRR 8km NDVI dataset compatible with MODIS and SPOT vegetation NDVI data, Int. J. Remote Sens., 26, 4485–4498, 2005. Tucker, C. J. and Sellers, P. J.: Satellite remote-sensing of primary
production, Int. J. Remote Sens., 7, 1395–1416, 1986.
Uppala, S. M., Kallberg, P. W., Simmons, A. J., Andrae, U., Bech-told, V. D., Fiorino, M., Gibson, J. K., Haseler, J., Hernandez, A., Kelly, G. A., Li, X., Onogi, K., Saarinen, S., Sokka, N., Allan, R. P., Andersson, E., Arpe, K., Balmaseda, M. A., Beljaars, A. C. M., Van De Berg, L., Bidlot, J., Bormann, N., Caires, S., Cheval-lier, F., Dethof, A., Dragosavac, M., Fisher, M., Fuentes, M., Hagemann, S., Holm, E., Hoskins, B. J., Isaksen, L., Janssen, P. A. E. M., Jenne, R., McNally, A. P., Mahfouf, J. F., Mor-crette, J. J., Rayner, N. A., Saunders, R. W., Simon, P., Sterl, A., Trenberth, K. E., Untch, A., Vasiljevic, D., Viterbo, P., and Woollen, J.: The ERA-40 re-analysis, Q. J. Roy. Meteorol. Soc., 131, 2961–3012, doi:10.1256/Qj.04.176, 2005.
Van den Hurk, B. J. J. M., Viterbo, P., Beljaars, A. C. M., and Betts, A. K.: Offline validation of the ERA40 surface scheme, edited by: Memo, E. T., Eur. Cent. for Medium-Range Weather Fore-casts, Reading, UK, 42 pp., 2000.
Van Der Schrier, G., Briffa, K. R., Jones, P. D., and Osborn, T. J.: Summer moisture variability across Europe, J. Climate, 19, 2818–2834, 2006.
Viterbo, P. and Beljaars, A. C. M.: An improved land-surface pa-rameterization scheme in the EMCWF model and its validation, J. Climate, 8, 2716–2748, 1995.
Wang, X. W., Xie, H. J., Guan, H. D., and Zhou, X. B.: Differ-ent responses of MODIS-derived NDVI to root-zone soil mois-ture in semi-arid and humid regions, J. Hydrol., 340, 12–24, doi:10.1016/j.jhydrol.2007.03.022, 2007.
Wells, N., Goddard, S., and Hayes, M. J.: A self-calibrating Palmer Drought Severity Ivndex, J. Climate, 17, 2335–2351, 2004. Xie, P. P., Janowiak, J. E., Arkin, P. A., Adler, R., Gruber, A.,