Hydrol. Earth Syst. Sci., 17, 3937–3955, 2013 www.hydrol-earth-syst-sci.net/17/3937/2013/ doi:10.5194/hess-17-3937-2013
© Author(s) 2013. CC Attribution 3.0 License.
Hydrology and
Earth System
Sciences
Open Access
Rainfall and temperature estimation for a data sparse region
R. L. Wilby and D. Yu
Department of Geography, Loughborough University, UK
Correspondence to: R. L. Wilby ([email protected])
Received: 31 May 2013 – Published in Hydrol. Earth Syst. Sci. Discuss.: 14 June 2013 Revised: 9 September 2013 – Accepted: 10 September 2013 – Published: 15 October 2013
Abstract. Humanitarian and development agencies face dif-ficult decisions about where and how to prioritise climate risk reduction measures. These tasks are especially challenging in regions with few meteorological stations, complex topogra-phy and extreme weather events. In this study, we blend sur-face meteorological observations, remotely sensed (TRMM and NDVI) data, physiographic indices, and regression tech-niques to produce gridded maps of annual mean precipitation and temperature, as well as parameters for site-specific, daily weather generation in Yemen. Maps of annual means were cross-validated and tested against independent observations. These replicated known features such as peak rainfall totals in the highlands and western escarpment, as well as maxi-mum temperatures along the coastal plains and interior. The weather generator reproduced daily and annual diagnostics when run with parameters from observed meteorological se-ries for a test site at Taiz. However, when run with interpo-lated parameters, the frequency of wet days, mean wet-day amount, annual totals and variability were underestimated. Stratification of sites for model calibration improved repre-sentation of the growing season’s rainfall totals. Future work should focus on a wider range of model inputs to better dis-criminate controls exerted by different landscape units.
1 Introduction
Humanitarian and development agencies face difficult deci-sions about where and how to prioritise climate risk reduction measures. For example, the Pilot Program for Climate Re-silience (PPCR) of the Strategic Climate Fund (SCF) aims to demonstrate ways in which climate risk and resilience may be integrated into core development planning1. This raises
1https://www.climateinvestmentfunds.org/cif/ppcr
practical questions about where infrastructure should be up-graded to better cope with extreme weather events. Which areas should be prioritised for soil and water conservation measures? Which agricultural regions would benefit most from improved water access or from rehabilitation of tra-ditional rain-water harvesting systems? Where should train-ing of agricultural extension workers be concentrated? What is the future climate suitability of lands for different crops? High-quality, spatially distributed hydro-meteorological in-formation (as well as regional climate projections) can help appraise such options.
Many of the regions that are highly vulnerable to climate risks are also amongst the most data sparse. Yemen is one of the least developed countries in the world and one of the poorest in the Middle East and northern Africa. Agriculture employs more than half of the labour force and accounts for over 90% of water use. However, long-term, homogeneous meteorological records are scarce. Although monthly data are available for Aden since the 1880s, daily records typi-cally begin in the 1970s or later, and many were tied to short-term projects, or are of suspect quality. This lack of data severely hampers efforts to evaluate short-term meteorolog-ical hazards and long-term climate risks. Furthermore, with-out high-resolution precipitation and temperature records, it is hard to benchmark future climate variability and change, associated impacts, and adaptation outcomes.
Several ways have been devised for addressing this infor-mation deficit. For instance, it has long been recognised that the distribution and amount of precipitation in Yemen varies with altitude, latitude and distance from the coast (Beskok, 1971). Early isohyetal (precipitation) maps made extensive use of natural vegetation surveys as a proxy for precipitation gradients (e.g. Atkins et al., 1984). With the advent of re-mote sensing in the 1980s came prospects for gathering hy-drological indices in data sparse regions (Grolier et al., 1984)
3938 R. L. Wilby and D. Yu: Rainfall and temperature estimation for a data sparse region
and prediction for ungauged basins (Lakshmi, 2004). Oth-ers developed geostatistical methods (Goovaerts, 2000), spa-tial interpolation techniques (Guenni and Hutchinson, 1998), global gridded climate data sets (Harris et al., 2013), and stochastic weather models for semi-arid and arid environ-ments (Hutchinson, 1995). Both sets of approaches ulti-mately depend on the physical attributes of the landscape and climate, as well as access to in situ measurements for model calibration and ground truthing (Almazroui, 2011). One global assessment further acknowledged that large un-certainties in satellite-based precipitation estimates can occur over complex terrain and near coastlines (Tian and Peters-Lidard, 2010). Other work shows higher than expected rain-fall estimates over sand desert areas (Habib and Narsollahi, 2009).
In the present study, we blend surface meteorological ob-servations, remotely sensed (precipitation and vegetation) in-dices, topographic information, and regression techniques to produce gridded maps of annual mean precipitation and tem-perature, as well as parameters for local daily weather sim-ulation in Yemen. These tools were developed during the course of a national assessment of flash flood risk, soil ero-sion, water harvesting, and cropping potential (Wilby and Yu, 2013). Our approach is based on the fundamental premise that publicly available land-cover and landscape attributes can be used to estimate local mean climate conditions for data sparse regions. Yemen provides a particularly challeng-ing case study for testchalleng-ing these ideas.
Section 2 describes the study area and data sets used for statistical model calibration and validation. Section 3 explains the methods of parameter estimation and Sect. 4 presents validation results and maps generated by statistical models. The application of inferred weather generator pa-rameters for daily precipitation and temperature simulation is also demonstrated for a site in the Yemen Highlands. Sec-tion 5 discusses the possible method refinement and exten-sion to climate risk assessment, and Sect. 6 outlines future research opportunities, including extension of the approach to other data sparse regions.
2 Study area and data
With a human development index (HDI) of 0.462, Yemen is ranked 154th out of 169 countries (HDR, 2011). Over 60 % of the rural population currently live beneath the national poverty line of USD 2 day−1and Yemen’s renewable fresh-water resource (135 m3per capita per year in 2009) is one of the lowest in the world. Over 50 % of children are chronically malnourished, and agriculture is a key source of income for nearly three quarters of the population. There are concerns that climate variability and change could further exacerbate poverty and food insecurity, particularly for the rural popu-lation (World Bank, 2010). Hence, development of climate information systems is seen as a priority for evaluating and
managing climate risks to natural resources and livelihoods (RMSI, 2013).
Yemen is characterised by five major eco-climatic zones (EPA, 2004:7): (1) the hot and humid coastal Tihama plain, 30–60 km wide, along the Red Sea and the Gulf of Aden, (2) the Yemen Highlands, a volcanic region with elevations be-tween 1000 and 3600 m parallel to the Red Sea coast, with temperate climate and monsoon rains, (3) the dissected re-gion of Yemen’s high plateaus and the Hadramawt–Mahra Uplands, with altitudes up to 1000 m, (4) the Rub al-Khali desert interior, with a hot and dry climate, and (5) the is-lands, including Socotra in the Arabian Sea and more than 112 islands in the Red Sea.
Rainfall varies from less than 50 mm along the coastal plains and desert plateau regions to more than 1000 mm in the western mountainous highland region. Two main rain-fall patterns are evident: (1) a southwest, summer monsoon regime with rainfall occurring in two periods, March–May and July–September, as a result of the Red Sea Convergence and the Inter Tropical Convergence Zone (ITCZ) (EPA, 2004:8); (2) a winter maximum, cyclonic regime driven by frontal rainfall from the north accounting for up to 80 % of annual totals on the coast. Altitude exerts a very strong con-trol over the pattern and quantity of rainfall. Likewise, tem-perature depends on elevation and distance from the coast. Mean annual temperatures range from less than 12◦C in the highlands (with occasional frost) to 30◦C in the coastal plains (EPA, 2004:8).
Meteorological data are not held by a central authority in Yemen, but dispersed across several agencies including the Yemen Meteorological Service (YMS) within the Civil Avi-ation and Meteorological Authority (CAMA), the Ministry of Agriculture and Irrigation (MAI), Agriculture Research and Extension Authority (AREA), National Water Resource Authority (NWRA), and the Tihama Development Author-ity (TDA). Long-term systematic observations of precipita-tion and temperature are very rare indeed. Early, short-lived records are available for Aden, Sana’a and Taiz, but there are only a handful of series that extend from the 1970s to present. Furthermore, quality concerns surround many daily and monthly meteorological records; some data have yet to be digitised, or have been lost; untold records have been bro-ken by episodes of civil unrest and conflict (Fig. 1). There are also inconsistencies in station details (such as naming convention, latitude, longitude and elevation) between dig-ital archives and annual reporting sheets.
2.1 Precipitation
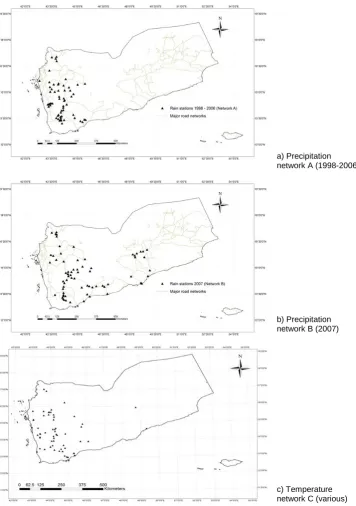
With the above points in mind, daily meteorological data were compiled from several sources during World Bank mis-sions to Yemen in 2008 and 2009 (Wilby, 2008, 2009a, b). Two sets of precipitation data were formed: Network A con-tains 62 stations from the NWRA archive for 1998–2006 (Fig. 2a); Network B contains 71 stations from the MAI
R. L. Wilby and D. Yu: Rainfall and temperature estimation for a data sparse region 3939
28
Figure 1 Station years of precipitation data held in the NWRA archive for the period 1969-2008.
0 10 20 30 40 50 60 70 80 90 100
1969 1971 1973 1975 1977 1979 1981 1983 1985 1987 1989 1991 1993 1995 1997 1999 2001 2003 2005 2007
S
tat
io
n
year
s
Fig. 1. Station years of precipitation data held in the NWRA archive
for the period 1969–2008.
and NWRA archive for 2007 (Fig. 2b). Spatial coverage was maximised by using any record with at least three years of data within the period 1998–2006, or 330 days in 2007. Net-work A was used for model calibration and NetNet-work B for validation. There are only eight stations in common for Net-work A and B so this is regarded a stringent test of the model. Note also the very sparse coverage east of 45◦E, and com-plete absence of sites beyond 49◦E.
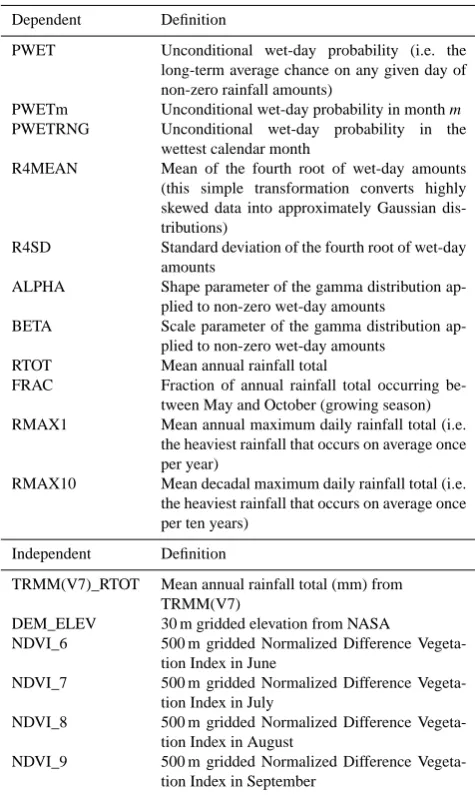
Ten precipitation parameters were derived for each station (Table 1) including: mean annual fraction of days that are wet (defined as any day with non-zero precipitation amount) (PWET); mean annual rainfall total (RTOT); annual max-imum daily total with return period of 10 yr (RMAX10); mean and standard deviations of daily rainfall totals after the fourth root transformation (R4MEAN and R4SD respec-tively); alpha and beta parameters of the gamma distribution for daily wet-day amounts (ALPHA and BETA respectively). In addition, the monthly unconditional wet-day probability (PWETm) was derived for all sites in Network A. This pa-rameter captures local variations in the onset and strength of the summer monsoon.
2.2 Temperature
Temperature data were compiled from daily (NWRA) and monthly (AREA) records for various periods in the 1970s, 1980s and 1990s (Wilby, 2009a). These data sets were merged to maximise spatial and temporal coverage in Net-work C which contains 60 stations in total (Fig. 2c). Again, note the very sparse network east of 45◦E, and complete lack of sites beyond 50◦E. Only 10 sites have daily temperature data and all are located in the southwest.
[image:3.595.50.285.65.175.2]Four temperature parameters were derived for all stations: the mean annual temperature (ATBAR); the mean annual maximum (ATMAX) and minimum (ATMIN) temperatures; and mean annual temperature range (ATRNG). Five other pa-rameters were derived from the daily temperature records: mean Julian day with highest annual temperature (ADMAX); standard deviation of the date recording the highest annual temperature (ADMAXSD); mean diurnal temperature range (DTRNG); standard deviation of daily mean temperature
Table 1. Dependent and independent variables used to estimate
lo-cal precipitation.
Dependent Definition
PWET Unconditional wet-day probability (i.e. the
long-term average chance on any given day of non-zero rainfall amounts)
PWETm Unconditional wet-day probability in monthm
PWETRNG Unconditional wet-day probability in the
wettest calendar month
R4MEAN Mean of the fourth root of wet-day amounts
(this simple transformation converts highly skewed data into approximately Gaussian dis-tributions)
R4SD Standard deviation of the fourth root of wet-day
amounts
ALPHA Shape parameter of the gamma distribution
ap-plied to non-zero wet-day amounts
BETA Scale parameter of the gamma distribution
ap-plied to non-zero wet-day amounts
RTOT Mean annual rainfall total
FRAC Fraction of annual rainfall total occurring
be-tween May and October (growing season)
RMAX1 Mean annual maximum daily rainfall total (i.e.
the heaviest rainfall that occurs on average once per year)
RMAX10 Mean decadal maximum daily rainfall total (i.e.
the heaviest rainfall that occurs on average once per ten years)
Independent Definition
TRMM(V7)_RTOT Mean annual rainfall total (mm) from
TRMM(V7)
DEM_ELEV 30 m gridded elevation from NASA
NDVI_6 500 m gridded Normalized Difference
Vegeta-tion Index in June
NDVI_7 500 m gridded Normalized Difference
Vegeta-tion Index in July
NDVI_8 500 m gridded Normalized Difference
Vegeta-tion Index in August
NDVI_9 500 m gridded Normalized Difference
Vegeta-tion Index in September
(DTSD); and lag-1 autocorrelation coefficient of daily mean temperatures (DTLAG1). The purpose of the ADMAX and ADMAXSD parameters is to stochastically shift the day of peak temperature (and thereby the annual sine-curve) within a window of time.
2.3 Remotely sensed and terrain data
Gridded precipitation estimates were obtained from the Trop-ical Rainfall Measuring Mission (TRMM version 7) multi-satellite precipitation analysis which archives 3-hourly, daily and monthly precipitation totals at 0.25◦×0.25◦ latitude-longitude resolution, in near real time since 1998 (Huffman et al., 2007). Monthly and annual precipitation totals were extracted for all grid points in a domain covering the whole of Yemen for two periods: 1998–2006 and 2007 (Fig. 3).
[image:3.595.309.547.91.489.2]3940 R. L. Wilby and D. Yu: Rainfall and temperature estimation for a data sparse region
[image:4.595.119.476.61.568.2]29
Figure 2 Meteorological stations
a) Precipitation network A (1998-2006)
b) Precipitation network B (2007)
c) Temperature network C (various)
Fig. 2. Meteorological stations.
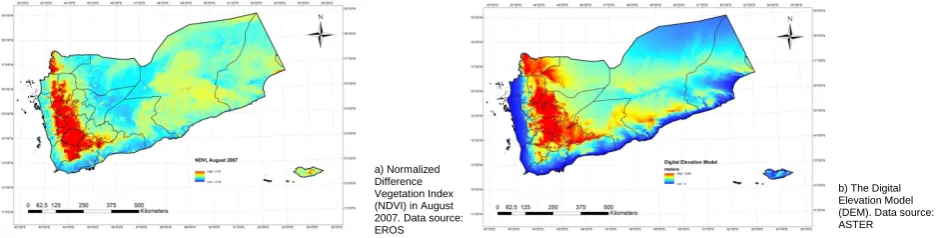
The Normalized Difference Vegetation Index (NDVI) pro-vides a record of the spatial and temporal dynamics of green plant canopies using remotely sensed near-infrared and red colour bands on a pixel by pixel basis (Fig. 4a). Monthly NDVI was derived from the Moderate Resolution Imaging Spectroradiometer (MODIS) Terra via the USGS Earth Re-source Observation and Science Center (EROS)2.
2http://glovis.usgs.gov/
Finally, a 30 m resolution digital elevation model (DEM) was obtained from the Advanced Spaceborne Thermal Emis-sion and Reflection Radiometer (ASTER) Global Digital El-evation Map (GDEM)3(Fig. 4b).
3http://asterweb.jpl.nasa.gov/gdem.asp
R. L. Wilby and D. Yu: Rainfall and temperature estimation for a data sparse region 3941
30
Figure 3 Precipitation totals estimated by TRMM 3B42(V7) for the years 1998-2006 (left)
and 2007 (right).
Fig. 3. Precipitation totals estimated by TRMM 3B42(V7) for the years 1998–2006 (left) and 2007 (right).
[image:5.595.71.516.64.224.2]31 Figure 4 Vegetation index and digital elevation model
a) Normalized Difference Vegetation Index (NDVI) in August 2007. Data source: EROS
b) The Digital Elevation Model (DEM). Data source: ASTER
31 Figure 4 Vegetation index and digital elevation model
a) Normalized Difference Vegetation Index (NDVI) in August 2007. Data source: EROS
b) The Digital Elevation Model (DEM). Data source: ASTER
Fig. 4. Vegetation index and digital elevation model.
3 Methodology
The methodology is described in three stages: (i) estimation of weather generator parameters for precipitation using re-motely sensed and terrain attributes; (ii) the same process for air temperature, and; (iii) use of these empirical relationships to obtain parameters for a single-site daily weather generator (mean temperature and precipitation totals), for an illustra-tive settlement (Taiz) in the Yemen Highlands.
3.1 Rainfall parameter estimation
Rainfall parameters for Yemen were derived via multiple linear-regression relationships with satellite-derived precip-itation (TRMM_RTOT), terrain elevation (DEM_ELEV), and monthly Normalized Difference Vegetation Index (NDVI_month) (Table 1). For example, Fig. 5 shows the re-lationship between observed mean annual rainfall totals for sites in Network A and the nearest grid-point estimate from TRMM(V7). The model for PWETm was built using dummy variables (Dm) for each month, with TRMM(V7)_RTOT and ELEV as predictors. All regression models were constructed by pooling data in order to maximise the information for parameter estimation. Sub-annual modelling is an appealing idea but in practice is constrained by the very small number
of rain days in the training set. This is particularly challeng-ing when estimatchalleng-ing wet-day amount distributions.
Three simplifying assumptions were made when building the regression models: (i) relationships between the depen-dent (point rainfall parameters) and independepen-dent (gridded) variables are linear; (ii) statistical relationships are station-ary (i.e. do not vstation-ary in space or time); and (iii) local rainfall parameters behave independently of each other. Assumption (i) was tested through visual inspection of scatterplots show-ing pairs of dependent–independent variables. Multiple lin-ear regression models were calibrated using rainfall parame-ters from Network A (1998–2006) and validated against Net-work B (2007). This was considered a stringent test of model stationarity (assumption ii) since the test data contain peri-ods of record and sites not used in training. Any covariance between the parameters (assumption iii) was represented im-plicitly through use of common independent variables.
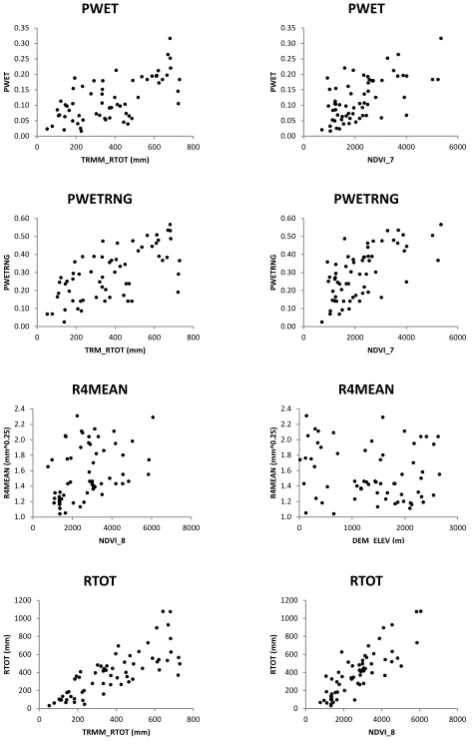
Exploratory analyses were performed to assess pre-dictability of daily rainfall parameters from terrain and remotely sensed metrics using dependent and indepen-dent variables for the period 1998–2006 (Fig. 6). The strongest associations were found between the annual un-conditional probability of rainfall (PWET) and annual to-tal rainfall (RTOT) inferred from TRMM(V7)_RTOT and
[image:5.595.64.535.262.381.2]3942 R. L. Wilby and D. Yu: Rainfall and temperature estimation for a data sparse region
[image:6.595.51.284.62.275.2]32 Figure 5 Comparison of TRMM(V7) with observed mean annual rainfall at Network A sites.
y = 1.0219x
0 200 400 600 800 1000
0 200 400 600 800 1000
N
et
w
ork
A
a
nn
ua
l t
ot
al
(mm)
TRMM(V7) annual total (mm)
Fig. 5. Comparison of TRMM(V7) with observed mean annual
rain-fall at Network A sites.
summer NDVI. Previous studies also report positive corre-lations between the observed seasonal cycle of rainfall totals and TRMM estimates for gauges in neighbouring Saudi Ara-bia (Almazroui, 2011). Moreover, the strong correlation with vegetation greenness (NDVI) is physically meaningful since August has on average the most frequent rain-days and is the height of the summer monsoon (kharif rains) in the Yemen Highlands and along the Red Sea coast (Tihama Plain).
Much weaker correlations were found for parameters of daily precipitation such as PWETRNG and R4MEAN. Again, this is consistent with previous work showing weak negative correlations between R4MEAN versus longitude and distance from the coast (Wilby, 2009b). This reflects gen-eral declines in precipitation eastwards of the Yemen High-lands, and northwards in the Rub al-Khali (empty quarter).
Annual maximum daily rainfall totals with return periods of 10 yr (RMAX10) were estimated from the local parame-ters describing the logarithmic (RTOT/PWET), gamma (AL-PHA, BETA), and fourth root (R4MEAN, R4SD) distribu-tions. Daily rainfall totals were not derived for events rarer than once per 10 yr because of the limited amount of data (only 9 yr) available for parameter estimation, and low con-fidence in some of the reported daily totals. (Note that site-specific, extreme values derived from gamma or exponential models can be compared with values from a weather genera-tor run forNyr (see below)).
3.2 Temperature parameter estimation
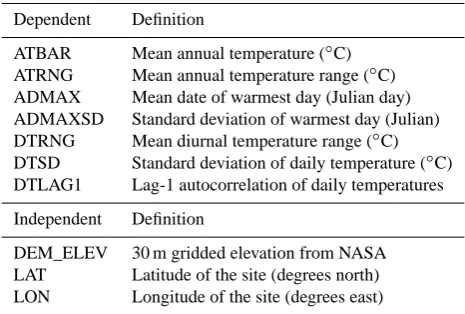
Annual and daily temperature parameters for Yemen were es-timated from multiple linear regression relationships with el-evation (DEM_ELEV), latitude (LAT) and longitude (LON) (Table 2). For example, Fig. 7 shows a very strong negative
Table 2. Dependent and independent variables used to estimate
lo-cal temperature.
Dependent Definition
ATBAR Mean annual temperature (◦C) ATRNG Mean annual temperature range (◦C) ADMAX Mean date of warmest day (Julian day) ADMAXSD Standard deviation of warmest day (Julian) DTRNG Mean diurnal temperature range (◦C) DTSD Standard deviation of daily temperature (◦C) DTLAG1 Lag-1 autocorrelation of daily temperatures Independent Definition
DEM_ELEV 30 m gridded elevation from NASA LAT Latitude of the site (degrees north) LON Longitude of the site (degrees east)
correlation between mean annual temperature (ATBAR) and site elevation. The next strongest relationship is be-tween variability in the date of the warmest day each year (AMAXSD) and longitude; whereas variance in daily tem-peratures (DTSD) depends more on latitude (not shown). In comparison, the north–south gradient in mean annual temperature is much weaker. These analyses suggest that some important features of the annual and daily temperature regime can be inferred from simple landscape indices.
3.3 Mean annual climate and daily weather generation
Estimated rainfall and temperature parameters were applied in two ways. First, the parameters were used to construct high-resolution (1 km) maps of mean annual rainfall totals and air temperature for the whole of Yemen. Surfaces were produced with and without interpolation and, where feasible, compared to data not used for model calibration. Second, the parameters were used in a conditional weather generator to simulate daily rainfall and temperature at Taiz in the Yemen Highlands. This site was chosen because the amount and quality of data available are relatively good. Furthermore, the Taiz meteorological record has been used before to construct a simple weather generator for evaluating rain-fed agriculture and water harvesting potential (Rappold, 2005).
In view of the data constraints only the most straightfor-ward of weather generator algorithms is warranted (Wilks and Wilby, 1999). The Yemen weather generator produces daily rainfall and mean temperature series via the following algorithm.
1. Determine the local unconditional wet-day probability for the current month using the regression equation for PWETm (Table 3).
2. Generate a linear random number (R1) to determine whether the day is wet or dry (i.e. a wet day when R1≤PWETm).
[image:6.595.311.544.92.249.2]R. L. Wilby and D. Yu: Rainfall and temperature estimation for a data sparse region 3943
33 Figure 6 Example relationships between daily precipitation parameters for Network A and selected predictor variables: TRMM(V7), NDVI, and ELEV.
0.00 0.05 0.10 0.15 0.20 0.25 0.30 0.35
0 200 400 600 800
PW ET TRMM_RTOT (mm) PWET 0.00 0.05 0.10 0.15 0.20 0.25 0.30 0.35
0 2000 4000 6000
PW ET NDVI_7 PWET 0.00 0.10 0.20 0.30 0.40 0.50 0.60
0 200 400 600 800
PW ET RN G TRM_RTOT (mm) PWETRNG 0.00 0.10 0.20 0.30 0.40 0.50 0.60
0 2000 4000 6000
PW ET RN G NDVI_7 PWETRNG 1.0 1.2 1.4 1.6 1.8 2.0 2.2 2.4
0 2000 4000 6000 8000
R4M EA N (m m ^0. 25) NDVI_8 R4MEAN 1.0 1.2 1.4 1.6 1.8 2.0 2.2 2.4
0 1000 2000 3000
R4M EA N (m m ^0. 25)
DEM ELEV (m)
R4MEAN 0 200 400 600 800 1000 1200
0 200 400 600 800
RTOT ( m m ) TRMM_RTOT (mm) RTOT 0 200 400 600 800 1000 1200
0 2000 4000 6000 8000
RTOT ( m m ) NDVI_8 RTOT
Fig. 6. Example relationships between daily precipitation
parame-ters for Network A and selected predictor variables: TRMM(V7), NDVI, and ELEV.
[image:7.595.50.288.63.437.2]3. If dry proceed to step (vi), otherwise use the regres-sion equations to estimate local R4MEAN and R4SD (Table 3).
4. Generate a normally distributed random number (R2) to determine the transformed wet-day amount (RWET) given R4MEAN and R4SD.
5. Untransform (raise to power 4) RWET to yield a wet-day rainfall total (in mm).
6. Determine the Julian day and if greater than the year length, reset the day, month and year counter. Then stochastically generate the date of the warmest day in the new year using a normally distributed random number (R3) with mean ADMAX and standard devia-tion ADMAXSD (Table 3).
7. Determine the local daily mean temperature (TBAR) given the Julian day by assuming that the annual
temperature regime follows a sine curve with mean (ATBAR), amplitude (ATRNG), and phase (AD-MAX±ADMAXSD) (Table 3).
8. Inflate the variance of TBAR by adding a stochasti-cally generated anomaly given a normally distributed random number (R4) and the NOISE parameter (using the regression equation for DTLAG1 in Table 3). In order to assess the transferability of the precipitation gen-erator, parameters were estimated using regression equations that had been calibrated with and without data for Taiz, and by using models built on different sub-sets of Network A data to explore the consequences of stratifying by climatic zone. Accordingly, weather generator results for Taiz were produced from observed precipitation parameters (WGOBS), parameters regressed from all sites (WGALL), and parame-ters regressed only from sites on the western escarpment of the Yemen Highlands (WGWH).
4 Results
4.1 Mean annual precipitation
Table 3 provides a summary of regression model coefficients, independent variables used, and the amount of explained variance (adjusted for sample size,R2adj). Overall, parameters of daily rainfall occurrence and amount (PWET, PWETRNG and RTOT) are fit better than parameters describing the dis-tribution of daily rainfall amounts (R4MEAN, ALPHA and BETA). In the case of the former, over 85 % of the spatial variation is explained by landscape and land-cover proper-ties.
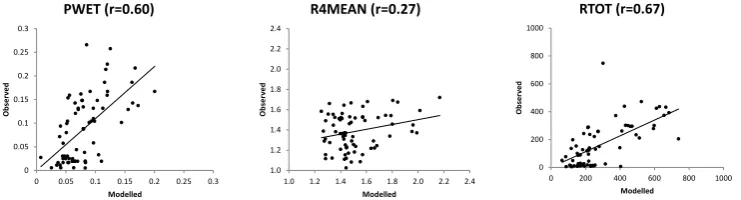
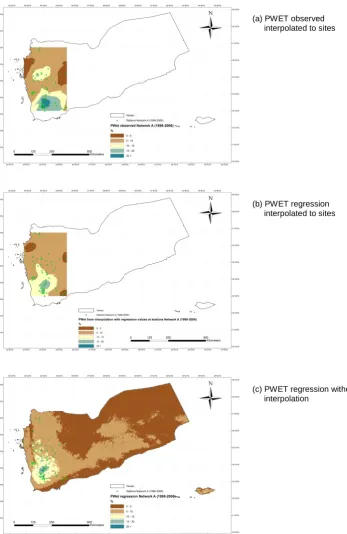
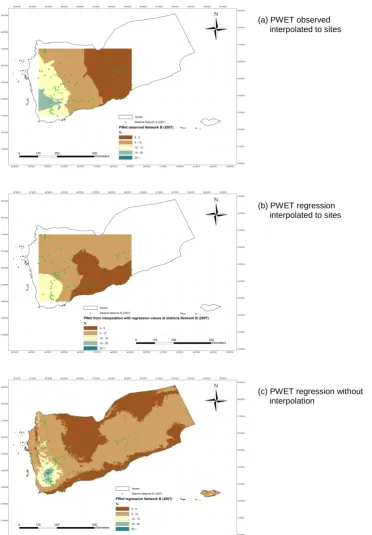
Regression models were validated using rainfall param-eters from Network B (Fig. 8). As with calibration there is higher skill for daily rainfall occurrence (PWET) than amounts (R4MEAN) yielding 45 % explained variance for their product – the annual rainfall total (RTOT). Given the severity of the validation test and low confidence in the data quality this modest level of skill was encouraging. Fig-ures 9–12 show maps of observed and modelled PWET and RTOT for the calibration and validation networks. Interpo-lated point estimates (panel b in each case) tend to reduce both the detail and variance compared with raw model es-timates (panel c). Overall, the models underestimated rain-fall occurrence but overestimated totals in the validation year 2007. We recognise that validation against a single year is less than ideal but, as we note above, the use of a different network was a stringent test. Furthermore, the relative arid-ity of 2007 when compared with 1998–2006 makes the test even more demanding (Fig. 3).
Models based on TRMM and NDVI fit the calibration data better than models based on TRMM alone (not shown). Inter-polation reduces model errors relative to observations in both the calibration and validation periods. This is not surprising
3944 R. L. Wilby and D. Yu: Rainfall and temperature estimation for a data sparse region
34 Figure 7 Relationships between NWRA/MIA annual temperature parameters versus site
elevation (ELEV), longitude (LON), and latitude (LAT).
15 17 19 21 23 25 27 29 31 33
0 500 1000 1500 2000 2500 3000
Tt em per at ur e ( deg C) Elevation (m) ATBAR 15 17 19 21 23 25 27 29 31 33
12 13 14 15 16 17 18
Te mp era tu re (d eg C)
Latitude (deg N)
ATBAR 15 17 19 21 23 25 27 29 31 33
42 44 46 48 50
Te mp era tu re (d eg C)
Longitude (deg E)
ATBAR 0 2 4 6 8 10 12 14 16
0 500 1000 1500 2000 2500 3000
Tt em per at ur e ( deg C) Elevation (m) ARNG 0 2 4 6 8 10 12 14 16
12 13 14 15 16 17 18
Tt em per at ur e ( deg C)
Latitude (deg N)
ARNG 0 2 4 6 8 10 12 14 16
42 44 46 48 50
Tt em per at ur e ( deg C)
Longitude (deg E)
ARNG 0 5 10 15 20 25 30 35 40 45
0 500 1000 1500 2000 2500 3000
Ju lia n d ay s Elevation (m) AMAXSD 0 5 10 15 20 25 30 35 40 45
12 13 14 15 16 17 18
Ju
lia
n d
ay
s
Latitude (deg N)
AMAXSD 0 5 10 15 20 25 30 35 40 45
42 44 46 48 50
Ju
lia
n d
ay
s
Longitude (deg E)
[image:8.595.113.484.349.449.2]AMAXSD
Fig. 7. Relationships between NWRA/MIA annual temperature parameters versus site elevation (ELEV), longitude (LON), and latitude
(LAT).
35
Figure 8 Model validation using Network B parameters estimated from ELEV and
TRMM(V7). Note that the observed RTOT outlier (748 mm) was for an un-named high altitude AREA station. Rainfall recorded at this site was anomalously high when compared with the nearest stations at Absiah (140 mm) and Al-Kalabah (6 mm).
0 0.05 0.1 0.15 0.2 0.25 0.3
0 0.05 0.1 0.15 0.2 0.25 0.3
O bs er ved Modelled PWET (r=0.60) 1.0 1.2 1.4 1.6 1.8 2.0 2.2 2.4
1.0 1.2 1.4 1.6 1.8 2.0 2.2 2.4
O bs er ved Modelled R4MEAN (r=0.27) 0 200 400 600 800 1000
0 200 400 600 800 1000
O bs er ved Modelled RTOT (r=0.67)
Fig. 8. Model validation using Network B parameters estimated from ELEV and TRMM(V7). Note that the observed RTOT outlier (748 mm)
was for an un-named high altitude AREA station. Rainfall recorded at this site was anomalously high when compared with the nearest stations at Absiah (140 mm) and Al-Kalabah (6 mm).
given that the observations are themselves interpolated to enable grid-to-grid comparison. However, the gain from in-terpolation is less for the validation period which was drier than the period used for calibration (see Fig. 3). Overall, the model based on TRMM and NDVI is preferred because the detailed spatial structure of rainfall is better preserved; the model performance is stable between calibration and vali-dation periods; and the marginal benefit of simpler model variants can be explained by the interpolated (rather than gridded) observations used for error analysis. Furthermore, the range of local values is compressed by interpolation, po-tentially understating extreme daily rainfall amounts (see be-low).
Root mean squared errors (RMSEs) for annual mean pre-cipitation without interpolation are 106 mm for Network A and 104 mm for Network B. With interpolation, RMSEs for Network A and B are 72 mm and 91 mm respectively. These
errors are equivalent to the annual mean rainfall total esti-mated for the arid interior (Figs. 11, 12). Nonetheless, the characteristic “heel” pattern of annual precipitation emerges, which is qualitatively consistent with earlier rainfall maps for Yemen (e.g. Farquharson et al., 1996). A strong precipitation gradient from the highlands to the Red Sea coast and local maxima along the line of east Taiz, Ibb, west Dhamar and Raymah governorates is also evident.
Observed and modelled extreme rainfall totals were eval-uated using the daily total with 10 yr return period as a di-agnostic (Fig. 13). Given limited data for model calibration, and estimation of an extreme statistic of greater return pe-riod than the length of record, this is a severe test. The three models (gamma, fourth root and logarithmic) show compa-rable skill, but there is uncertainty in the quality of the ob-servations. Each model produces a hypothetical distribution based on their respective parameters with varying degrees of
R. L. Wilby and D. Yu: Rainfall and temperature estimation for a data sparse region 3945
36
Figure 9 Observed and modelled wet-day probabilities (PWET) based on Network A
(a) PWET observed interpolated to sites
(b) PWET regression interpolated to sites
[image:9.595.121.469.60.595.2](c) PWET regression without interpolation
Fig. 9. Observed and modelled wet-day probabilities (PWET) based on Network A.
match to the empirical distribution. The gamma model is pre-ferred because it generates marginally larger values than ob-servations. This means that if the output is used to assess risks associated with heavy rainfall (such as soil erosion or flash flooding) the magnitude of the impact will be similarly uplifted. Any adaptations to these design events would, there-fore, be inherently precautionary.
A north–south zone of high maximum daily rainfall to-tals is predicted along the escarpment above the Tihama coastal plain (Fig. 14). This finding is consistent with anec-dotal evidence suggesting that “these wadis can carry enor-mous floods from the western mountain slopes to the Red Sea” (Shahin, 2007: p. 280). Further circumstantial evidence is provided by the inventory of notable floods held by the
3946 R. L. Wilby and D. Yu: Rainfall and temperature estimation for a data sparse region
[image:10.595.116.489.60.596.2]37
Figure 10 As in Fig.9 but for Network B
(a) PWET observed interpolated to sites
(b) PWET regression interpolated to sites
(c) PWET regression without interpolation
Fig. 10. As in Fig. 9 but for Network B.
Dartmouth Flood Observatory. This reveals that since 1989 two thirds of all reported floods in Yemen have occurred in the western governorates of Al Mahwit, Al Hudaydah, Hjjah, Ibb and Raymah4.
4http://www.dartmouth.edu/~floods/Archives/index.html
4.2 Mean annual temperature
Very few data were available for temperature model cal-ibration, especially at daily resolution, and previous stud-ies have highlighted concerns about miscoded or spuri-ous values in the daily series (Wilby, 2009b). Nonetheless,
R. L. Wilby and D. Yu: Rainfall and temperature estimation for a data sparse region 3947
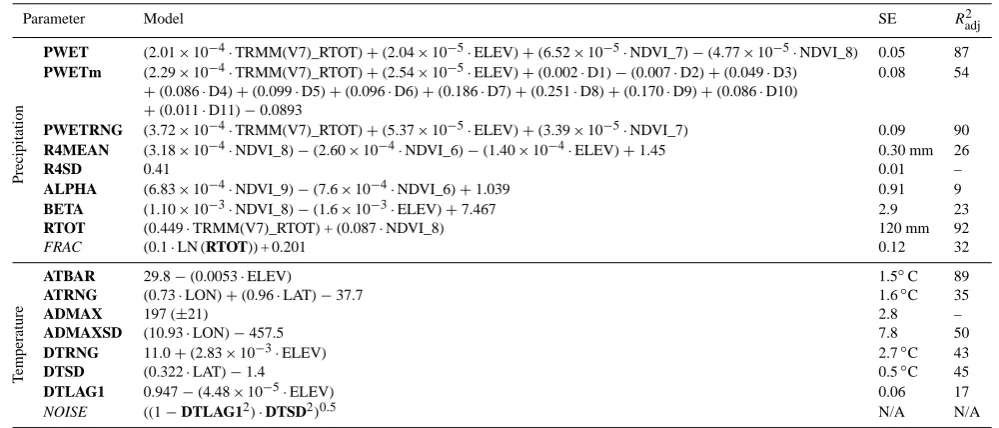
Table 3. Regression models for temperature and precipitation parameters derived from DEM_ELEV, NDVI, and TRMM(V7) (Network A).
Parameters shown in italics are derived from others (shown in bold). Where noR2adjvalues are cited the sample mean has been applied.
Parameter Model SE R2adj
Precipitation
PWET (2.01×10⁻⁴·TRMM(V7)_RTOT)+(2.04×10⁻⁵·ELEV)+(6.52×10⁻⁵·NDVI_7)−(4.77×10⁻⁵·NDVI_8) 0.05 87
PWETm (2.29×10⁻⁴·TRMM(V7)_RTOT)+(2.54×10⁻⁵·ELEV)+(0.002·D1)−(0.007·D2)+(0.049·D3) 0.08 54
+(0.086·D4)+(0.099·D5)+(0.096·D6)+(0.186·D7)+(0.251·D8)+(0.170·D9)+(0.086·D10)
+(0.011·D11)−0.0893
PWETRNG (3.72×10⁻⁴·TRMM(V7)_RTOT)+(5.37×10⁻⁵·ELEV)+(3.39×10⁻⁵·NDVI_7) 0.09 90
R4MEAN (3.18×10⁻⁴·NDVI_8)−(2.60×10⁻⁴·NDVI_6)−(1.40×10⁻⁴·ELEV)+1.45 0.30 mm 26
R4SD 0.41 0.01 –
ALPHA (6.83×10⁻⁴·NDVI_9)−(7.6×10⁻⁴·NDVI_6)+1.039 0.91 9
BETA (1.10×10⁻³·NDVI_8)−(1.6×10⁻³·ELEV)+7.467 2.9 23
RTOT (0.449·TRMM(V7)_RTOT) + (0.087·NDVI_8) 120 mm 92
FRAC (0.1·LN (RTOT)) + 0.201 0.12 32
T
emperature
ATBAR 29.8−(0.0053·ELEV) 1.5◦C 89
ATRNG (0.73·LON)+(0.96·LAT)−37.7 1.6◦C 35
ADMAX 197 (±21) 2.8 –
ADMAXSD (10.93·LON)−457.5 7.8 50
DTRNG 11.0+(2.83×10⁻³·ELEV) 2.7◦C 43
DTSD (0.322·LAT)−1.4 0.5◦C 45
DTLAG1 0.947−(4.48×10⁻⁵·ELEV) 0.06 17
NOISE ((1−DTLAG12)·DTSD2)0.5 N/A N/A
Table 3 provides a summary of independent variables, re-gression model coefficients, and the amount of explained variance. Overall, the best model fits were obtained for AT-BAR (Radj2 =89 %) and ADMAXSD (Radj2 =50 %). Con-versely, ADMAX had no predictive skill based on the chosen terrain indices and is best described by the long-term mean.
Due to data constraints ATBAR was assessed using a cross-validation technique in which 90 % of data are used to predict the remaining 10 %. The data held for model testing were swapped ten times until a complete set of independent predictions had been made. Figure 15 shows observed and predicted ATBAR based on this cross-validation, and that the regression model based on ELEV explains 89 % of the variance. The modelled lapse rate is 0.53◦C per 100 m and the spatial pattern of annual mean temperatures are compa-rable with those reported elsewhere (Bruggeman, 1997). The highest mean annual temperatures (∼30◦C) are predicted at sea level along the coastal plains beside the Red Sea and Gulf of Aden (Fig. 16). The average daily temperature range (DRNG) is about 15◦C in coastal areas but more than 20◦C at some high elevation sites in the arid interior.
4.3 Daily weather generation
The weather generator was first run using observed (WGOBS) and estimated (WGALL) temperature parameters for Taiz. WGALL parameters were derived from the regres-sion equations in Table 3 given site ELEV, LAT and LON. Both parameter sets were representative of years 1998 to 2005.
As would be expected, WGOBS parameters reproduce the mean and distribution of daily temperatures (Table 4,
Fig. 17). Overall, the annual range, standard deviation and serial correlation (Lag1) of daily temperatures are slightly underestimated (although the observed maximum daily tem-perature of 32.7◦C on 24 September 2001 is regarded as sus-pect given the timing as well as much lower values on days before and after). The standard deviation of annual means is also slightly lower than observed but low-frequency variabil-ity is not explicitly represented by the model.
WGALL parameters yield poorer overall performance than WGOBS (Table 4). However, this reflects the combined effect of model and parameter uncertainty for the site. This run has a cool bias of 1.0◦C in mean daily temperature
(Fig. 17), and weaker serial correlation. On the other hand, the standard deviation of annual means matches observations and the minimum temperature is better approximated. The cool bias translates into lower than expected annual degree day totals with the timing of the annual maximum delayed relative to observations (Fig. 18). This is because the mean Julian date of the warmest day is determined by the net-work average rather than for the site (Table 3). Although it is known that the warmest spell at Taiz typically occurs ear-lier than all other sites in Network C, this parameter cannot be predicted with any skill from available terrain indices.
The weather generator was also run for Taiz using pre-cipitation parameters derived directly from observations (WGOBS), estimation via regression models calibrated with all sites in Network A (WGALL), and those calibrated using data only from the western highlands of Yemen (WGWH) for the years 1998–2005. Overall, the WGOBS runs repro-duce most diagnostics except for the annual precipitation to-tal which is overestimated by∼10 % and the serial corre-lation (Lag1) of wet spells which is too low (Table 4). The
3948 R. L. Wilby and D. Yu: Rainfall and temperature estimation for a data sparse region
[image:12.595.118.480.65.610.2]38
Figure 11 Observed and estimated mean annual precipitation (RTOT) based on Network A
(a) RTOT observed interpolated to sites
(b) RTOT regression interpolated to sites
(c) RTOT regression without interpolation
Fig. 11. Observed and estimated mean annual precipitation (RTOT) based on Network A.
WGALL parameters underestimate mean wet-day amount, frequency of wet days, serial correlation and thereby mean annual total. WGALL standard deviations of daily and an-nual precipitation totals are less than observations; the overall distribution is skewed towards lighter rainfall events when compared with OBS and WGOBS (Fig. 17).
The weather generator based on regionally specific data (WGWH) also underestimates precipitation amounts and variability at daily and annual scales, although the seasonal timing of rainfall occurrence and wet season (May–October) accumulations are reproduced with greater skill than by WGALL (Fig. 19). This suggests that the WGWH model
R. L. Wilby and D. Yu: Rainfall and temperature estimation for a data sparse region 3949
39
Figure 12 As in Fig.11 but for Network B
(a) RTOT observed interpolated to sites
(b) RTOT regression interpolated to sites
[image:13.595.129.466.64.560.2](c) RTOT regression without interpolation
Fig. 12. As in Fig. 11 but for Network B.
may have some utility for evaluating crop potential and water harvesting schemes (as in Rappold, 2005). Annual totals are underestimated because WGWH parameters yield too few winter (November–April) wet days compared with OBS.
5 Discussion
We have explained the context, modelling techniques and in-dicative skill for local rainfall and temperature estimation
in Yemen. Although the idea of interpolating meteorologi-cal data is not new, by definition it is seldom attempted for extensive, data sparse regions with complex terrain. Previ-ous studies have interpolated climate records (Grant et al., 2004), daily meteorological data (Hutchinson et al., 2009), or extreme values (Pereira et al., 2010) but these methods are potentially susceptible to patchy or discontinuous data affect-ing aggregate statistics. Others simulate multi-site rainfall and temperature using resampling (Buishand and Brandsma,
3950 R. L. Wilby and D. Yu: Rainfall and temperature estimation for a data sparse region
[image:14.595.52.282.61.268.2]40 Figure 13 Observed and modelled 10-year return period daily rainfall totals for Network A. Note comparable statistics were not derived for Network B because of insufficient data.
0 50 100 150 200 250
0 50 100 150 200 250
O
BS
ER
VE
D (
mm)
MODELLED (mm)
LOG
GAMMA
ROOT4
Fig. 13. Observed and modelled 10 yr return period daily rainfall
totals for Network A. Note comparable statistics were not derived for Network B because of insufficient data.
41
Figure 14 Estimated 10-year return period daily rainfall totals based on gamma distribution (ALPHA and BETA) parameters
Fig. 14. Estimated 10 yr return period daily rainfall totals based on
gamma distribution (ALPHA and BETA) parameters.
2001) or stochastic weather generator techniques (Wilks, 1998; Burton et al., 2010) but these are typically employed at river basin scales.
Some have applied weather generator techniques in com-plex, mountainous terrain by conditioning the model param-eters on landscape features such as site elevation (Daly et al., 1994, 2008; Johnson et al., 2000; Wilks, 1998, 1999). Others interpolate weather generator parameters from sites to grids and synchronise with observed weather to create spa-tially and temporally consistent multi-site behaviour (Wilks, 2009). Parameters may also be conditioned in time using slowly varying climate indices to replicate low-frequency persistence (Wilby et al., 2002), or in space using predefined climatic zones to condition spatial variability across large (tropical) river basins (e.g. Kigobe et al., 2011). We extended
42
Figure 15
Cross-validation results for annual mean temperature (ATBAR).
10 15 20 25 30 35
10 15 20 25 30 35
O
bs
erv
ed
me
an
a
nn
ua
l t
emp
era
tu
re
(°
C)
Estimated annual mean temperature (°C)
Fig. 15. Cross-validation results for annual mean temperature
(AT-BAR).
Table 4. Temperature and precipitation diagnostics for Taiz for
1998–2005 derived from observations (OBS) and weather generator parameters calibrated against observations (WGOBS), or estimated from regression models fit to all sites (WGALL), or just those sites on the western escarpment of the Yemen Highlands (WGWH).
Diagnostic OBS WGOBS WGALL WGWH
Temperature (◦C)
Mean (annual) 24.1 24.0 23.1 –
Maximum (daily) 32.7 30.2 30.3 –
Minimum (daily) 16.4 18.0 15.4 –
SD (daily) 2.7 2.5 2.9 –
SD (annual) 0.6 0.5 0.6 –
Lag1 (daily) 0.93 0.86 0.78 –
Precipitation (mm)
Mean wet-day 7.3 7.7 6.2 6.5
95th percentile wet-day 27.6 27.8 19.6 18.9
Maximum wet-day 79.4 85.7 43.1 32.9
Wet-days (%) 21 22 19 18
Mean (annual) 557 603 424 438
Growing season (% annual) 82 86 69 83
SD (daily) 9.9 10.4 6.8 6.2
SD (annual) 150 148 110 96
Lag1 (wet occurrence) 0.24 0.17 0.06 0.11
these approaches by interpolating weather generator parame-ters conditional on point terrain and remotely sensed indices (precipitation and vegetation). The sophistication and real-ism of our statistical models were commensurate with the quality of available data. Indeed, even the production of mean annual rainfall and temperature isopleth maps was non-trivial and potentially an important legacy of the research. These surfaces require further validation but may provide a valu-able benchmark for subsequent climate risk assessments and options appraisal.
Our methodology could be refined in several other ways. First, a wider range of topographic indices could be ex-tracted from the DEM for use as independent variables in the regression modelling. For example, other landscape in-dices employed within PRISM include distance from coast,
[image:14.595.310.542.64.215.2] [image:14.595.309.547.326.516.2] [image:14.595.51.284.330.480.2]R. L. Wilby and D. Yu: Rainfall and temperature estimation for a data sparse region 3951
43 Figure 16 Observed and modelled annual mean temperature (ATBAR) based on Network C
(a) ATBAR observed
(b) ATBAR regression with interpolation to sites
[image:15.595.118.480.63.594.2](c) ATBAR regression with no interpolation
Fig. 16. Observed and modelled annual mean temperature (ATBAR) based on Network C.
topographic facet orientation, vertical atmospheric layer, to-pographic position, and orographic effectiveness of the ter-rain (Daly et al., 2008). A finer resolution DEM would also reduce the misrepresentation of site elevation at/close to sea level or in very steep terrain. Alternatively, me-teorological data could be stratified according to the five
recognised eco-climatic zones of Yemen (EPA, 2004): hot, humid coastal plains; temperate monsoonal highlands; the high plateau; hot, dry desert interior; and islands. However, there are very few surface weather observations for the last three landscape units.
3952 R. L. Wilby and D. Yu: Rainfall and temperature estimation for a data sparse region
[image:16.595.129.466.63.162.2]44
Figure 17 Observed (OBS) and generated (WGOBS, WGALL) cumulative distributions of daily mean temperature (left) and precipitation series (right) for years 1998 to 2005 at Taiz
0 0.1 0.2 0.3 0.4 0.5 0.6 0.7 0.8 0.9 1
15 17 19 21 23 25 27 29 31 33 35
Cu mu la tiv e p ro ba bi lit y Temperature (°C) OBS WGOBS WGALL 0 0.1 0.2 0.3 0.4 0.5 0.6 0.7 0.8 0.9 1
0 10 20 30 40 50 60 70 80 90
Cu mu la tiv e p ro ba bi lit y
Wet day (mm)
OBS WGOBS WGALL
Fig. 17. Observed (OBS) and generated (WGOBS, WGALL) cumulative distributions of daily mean temperature (left) and precipitation
series (right) for years 1998–2005 at Taiz.
45
Figure 18 Observed (OBS) and generated (WGOBS, WGALL) cumulative degree day totals for calendar years 2001 and 2002 at Taiz
0 1000 2000 3000 4000 5000 6000 7000 8000 9000 10000
Jan Feb Mar Apr May Jun Jul Aug Sep Oct Nov Dec
Te mp era tu re (d eg re e da ys ) 2001 OBS WGOBS WGALL 0 1000 2000 3000 4000 5000 6000 7000 8000 9000 10000
Jan Feb Mar Apr May Jun Jul Aug Sep Oct Nov Dec
Te mp era tu re (d eg re e da ys ) 2002 OBS WGOBS WGALL
Fig. 18. Observed and generated cumulative degree day totals for calendar years 2001 and 2002 at Taiz.
Second, more sophisticated statistical models could be de-veloped. For instance, non-linear techniques such as logis-tic regression might be applied to better represent abrupt changes in precipitation gradients, as between the coastal plains and highlands. The number of multiple independent variables could be reduced via factor, discriminant or prin-ciple component analysis. Possible conditioning of tempera-tures by precipitation occurrence could also be explored us-ing the handful of sites where both data are available. Se-rial persistence could be explicitly represented using condi-tional wet-day probabilities or strengthened in temperature series by using longer lag-intervals. More exhaustive cross-validation could be performed to produce distributions and confidence intervals for local regression parameters. This would have the added advantage of highlighting those areas with greatest model uncertainty, and hence potential foci for network expansion.
Third, related to the above point, model parameter and predictive uncertainties could be explored more thoroughly. All variables listed in Tables 1 and 2 are uncertain to vary-ing degrees at the site scale. This uncertainty could be ex-plored through jackknife estimation of the sampling vari-ance of parameter estimates based on available observations (as in Jones and Kay, 2007). Through Monte Carlo tech-niques it would then be possible to run the weather gener-ator with multiple sets of parameters and thereby produce uncertainty bounds for simulated temperature and precipi-tation series at individual sites. There is also generalisation uncertainty in each of the regression equations reported in Table 3. Overall, this is reflected by the standard error of the
model estimates. However, as suggested above, this aspect of uncertainty could be explored further by pooling calibration data using site- or climate-similarity indices. Results shown in Table 4 suggest that regionalisation may reduce errors for some (but not all) model diagnostics. Another benefit of re-gionalization is that parameters from sites with meteorolog-ical data can be applied to climatologmeteorolog-ically similar locations where there are no data. This may be preferable to using un-certain parameter estimates inferred from regression relation-ships (Kokkonen et al., 2003).
Fourth, data for model calibration and validation could be enhanced. Recent assessments have highlighted the poten-tial for data recovery and digitisation of meteorological data from paper records, or assembly of a national archive from the various agency holdings and networks (RMSI, 2013). This is most likely a long-term endeavour. In the mean-time, meteorological data from sites in Oman and Saudi Ara-bia could be incorporated in the regression modelling and thereby reduce uncertainty in interpolated weather generator parameters for adjacent areas.
Many of the suggested predictors can be derived from a DEM, so this represents the minimum data require-ment. None of the proposed statistical developments are more data intensive than the existing model. Nevertheless, there is clearly a trade-off between the amount/quality of available meteorological data for calibration and the parsi-mony/confidence placed in model parameters. The approach is still applicable even if predictability varies amongst param-eters (as is the case, see Table 3 final column). However, skil-ful estimation of precipitation occurrence (PWET), amount
[image:16.595.128.466.213.311.2]R. L. Wilby and D. Yu: Rainfall and temperature estimation for a data sparse region 3953
46
Figure 19 Observed (OBS) and generated (WGOBS, WGALL, WGWH) cumulative precipitation totals for the growing seasons of 2001 and 2002 at Taiz
0 100 200 300 400 500 600
May Jun Jul Aug Sep Oct Nov
Cu
mu
la
tiv
e p
re
ci
pi
ta
tio
n (
mm)
2001
OBS WGOBS WGALL WGWH
0 100 200 300 400 500 600
May Jun Jul Aug Sep Oct Nov
Cu
mu
la
tiv
e p
re
ci
pi
ta
tio
n (
mm)
2002
[image:17.595.123.465.64.165.2]OBS WGOBS WGALL WGWH
Fig. 19. Observed and generated cumulative precipitation totals for the growing seasons of 2001 and 2002 at Taiz.
(RTOT) and mean temperature (ATBAR) should be regarded as a minimum performance threshold.
The weather generator demonstrated for Taiz was applied to point data, but there is no reason why it might not be calibrated using daily gridded meteorological data. In fact, given the growing availability of gridded rainfall products (e.g. Yatagai et al., 2009), this might enhance transferabil-ity of our approach. Calibrating with gridded data also raises the prospect of generating basin-scale rainfall (noting that in semi-arid environments, area-average rainfall is less mean-ingful than distributed rainfall for hydrological simulation).
6 Conclusions
Yemen faces many complex economic, political and social challenges. Some commentators have suggested that climate change is best regarded as a threat multiplier that may ex-acerbate existing natural resource constraints (Johnstone and Mazo, 2011). Hence, climate information is seen as a funda-mental tool by development agencies for benchmarking re-source scarcity, for evaluating “hot spots” of climate risk, and for appraising adaptation options. However, Yemen is ham-pered by a very low density of meteorological observations and a climate regime characterised by complex topographic gradients and extreme weather events. This paper described rudimentary climate mapping and local weather simulation based on modelling techniques that are forgiving of these very real data constraints.
A prototype weather generator for Yemen faithfully repro-duced daily and annual diagnostics when run with parameters derived from observed temperature and precipitation series. Even when temperature parameters were interpolated from regression equations only a modest reduction in skill for per-sistence and cool bias (1◦C) emerged for the test site.
Pre-cipitation simulation was more problematic. In this case, pa-rameters obtained from observations yielded realistic daily wet-day occurrence, wet-day amount distributions, maxima, annual totals and variability. However, when run with inter-polated parameters, the frequency of wet days, mean wet-day amount, annual totals and variability were all underestimated at the test site. Stratification of the sites used for calibration improved the representation of growing season totals but did
not produce more realistic annual totals. RMSEs for annual precipitation totals were of the order 100 mm – more than the average annual rainfall of the Rub al-Khali desert in the central northern region of Yemen.
From this pilot study we conclude that local terrain and remotely sensed variables can be used to infer annual mean temperature and precipitation across the most populous, south-west area of Yemen. Important features of the daily and seasonal weather can also be simulated at the site scale, but more rigorous validation is ultimately constrained by lack of data. International support for expanding the observ-ing network, consolidatobserv-ing and recoverobserv-ing data will serve to strengthen future analyses. For the time being, there is scope to broaden the range of model inputs to better discriminate different types of landscape unit.
Until tested elsewhere we can only speculate about the transferability of our approach. However, the experimental design was intended to explore this important aspect within the confines of our two rainfall networks for Yemen (by cal-ibrating and validating the model using different data sets). Satisfactory performance for the test site at Taiz suggests that the model is transferrable even when skill is assessed against a diverse set of metrics. Moreover, we deliberately build the model using information that is in the public domain, and in-tuitively related to local weather (e.g. elevation, latitude). In due course, our approach could be tested in other data scarce and climate vulnerable regions such as central Asia or eastern Africa.
Acknowledgements. The authors thank the Republic of Yemen National Water Resources Authority (NWRA) and Ministry of Agriculture and Irrigation (MAI) for providing rainfall and tem-perature data. The work was supported by the World Bank and the United Nations International Fund for Agricultural Development (IFAD). Logistical support provided by Gamal Al Harrani is gratefully acknowledged, as are the constructive suggestions of Doug Nychka during preliminary phases of the research. The paper was improved by comments received from Mark Amo-Boateng and two anonymous referees.
Edited by: B. Schaefli
3954 R. L. Wilby and D. Yu: Rainfall and temperature estimation for a data sparse region
References
Almazroui, M.: Calibration of TRMM rainfall climatology over Saudi Arabia during 1998–2009, Atmos. Res., 99, 400–414, 2011.
Atkins, W. S. and Partners in association with Binnie and Partners: Feasibility study for Wadi Bana and Abyan Delta Development Plan. Vol. II. Annex A: Hy-drology and Water Resources, 153 pp., available at: http://www.spate-irrigation.org/wordpress/wp-content/uploads/ Feasibility_Study_Wadi_Bana_and_Abyan.pdf (last access: 12 June 2013), 1984.
Beskok, T. E.: Forestry problems of the Yemen Arab Republic and possibilities for afforestation, Rome, UN FAO Highlands Farm Development Project, AG S:SF/YEM 9, Rome, 1971.
Bruggeman, H. Y.: Agro-climatic resources of Yemen, Dhamar, Agricultural Research and Extension Authority, Ministry of Agriculture and Water Resources, FAO – Environmen-tal Resource Assessment for Rural Land Use Planning GCP/YEM/021/NET, Rome, 1997.
Buishand, T. A. and Brandsma, T.: Multisite simulation of daily pre-cipitation and temperature in the Rhine basin by nearest-neighbor resampling, Water Resour. Res., 37, 2761–2776, 2001.
Burton, A., Fowler, H. J., Kilsby, C. G., and O’Connell, P. E.: A stochastic model for the spatial-temporal simulation of nonho-mogeneous rainfall occurrence and amounts, Water Resour. Res., 46, W11501, doi:10.1029/2009WR008884, 2010.
Daly, C., Neilson, R. P., and Phillips, D. L.: A statistical topographic model for mapping climatological precipitation over mountain-ous terrain, J. Appl. Meteorol., 33, 140–158, 1994.
Daly, C., Halbleib, M., Smith, J. I., Gibson, W. P., Doggett, M. K., Taylor, G. H., Curtis, J., and Pasteris, P. P.: Physiographically sensitive mapping of climatological temperature and precipita-tion across the conterminous United States, Int. J. Climatol., 28, 2031–2064, 2008.
Environmental Protection Agency (EPA): First National Report to the Convention on Biological Diversity, The Republic of Yemen Ministry of Water and Environment, Yemen, 99 pp., 2004. Farquharson, F. A. K., Plinston, D. T., and Sutcliffe, J. V.: Rainfall
and runoff in Yemen, Hydrolog. Sci. J., 41, 797–811, 1996. Goovaerts, P.: Geostatistical approaches for incorporating elevation
into the spatial interpolation of rainfall, J. Hydrol., 228, 113–129, 2000.
Grant, R. H., Hollinger, S. E., Hubbard, K. G., Hoogenboom, G., and Vanderlip, R. L.: Ability to predict daily solar radiation val-ues from interpolated climate records for use in crop simulation models, Agr. Forest Meteorol., 127, 65–75, 2004.
Grolier, M. J., Tibbitts, G. C., and Ibrahim, M. M.: A qualitative appraisal of the hydrology of the Yemen Arab Republic from Landsat images, US Agency for International Development, Ge-ological Survey Water Supply Paper 1757-P, Washington, 80 pp., 1984.
Guenni, L. and Hutchinson, M. F.: Spatial interpolation of the pa-rameters of a rainfall model from ground-based data, J. Hydrol., 213, 335–347, 1998.
Habib, E. H. and Narsollahi, N.: Evaluation of TRMM-TMPA satel-lite rainfall estimates over arid regions. American Geophysical Union, Fall Meeting 2009, abstract #H12A-02, San Francisco, 2009.
Harris, I., Jones, P. D., Osborn, T. J., and Lister, D. H.: Updated high-resolution grids of monthly climatic observations – the CRU TS3.10 Dataset, Int. J. Climatol., doi:10.1002/joc.3711, 2013.
Huffman, G. J., Adler, R. F., Bolvin, D. T., Gu, G. J., Nelkin, E. J., Bowman, K. P., Hong, Y., Stocker, E. F., and Wolff, D. B.: The TRMM multi-satellite precipitation analysis (TMPA): Quasi-global, multi-year, combined-sensor precipitation estimates at fine scale, J. Hydrometeorol., 8, 38–55, 2007.
Human Development Report [HDR]: Sustainability and Equity: A Better Future for All, United Nations Development Programme, New York, 2011.
Hutchinson, M. F.: Stochastic space-time weather models from ground-based data, Agr. Forest Meteorol., 73, 237–264, 1995. Hutchinson, M. F., McKenney, D. W., Lawrence, K., Pedlar, J.
H., Hopkinson, R. F., Milewska, E., and Papadopol, P.: Devel-opment and testing of Canada-wide interpolated spatial models of daily minimum-maximum temperature and precipitation for 1961–2003, J. Appl. Meteorol. Climatol., 48, 725–741, 2009. Johnson, G. L., Daly, C., Taylor, G. H., and Hanson, C. L.:
Spa-tial variability and interpolation of stochastic weather simulation model parameters, J. Appl. Meteorol., 39, 778–796, 2000. Johnstone, S. and Mazo, J.: Global warming and the Arab spring,
Survival: Global Politics and Strategy, 53, 11–17, 2011. Jones, D. A. and Kay, A. L.: Uncertainty analysis for estimating
flood frequencies for ungauged catchments using rainfall-runoff models, Adv. Water Resour., 30, 1190–1204, 2007.
Kigobe, M., McIntyre, N., Wheater, H., and Chandler, R.: Multi-site stochastic modelling of daily rainfall in Uganda, Hydrolog. Sci. J., 56, 17–33, 2011.
Kokkonen, T. S., Jakeman, A. J., Young, P. C., and Koivusalo, H. J.: Predicting daily flows in ungauged catchments: model region-alization from catchment descriptors at the Coweeta Hydrologic Laboratory, North Carolina, Hydrolog. Process., 17, 2219–2238, 2003.
Lakshmi, V.: The role of satellite remote sensing in the Prediction of Ungauged Basins, Hydrol. Process., 18, 1029–1034, 2004. Pereira, P., Oliva, M., and Baltrenaite, E.: Modelling extreme
pre-cipitation in hazardous mountainous areas. Contribution to land-scape planning and environmental management, J. Environ. Eng. Land., 18, 329–342, 2010.
Rappold, G. D.: Precipitation analysis and agricultural water avail-ability in the Southern Highlands of Yemen, Hydrol. Process., 19, 2437–2449, 2005.
RMSI: Development of Climate Information System for Enhanced Climate Resilience in Yemen. Vol. 1: Information System Anal-ysis Report, Pilot Program for Climate Resilience (PPCR), Min-istry of Water and Environment, Yemen Republic, 2013. Shahin, M.: Water resources and hydrometeorology of the Arab
Re-gion, Water Science and Technology Library, Springer, Delft, the Netherlands, 2007.
Tian, Y. D. and Peters-Lidard, C. D.: A global map of uncertain-ties in satellite-based precipitation measurements, Geophys. Res. Lett., 37, L24407, doi:10.1029/2010GL046008, 2010.
Wilby, R. L.: Climate change scenarios for the Republic of Yemen, Report on behalf of the World Bank, Washington DC, 27 pp., 2008.
R. L. Wilby and D. Yu: Rainfall and temperature estimation for a data sparse region 3955
Wilby, R. L.: Daily weather generation for data sparse regions: Model development and testing in Yemen, Report on behalf of the World Bank, Washington DC, 6 pp., 2009a.
Wilby, R. L.: An evaluation of climate data and downscaling options for Yemen, Report on behalf of the World Bank, Washington DC, 31 pp., 2009b.
Wilby, R. L. and Yu, D.: Mapping climate change impacts on small-holder agriculture in Yemen using GIS modeling approaches, Final Technical Report on behalf of the International Fund for Agricultural Development (IFAD), IFAD, Rome, 80 pp., 2013. Wilby, R. L., Conway, D., and Jones, P. D.: Prospects for
downscal-ing seasonal precipitation variability usdownscal-ing conditioned weather generator parameters, Hydrol. Process., 16, 1215–1234, 2002. Wilks, D. S.: Multisite generalization of a daily stochastic
precipi-tation generation model, J. Hydrol., 210, 178–191, 1998. Wilks, D. S.: Simultaneous stochastic simulation of daily
precipita-tion, temperature and solar radiation at multiple sites in complex terrain, Agr. Forest Meteorol., 96, 85–101, 1999.
Wilks, D. S.: A gridded multisite weather generator and syn-chronization to observed weather data, Water Resour. Res., 45, W10419, doi:10.1029/2009WR007902, 2009.
Wilks, D. S. and Wilby, R. L.: The weather generation game: a re-view of stochastic weather models, Prog. Phys. Geogr., 23, 329– 357, 1999.
World Bank: Yemen Assessing the Impacts of Climate Change and Variability on the Water and Agricultural Sectors and the Policy Implications, Sustainable Development Sector Department Mid-dle East and North Africa Region, Report No. 54196-YE, World Bank, Washington DC, 102 pp., 2010.
Yatagai, A., Arakawa, O., Kamiguchi, K., Kawamoto, H., Nodzu, M. I., and Hamada, A.: A 44-year daily gridded precipitation dataset for Asia based on a dense network of rain gauges, SOLA, 5, 137–140, 2009.