www.hydrol-earth-syst-sci.net/17/5185/2013/ doi:10.5194/hess-17-5185-2013
© Author(s) 2013. CC Attribution 3.0 License.
Hydrology and
Earth System
Sciences
Influence of soil, land use and climatic factors on the hydraulic
conductivity of soil
N. Jarvis, J. Koestel, I. Messing, J. Moeys, and A. Lindahl
Department of Soil & Environment, Swedish University of Agricultural Sciences, Box 7014, 750 07 Uppsala, Sweden Correspondence to: N. Jarvis (nicholas.jarvis@slu.se)
Received: 30 July 2013 – Published in Hydrol. Earth Syst. Sci. Discuss.: 19 August 2013 Revised: 15 November 2013 – Accepted: 23 November 2013 – Published: 20 December 2013
Abstract. Due to inadequate data support, existing
algo-rithms used to estimate soil hydraulic conductivity, K, in (eco)hydrological models ignore the effects of key site fac-tors such as land use and climate and underplay the signifi-cant effects of soil structure on water flow at and near satura-tion. These limitations may introduce serious bias and error into predictions of terrestrial water balances and soil mois-ture status, and thus plant growth and rates of biogeochem-ical processes. To resolve these issues, we collated a new global database of hydraulic conductivity measured by ten-sion infiltrometer under field conditions. The results of our analyses on this data set contrast markedly with those of ex-isting algorithms used to estimateK. For example, saturated hydraulic conductivity,Ks, in the topsoil (<0.3 m depth) was found to be only weakly related to texture. Instead, the data suggests thatKs depends more strongly on bulk density, or-ganic carbon content and land use. In this respect, oror-ganic carbon was negatively correlated withKs, presumably due to water repellency, whileKsat arable sites was, on average, ca. 2–3 times smaller than under natural vegetation, forests and perennial agriculture. The data also clearly demonstrates that clay soils have smallerKin the soil matrix and thus a larger contribution of soil macropores toKat and near saturation.
1 Introduction
Soil hydraulic properties determine water fluxes and stor-ages and thus a range of key biogeochemical processes in the earth’s critical zone (NRC, 2001; Lin, 2010). In partic-ular, the hydraulic conductivity of surface soil layers at and near saturation is an important parameter regulating the par-titioning of precipitation between surface runoff and
2008), but these are rarely used, probably because the soil structure descriptors required by these approaches are sub-jectively assessed and not widely available.
Existing global databases and pedotransfer functions for
Ks have several other limitations. For example, they do not address the significant effects of land use and vegetation types on Ks that have been demonstrated in several local-and regional-scale studies (e.g. Gonzalez-Sosa et al., 2010; Thompson et al., 2010; Wang et al., 2013). Although few studies have addressed the question, climatic factors might also be expected to affect soil structure andKs through in-teractions with vegetation and thus the abundance of root and faunal biopores (Thompson et al., 2010) or physical pro-cesses such as freezing and thawing (Hu et al., 2012), water repellency (Wang et al., 2009) and swelling and shrinkage. In a modeling context, errors resulting from the use of param-eter estimation routines that ignore these important site con-trols on saturated hydraulic conductivity may result in sig-nificant errors in the partitioning between infiltration/runoff and evaporation/recharge in hydrological models (e.g. Davis et al., 1999; Chirico et al., 2010), soil moisture contents and simulated rates of biogeochemical processes in soils (e.g. nu-trient cycling and carbon turnover).
Pedotransfer functions based on field measurements should give more accurate predictions of saturated and near-saturated hydraulic conductivity than laboratory-based methods. In particular, unconfined infiltration measurements made using permeameters that supply water to the soil un-der a slight tension (so-called tension infiltrometers) reflect the impact of the fragile structural macropores that dominate flow at and close to saturation (Watson and Luxmoore, 1986; Jarvis and Messing, 1995; Jarvis, 2008). The first tension in-filtrometer was designed as early as the mid-1970s (Dixon, 1975), but the technique really only became popular follow-ing the development of simple methods to estimate hydraulic properties from measured unconfined three-dimensional in-filtration rates in the field (Ankeny et al., 1991; Reynolds and Elrick, 1991). There is now a large amount of histor-ical experimental data on hydraulic conductivity measured by tension infiltrometer in the peer-reviewed literature. Sur-prisingly, no serious attempts have been made to synthesize or analyze this data to derive global pedotransfer functions for saturated and near-saturated hydraulic conductivity. We are aware of only two previous studies of this type, both of which were only of limited scope, based on small data sets (Jarvis et al., 2002; Moosavi and Sepaskhah, 2012).
In this study, we present a global database of measure-ments made by tension infiltrometer collated from the pub-lished peer-reviewed literature. We also present the results of some preliminary statistical analyses carried out on this com-prehensive data set to elucidate the influence of soil proper-ties and land use and climatic factors on the near-saturated and saturated hydraulic conductivity of soil.
2 Methods
2.1 Data collection
Data on hydraulic conductivity,K, as a function of water tension,ψ, measured by tension infiltrometer was collated from the published literature through ISI Web of Science and Google scholar searches. Data presented in tables were taken directly, while figures were digitized to extract paired
K,ψvalues. Average values presented for a given plot were recorded in the database, even if data for individual replicates was available. A plot was defined as a measurement location for which all entries in the database for potential predictor variables are identical. Data for a given plot was only entered into the database if the measurements were made on undis-turbed soil and for at least 3 pairedK,ψvalues. A few stud-ies only reported steady-state infiltration rates. In these cases, we calculated hydraulic conductivity from steady-state infil-tration using the method of Ankeny et al. (1991), knowing the diameter of the ring. Many studies report hydraulic con-ductivity at zero tension derived from unconfined infiltration measurements. In our experience, such measurements are li-able to error due to leaks from the infiltrometer. This implies that the actual supply potential in these cases must have been slightly negative, since such leakages are quite obvious. For this reason, we assumed a nominal supply tension of 1 mm whenever hydraulic conductivity data were reported at zero tension.
In total, the database includes 753 individual data sets from 124 different published studies at 144 different loca-tions worldwide (see supplementary material). Comprehen-sive auxiliary metadata and information on measurement and calculation methods, site characteristics and soil properties was also entered into the database (see Tables 1 and 2), which can also be obtained on request from the correspond-ing author. Among the studies included in the database, cli-mate data for the measurement sites was only infrequently reported. Thus, we estimated climate variables at each lo-cation using the FAO New LocClim model (http://www.fao. org/nr/climpag/pub/en3_051002_en.asp), which uses inverse distance weighting to spatially interpolate measured long-term meteorological data records for a global network of sites. In some of the studies included in the database, an-nual average precipitation was also reported (see Table 2), and this data was used to successfully validate the New Loc-Clim estimates (see Supplement).
2.2 Summarizing the hydraulic conductivity data
Table 1. Class variables recorded in the database.
Group Variable Number in each class
Land use
Arable 471
Rotational (e.g. including ley/fallow) 62 Perennial agriculture (e.g. managed grassland, orchards) 91
Forests 33
Natural grassland/bush/tundra/savannna 66
Other 20
Total 743
Tillage
If land use = arable or rotational
Conventional 250
Reduced/minimum/conservation 70
No-till 82
Total 402
Texture classa
Coarse 41
Medium 279
Medium-fine 209
Fine 208
Organic 2
Total 739
Methods
Estimation of conductivity from infiltration
1-D confined (columns, rings)b 102 Steady-state, multiple tensions, single log-linearc 77 Steady-state, multiple tensions, piece-wise log-lineard 506 Steady-state, multiple disc radiie 9
Transientf 46
Other methods 13
Total 753
Sequence of supply tensions
Dry to wet 386
Wet to dry 105
Total 491
Month of measurement (first, last)
Total 616
abased on the USDA system: coarse is sand or loamy sand; medium is sandy loam, loam, sandy clay loam or sandy clay;
medium-fine is silt loam or silt; fine is clay, silty clay, silty clay loam or clay loam.bconfined infiltration: steady-state flow
rate is assumed equal to hydraulic conductivity.cfollowing Logsdon and Jaynes (1993).dfollowing, for example, Reynolds and Elrick (1991) or Ankeny et al. (1991).efollowing Smettem and Clothier (1989).fmethods requiring early time
transient infiltration measurements e.g., Vandervaere et al. (2000).
hydraulic conductivity to the reported data (Jarvis, 2008):
K(ψ ) Ks
=(ψmin
ψ )
n∗
, ψ≥ψmin, (1)
K(ψ )=Ks, ψ < ψmin, (2)
whereKsis the saturated hydraulic conductivity,ψminis the water/air-entry tension corresponding to the largest pore in the soil andn∗, which reflects macropore size distribution
and tortuosity (Jarvis, 2008), is given by the slope ofK(ψ )
on a plot of logK vs. logψ. It should be noted thatψmin (and thereforeKs)could not be defined for many data sets, since measurements were not made at supply tensions close enough to saturation (see Fig. 1 for an example). For this rea-son, fitted values ofn∗and, where possible,ψminwere stored in the database together withKestimated atψ=10 cm, the
Table 2. Continuous variables recorded in the database, with some descriptive statistics.
Number of
Group Variable and units entries Descriptive statisticsa
Soil properties
Clay content,fclay(kg kg−1) 616 (0.003, 0.19, 0.80), 0.14 Silt contentb(kg kg−1) 530 (0.008, 0.40, 0.78), 0.20 Sand contentb(kg kg−1) 528 (0.01, 0.29, 0.97), 0.23 Bulk density,γ(g cm−3) 376 (0.60, 1.32, 1.90), 0.22 Organic carbon content,foc(kg kg−1) 469 (0.0007, 0.014, 0.167), 0.021
Site location and climate
Latitude, longitude (degrees) 144 Annual precipitation (reported by authors; mm) 55
Estimated annual precipitationc,Pest(mm) 144 (130, 638, 3692), 376
Estimated mean annual temperaturec,Test(◦C) 144 (0.6, 11.3, 29.0), 4.8
Estimated annual potential evapotranspirationc(mm) 144 Potential net primary productivityc(g DM m−2yr−1) 144
Methods
Depth of measurement (m) 753 (0,0,4.0), 0.19
Minimum and maximum supply tensions (mm) 753 (0,0,50), 10.4 (20,105,240), 44.3 Diameter of infiltrometer (cm) 578 (4,17.3,28), 6.2
Target variables and model fit
Hydraulic conductivity at 10 cm tensiond,K10(mm h−1) 753 (−2.0,0.415,2.26), 0.61e Hydraulic conductivity at saturation,Ks(mm h−1) 753 (0.51,1.87,4.78), 0.59f
Slope of theK(ψ )functiond,g(-) 753 Tension equivalent to largest pore in soild,h 528
R2value of model fit 753
aminimum, median and maximum values in parentheses, standard deviation outside parentheses.bstandardized, where necessary, to the USDA system, using
log-linear interpolation.cestimated using FAO New LocClim.destimated by fitting to Jarvis (2008).elog10(K10)for data entries with maximum supply tension
≥80 mm (n=537).flog
10(Ks)for data entries with minimum supply tension≤5 mm (n= 470).g=n∗in Eq. (1).h=ψ
minin Eq. (1).
any tension for each data set. Eq. (1) gaveR2values larger than 0.9 for ca. 90 % of the individual data sets (Fig. 2).
2.3 Multivariate regression
Multivariate ordinary least-squares regression (MLR) mod-els were developed for hydraulic conductivity at saturation,
Ks, and 10 cm tension, K10, and for the contribution of macropores toKs (=Ks–K10, hereafter termedKs(ma)) us-ing a “bootstrappus-ing” procedure (re-samplus-ing with replace-ment) in which 63 % (on average) of the data points are used to build equations, while 37 % (on average) are not sampled and thus retained for validation. The bootstrapping proce-dure was repeated 250 times to ensure stable results. MLR cannot easily deal with categorical variables, and especially with hierarchical dependencies among them (i.e. land use and tillage systems, see Table 1). However, land use was included as a potential predictor variable by defining binary variables (1=yes, 0=no) for three broader land use classes that re-flect traffic and cultivation intensity: arable or rotational
Fig. 1
Fig. 1. Example fits of Eq. (1) to the data.
Fig. 2
Fig. 2. The distribution ofR2values for fits of Eq. (1) to the data sets in the database.
We excluded two organic soils from the MLR analysis, since as extreme outliers these could have biased regressions that use organic carbon content as a predictor. We also ex-cluded measurements made in the subsoil (i.e. where the infiltrometer was placed at depths >0.3 m), since we as-sumed that the influence of land use and climate would be stronger in topsoil than in subsoil. Ideally, we would have liked to develop separate regression equations for subsoil data, but the number of data points was too small: only 32 entries in the database refer to measurements carried out at depths>0.3 m. We also excluded records for which ex-trapolation too far beyond the range of measured data was needed to estimate hydraulic conductivity from the model fits (see Table 3). We also investigated whether better MLR models could be obtained by excluding data sets for which Eq. (1) fitted poorly. However, no clear improvements were
Table 3. Criteria for data inclusion in the multivariate regression
analysis.
Target variable Criteria
Ks Mineral soil (Texture class6=Organic)
Topsoil (Measurement depth≤0.3 m) Minimum supply tension≤0.5 cm
K10 Mineral soil (Texture class6=Organic)
Topsoil (Measurement depth≤0.3 m) Maximum supply tension≥8 cm Method ofKestimation: 3-D unconfined (from steady-state infiltration, assuming
K(ψ )is piecewise log-linear), dry-to-wet sequence of supply tensions
Ks(ma) Mineral soil (Texture class6=Organic)
Topsoil (Measurement depth≤0.3 m) Minimum supply tension≤0.5 cm Maximum supply tension≥8 cm
obtained for a range of cutoff R2 values tested, and so no such limitation was imposed.
3 Results and discussion
Table 1 shows that, in contrast to UNSODA, medium- and fine-textured soils are very well represented in the database. As noted above, this is because tension infiltrometry has been widely applied to study the effects of soil structure on hy-draulic conductivity. Table 1 also shows that ca. 72 % of the data entries are from arable/rotational sites, 15 % from man-aged permanent grassland or perennial agriculture (e.g. or-chards), while the remaining data (ca. 13 %) comes from forests or natural vegetation. Table 4 illustrates the relation-ship between soil texture and three broad land use types, which represent different degrees of cultivation and traffic intensity. Applying Pearson’s chi-squared test to the joint frequency distribution shown in Table 4 suggests that it is not homogeneous and that a significant interaction exists between the two variables. Most of this is due to the pre-dominance of natural vegetation and forest sites on coarse-textured soils: this combination of land use and soil texture class represents more than half of the total chi-squared value (Table 4).
Figure 3 shows the relationships between two of the target variables, the saturated hydraulic conductivity,Ks, and the saturated hydraulic conductivity of the soil matrix (defined as
[image:5.595.323.532.92.264.2] [image:5.595.50.287.323.468.2]Table 4. Contingency table for soil texture and land use classes (mineral topsoils only). The overall chi-squared statistic is 83.2, with
p <0.0001).
Land use1 Texture class
2
Coarse Medium Medium-fine Fine Total
LUT0 Observed 22 32 22 20 96
Expected 5.2 36.4 29.2 25.2
Cell chi-squared 54.59 0.54 1.78 1.07
LUT1 Observed 0 41 12 16 69
Expected 3.7 26.2 21.0 18.1
Cell chi-squared 3.72 8.40 3.86 0.24
LUT2 Observed 14 180 169 139 502
Expected 27.1 190.4 152.8 131.7
Cell chi-squared 6.33 0.57 1.72 0.40
Total 36 253 203 175 667
1LUT0 represents natural vegetation or forest, LUT1 represents perennial agriculture, LUT2 represents arable or
[image:6.595.349.508.340.408.2]rotational agriculture.2see Table 1 for explanations.
Table 5. Results of analysis of variance for logK10: pair-wise com-parison of means forKestimation methods.
Mean logK10∗
Method (mm h−1)
Steady-state, multiple tensions, 0.831a single log-linear
Other methods 0.827a
1D confined (columns, rings) 0.686a Steady-state, multiple disc radii 0.660a,b Steady-state, multiple tensions, 0.317b,c piece-wise log-linear
Transient 0.273c
∗Means with same letter are not significantly different atp=0.05.
more coarse-textured soils. As has previously been found for smaller regional-scale data sets (Børgesen et al., 2006), the largest macropore hydraulic conductivities (=Ks–K10) are generally found for finer-textured soils of smaller matrix hydraulic conductivity. Furthermore, contrary to the predic-tions of widely used estimation algorithms, Fig. 3 suggests that there is no clear trend of Ks with soil texture. Thus, on average, Ks in clayey-textured soils is just as large as in non-structured sands, due to the contribution of macrop-ores. One important caveat here is that more than 90 % of the measurements in the database were made in the top-soil (<0.3 m depth), due to the practical difficulties of ap-plying this technique in subsoil. Although we cannot test the hypothesis here, it seems likely that textural controls on
Ks should become more dominant in deeper subsoil, where the effects of structure-forming biological and physical pro-cesses are weaker. Figure 3 also illustrates the extent of cor-relations between potential predictor variables of hydraulic
Table 6. Results of analysis of variance for logK10: pair-wise com-parison of means for supply tension sequence.
Mean logK10∗
Method (mm h−1)
Wet-to-dry 0.736a
Unknown/unspecified 0.698a
Dry-to-wet 0.471b
∗Means with same letter are not significantly different
atp=0.05.
conductivity. For example, coarse-textured soils tend to have somewhat larger bulk densities and smaller organic carbon contents. Organic carbon content also tends to be larger in soils under natural vegetation, while bulk density shows no apparent trend with land use. The two climate variables in the database show no significant correlation with soil properties, with the exception of annual average air temperature, which is weakly and positively correlated with clay content.
In the absence of confining rings or cores, unconfined three-dimensional infiltration occurs from the base plate of the infiltrometer and the measured infiltration rates must therefore be converted to an estimate of (one-dimensional) hydraulic conductivity. Several methods have been proposed, but Table 1 shows that those based on steady-state infil-tration and a piece-wise log-linear approximation toK(ψ )
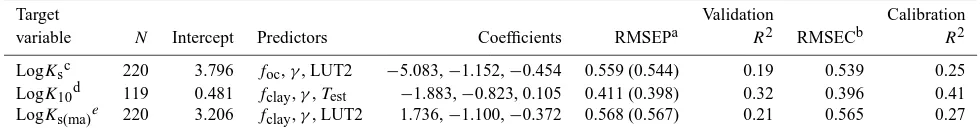
[image:6.595.73.261.342.464.2]Table 7. Multivariate ordinary linear regression models (focis soil organic carbon content, kg kg−1;fclayis the soil clay content kg kg−1;
γis the soil bulk density, g cm−3;Testis the annual average air temperature,◦C; LUT2=1 if land use is arable or rotational).
Target Validation Calibration
variable N Intercept Predictors Coefficients RMSEPa R2 RMSECb R2
LogKsc 220 3.796 foc,γ, LUT2 −5.083,−1.152,−0.454 0.559 (0.544) 0.19 0.539 0.25 LogK10d 119 0.481 fclay,γ,Test −1.883,−0.823, 0.105 0.411 (0.398) 0.32 0.396 0.41 LogKs(ma)e 220 3.206 fclay,γ, LUT2 1.736,−1.100,−0.372 0.568 (0.567) 0.21 0.565 0.27
aRMSEP is the validation root mean square error of prediction. Figures in parentheses are the minimum RMSEP’s of all 255 models that were tested.bRMSEC is the root
mean square error (calibration data).cSaturated hydraulic conductivity (mm h−1).dHydraulic conductivity at 10 cm tension (mm h−1).e=Ks–K10(mm h−1).
give significantly different results (Jacques et al., 2002; Ven-trella et al., 2005), as can the direction of the sequence of infiltration runs (e.g. Clothier and Smettem, 1990; Bagarello et al., 2007). We therefore performed an analysis of vari-ance for logKs, logKs(ma)and logK10 for these two factors to check whether such effects were apparent in the database. No significant effects of measurement method or hystere-sis were detected for logKs or logKs(ma), but both factors were highly significant for logK10 (see Tables 5 and 6). To check whether this result was affected by correlations with soil factors, we applied a chi-squared test to contingency ta-bles of experimental methods against soil texture class. This analysis showed some significant bias with texture for the lesser-used methods ofKdetermination, perhaps arising by chance due to small sample sizes, but none (with 97.3 % confidence) for the two dominant methods in the database (see Table 1). Of these two methods,K10was largest for the least-squares regression method proposed by Logsdon and Jaynes (1993), which assumes a log-linear, near-saturated
K(ψ )function of constant slope (see Table 5). As noted by Logsdon and Jaynes (1993), this method may perform poorly if it is applied across a wide range of tensions in strongly structured soils, where the slope of logK vs. ψ often de-creases markedly across the tension range close to satura-tion (Jarvis and Messing, 1995). This limitasatura-tion may not have been widely appreciated and understood, which may be why
K10values were largest for this method. The analysis also in-dicated hysteresis effects, with largerK10values, on average, for drainage (i.e. wet-to-dry) sequences (Table 6). Thus, as a result of this analysis, a more restricted data set was used to develop MLR models for logK10, consisting of data obtained from steady-state unconfined (i.e. 3-D) infiltration tests mea-sured for a dry-to-wet sequence of supply tensions and as-suming a piece-wise log-linear approximation toK(ψ ) (Ta-ble 3).
Table 7 shows selected bootstrapped multivariate ordi-nary least-squares regression (MLR) models forKs,K10and
Ks(ma) (=Ks–K10). Figure 4a–d illustrates the performance of the model forKs. Corresponding plots forK10andKs(ma) are presented in the supplementary material. The use of the Akaike information criterion favored the selection of rela-tively parsimonious models with only three predictor
vari-ables (Table 7). It can be noted that the validation root mean square error of prediction for these models was only 1–3 % larger than for the best-fit models, which contained more pre-dictors (Table 7). The predictive power of the selected mod-els is relatively modest, with validationR2values from 0.19 to 0.32 and RMSEP values for log K ranging from 0.41 to 0.57 (Table 7). These performance statistics are slightly better for the calibration data (Table 7), and also compare favorably to the performance of existing estimation algo-rithms (Vereecken et al., 2010). Indeed, better accuracy can almost certainly not be expected, because (i) the measure-ments in a global database like this may be influenced by unknown differences in experimental conditions and proce-dures (Reynolds, 2006), (ii) it seems highly likely that there are many complex non-linear and/or hierarchical dependen-cies between variables in the data set that simple linear, addi-tive, models cannot capture, and (iii)Kat and close to satu-ration depends on the geometry and topology of a few larger soil pores, which may not be strongly correlated with prop-erties of the bulk soil (Ghafoor et al., 2013). This is also the reason for the large and apparently random short-range spa-tial variation inKs frequently found in field, hillslope and catchment-scale studies (Mallants et al., 1996; Buttle and House, 1997; Shouse and Mohanty 1998).
Fig. 3
Fig. 3. Scatter-plot matrix showing relationships between variables in the database. The symbols represent texture classes (angled cross for
coarse, cross for medium, triangle for medium-fine, open circle for fine, square for unknown; see also Table 1), while the colors represent land use classes (olive green is LUT0, natural vegetation or forests; purple is LUT1, perennial agriculture; sky blue is LUT2, arable or rotational agriculture; black is unknown land use; see also Table 1). The thin red lines represent non-linear regression (locally weighted least-squares regression, LOESS) fits to the measured data. The figures in the main diagonal show a kernel density estimate for the variable (an estimate of the probability density function). Pearson correlation coefficients are shown in the panes to the right of the main diagonal.Testis in◦C,
Pestin mm yr−1,γ in g cm−3,fclayandfocin kg kg−1, and log10(K10)and log10(KS)in log10(mm h−1).
analysis are supported by several local- and regional-scale studies, which show reduced near-saturated and saturated hy-draulic conductivity in cultivated soil compared with soil un-der natural vegetation (e.g. Bridge and Bell, 1994; Whitbread et al., 2000; Fuentes et al., 2004; Zhou et al., 2008; Wang et al., 2013). A significant effect of bulk density onKs was also detected (Table 7, Fig. 4b). In our study, this is probably mostly related to the effects of temporal variations in porosity in cultivated arable topsoil due to cycles of tillage and sub-sequent consolidation, although bulk density may also affect
Ksunder natural vegetation (e.g. Hu et al., 2012).
Unsaturated hydraulic conductivity is difficult and time-consuming to measure and so is commonly estimated from measured or predictedKsvalues using capillary bundle
mod-els of the soil pore system (Van Genuchten, 1980). Using
Fig. 4
Fig. 4. (A) Measured vs. predictedKsvalues, (B) box-and-whisker plots of the bootstrapped normalized model coefficients (for un-scaled coefficients, see Table 7), (C) residuals as a function of mea-suredKs, and (D) a quantile plot showing how well the residuals match a normal distribution.
than forKs, which suggests that compaction and loosening affects K similarly across the entire near-saturated tension range. Interestingly, the annual average temperature at the site,Test, was found to be positively correlated toK10 (Ta-ble 7). The reasons for this are not clear, but one possi(Ta-ble explanation is the greater risk of soil compaction in cold cli-mates with short growing seasons, where farmers are often obliged to cultivate and traffic arable topsoil despite unfa-vorable soil conditions. Finally, the model for macropore hy-draulic conductivity,Ks(ma), suggests a positive correlation with clay content and negative correlations with bulk density and arable land use (Table 7).
4 Conclusions
The results of the bootstrapped MLR should be considered as illustrative of the main factors controlling saturated and near-saturated hydraulic conductivity in soil, but the relatively modest values obtained for the validation statistics suggests that caution should be exercised in their predictive use. In this respect, it seems likely that the application of advanced “ma-chine learning” techniques (e.g. classification and regression trees, random forests, neural networks), which can account for the complex non-linear and hierarchical relationships that unquestionably exist among many of the key predictor vari-ables will yield more powerful predictive tools. Further re-search in this direction is in progress. We also intend to
up-date the database as new data becomes available. In this re-spect, additional measurements made in subsoil and in non-arable land would be most valuable.
Nevertheless, the global explanatory analysis of the fac-tors controlling saturated and near-saturated hydraulic con-ductivity presented here gives results that contrast strikingly with existing pedotransfer functions, in that our study high-lights the dominant role played by soil structure. This can be attributed to the different data support in our study, which consists of field measurements made in topsoil rather than laboratory data. In particular, we demonstrated effects of both land use and climate onK. Arable sites have, on aver-age, ca. 2–3 times smallerKsvalues than natural vegetation, forests and perennial agriculture. Furthermore, althoughKs was only weakly correlated with soil texture,Kmeasured at a supply tension of 10 cm was significantly and inversely cor-related with clay content. Thus, clayey soils have smallerK
in the soil matrix and a larger contribution of soil macropores toKat and near saturation.
Supplementary material related to this article is
available online at http://www.hydrol-earth-syst-sci.net/ 17/5185/2013/hess-17-5185-2013-supplement.pdf.
Edited by: N. Ursino
References
Angulo-Jaramillo, R., Vandervaere, J.-P., Roulier, S., Thony, J.-L., Gaudet, J.-P., and Vauclin, M.: Field measurement of soil sur-face hydraulic properties. A review and recent developments, Soil Till. Res., 55, 1–29, 2000.
Ankeny, M. D., Ahmed, M., Kaspar, T. C., and Horton, R.: Simple field method for determining unsaturated hydraulic conductivity, Soil Sci. Soc. Am. J., 55, 467–470, 1991.
Bagarello, V., Castellini, M., and Iovino, M.: Comparison of un-confined and un-confined unsaturated hydraulic conductivity, Geo-derma, 137, 394–400, 2007.
Børgesen, C. D., Jacobsen, O. H., Hansen, S., and Schaap, M. G.: Soil hydraulic properties near saturation, an improved conductiv-ity model, J. Hydrol., 324, 40–50, 2006.
Bouma, J.: Using soil survey data for quantitative land evaluation, Adv. Soil Sci. 9, 177–213, 1989.
Bridge, B. J. and Bell, M. J.: Effect of cropping on the physical fertility of Krasnozems, Aust. J. Soil Res., 32, 1253–1273, 1994. Buttle, J. M. and House, D. A.: Spatial variability of saturated hy-draulic conductivity in shallow macroporous soils in a forested basin, J. Hydrol., 203, 127–142, 1997.
Chirico, G. B., Medina, H., and Romano, N.: Uncertainty in predict-ing soil hydraulic properties at the hillslope scale with indirect methods, J. Hydrol., 334, 405–422, 2007.
Chirico, G. B., Medina, H., and Romano, N.: Functional evaluation of PTF prediction uncertainty: an application at hillslope scale, Geoderma, 155, 193–202, 2010.
[image:9.595.49.288.63.295.2]Comegna, A., Severino, G., and Sommella, A.: Surface measure-ments of hydraulic properties in an irrigated soil using a disc permeameter, WIT Trans. Ecol. Environ., 96, 341–353, 2006. Davis, S. H., Vertessy, R. A., and Silberstein, R. P.: The
sensitiv-ity of a catchment model to soil hydraulic properties obtained by using different measurement techniques, Hydrol. Process., 13, 677–688, 1999.
Dixon, R. M.: Design and use of closed-top infiltrometers, Soil Sci. Soc. Am. Proc., 39, 755–763, 1975.
Fuentes, J. P., Flury, M., and Bezdicek, D. F.: Hydraulic properties in a silt loam soil under natural prairie, conventional till, and no-till, Soil Sci. Soc. Am. J., 68, 1679–1688, 2004.
Ghafoor, A., Koestel, J., Larsbo, M., Moeys, J., and Jarvis, N. J.: Soil properties and susceptibility to preferential solute transport in tilled topsoil at the catchment scale, J. Hydrol., 492, 190–199, 2013.
Gonzalez-Sosa, E., Braud, I., Dehotin, J., Lassabatere, L., Angulo-Jaramillo, R., Lagouy, M., Branger, F., Jacqueminet, C., Ker-madi, S., and Michel, K.: Impact of land use on the hydraulic properties of the topsoil in a small French catchment, Hydrol. Process., 24, 2382–2399, 2010.
Hu, W., Shao, M. A., and Si, B. C.: Seasonal changes in surface bulk density and saturated hydraulic conductivity of natural land-scapes, Eur. J. Soil Sci., 63, 820–830, 2012.
Jacques, D., Mohanty, B. P., and Feyen, J.: Comparison of alterna-tive methods for deriving hydraulic properties and scaling fac-tors from singe-disc tension infiltrometers, Water Resour. Res., 38, 1120, doi:10.1029/2001WR000595, 2002.
Jarvis, N. J.: A review of non-equilibrium water flow and solute transport in soil macropores: principles, controlling factors and consequences for water quality, Eur. J. Soil Sci., 58, 523–546, 2007.
Jarvis, N. J.: Near-saturated hydraulic properties of macroporous soils, Vadose Zone J., 7, 1256–1264, 2008.
Jarvis, N. J. and Messing, I.: Near-saturated hydraulic conductivity in soils of contrasting texture measured by tension infiltrometers, Soil Sci. Soc. Am. J., 59, 27–34, 1995.
Jarvis, N. J., Zavattaro, L., Rajkai, K., Reynolds, W. D., Olsen, P. A., McGechan, M., Mecke, M., Mohanty, B., Leeds-Harrison, P. B., and Jacques, D.: Indirect estimation of near-saturated hydraulic conductivity from readily available soil information, Geoderma, 108, 1–17, 2002.
Klute, A. and Dirksen, C.: Hydraulic conductivity and diffusivity: laboratory methods, in: Methods of soil analysis Part 1 – Physical and mineralogical methods, edited by: Klute, A., ASA/SSSAJ, Madison WI, USA, 687–734, 1986.
Lilly, A., Nemes, A., Rawls, W. J., and Pachepsky, Y. A.: Probabilis-tic approach to the identification of input variables to estimate hydraulic conductivity, Soil Sci. Soc. Am. J., 72, 16–24, 2008. Lin, H.: Earth’s Critical Zone and hydropedology: concepts,
char-acteristics, and advances, Hydrol. Earth Syst. Sci., 14, 25–45, doi:10.5194/hess-14-25-2010, 2010.
Lin, H. S., McInnes, K. J., Wilding, L. P., and Hallmark, C. T.: Ef-fects of soil morphology on hydraulic properties. II. Hydraulic pedotransfer functions, Soil Sci. Soc. Am. J., 63, 955–961, 1999. Logsdon, S. D. and Jaynes, D. B.: Methodology for determining hydraulic conductivity with tension infiltrometers, Soil Sci. Soc. Am. J., 57, 1426–1431, 1993.
Mallants, D., Mohanty, B. P., Jacques, D., and Feyen, J.: Spatial variability of hydraulic properties in a multi-layered soil profile, Soil Sci., 161, 167–181, 1996.
McKenzie, N. J. and Jacquier, D. W.: Improving the field estimation of saturated hydraulic conductivity in soil survey, Austr. J. Soil Res., 35, 803–825, 1997.
Moosavi, A. A. and Sepaskhah, A.: Artificial neural networks for predicting unsaturated soil hydraulic characteristics at different applied tensions, Arch. Agron. Soil Sci., 58, 125–153, 2012. National Research Council (NRC): Basic research opportunities in
earth science, National Academy Press, Washington D.C., USA, 2001.
Nemes, A., Schaap, M. G., Leij, F. J., and Wösten, J. H. M.: De-scription of the unsaturated soil hydraulic database UNSODA version 2.0, J. Hydrol., 251, 151–162, 2001.
Nemes, A., Rawls, W. J., and Pachepsky, Y. A.: Influence of organic matter on the estimation of saturated hydraulic conductivity, Soil Sci. Soc. Am. J., 69, 1330–1337, 2005.
Reynolds, W. D.: Tension infiltrometer measurements: implications of pressure head offset due to contact sand, Vadose Zone J., 5, 1287–1292, 2006.
Reynolds, W. D. and Elrick, D. E.: Determination of hydraulic con-ductivity using a tension infiltrometer, Soil Sci. Soc. Am. J., 55, 633–639, 1991.
Schaap, M. G. and Leij, F. J.: Improved prediction of unsaturated hydraulic conductivity with the Mualem-van Genuchten model, Soil Sci. Soc. Am. J., 64, 843–851, 2000.
Schaap, M. G., Leij, F. J., and van Genuchten, M. T.: ROSETTA: a computer program for estimating soil hydraulic parameters with hierarchical pedotransfer functions, J. Hydrol., 251, 163–176, 2001.
Shouse, P. J. and Mohanty, B. P.: Scaling of near-saturated hydraulic conductivity measured using disc infiltrometers, Water Resour. Res., 34, 1195–1205, 1998.
Smettem, K. R. J. and Clothier, B. E.: Measuring unsaturated sorp-tivity and hydraulic conducsorp-tivity using multiple disc permeame-ters, J. Soil Sci., 40, 563–568, 1989.
Špongrová, K., Kechavarzi, C., Dresser, M., Matula, S., and God-win, R.J.: Development of an automated tension infiltrometer for field use, Vadose Zone J., 8, 810–817, 2009.
Thompson, S. Harman, C. J., Heine, P., and Katul, G. G.: Vegetation-infiltration relationships across climatic and soil-type gradients, J. Geophys. Res.-Biogeosci., 115, G02023, doi:10.1029/2009JG001134, 2010.
Vandervaere, J.-P., Vauclin, M., and Elrick, D. E.: Transient flow from tension infiltrometers. II. Four methods to determine sorp-tivity and conducsorp-tivity, Soil Sci. Soc. Am. J., 64, 1272–1284, 2000.
Van Genuchten, M. T.: A closed form equation for predicting the hydraulic conductivity of unsaturated soils, Soil Sci. Soc. Am. J., 44, 892–898, 1980.
Ventrella, D., Losavio, N., Vonella, A. V., and Leij, F. J.: Estimat-ing hydraulic conductivity of a fine-textured soil usEstimat-ing tension infiltrometry, Geoderma, 124, 267–277, 2005.
Wang, T., Wedin, D., and Zlotnik, V. A.: Field evidence of a neg-ative correlation between saturated hydraulic conductivity and soil carbon in a sandy soil, Water Resour. Res., 45, W07503, doi:10.1029/2008WR006865, 2009.
Wang, Y. Q., Shao, M. A, Liu, Z. P., and Horton, R.: Regional-scale variation and distribution patterns of soil saturated hydraulic con-ductivities in surface and subsurface layers in the loessial soils of China, J. Hydrol., 487, 13–23, 2013.
Watson, K. W. and Luxmoore, R. J.: Estimating macroporosity in a forest watershed by use of a tension infiltrometer, Soil Sci. Soc. Am. J., 50, 578–582, 1986.
Whitbread, A. M., Blair, G. J., and Lefroy, R. D. B.: Managing legume leys, residues and fertilisers to enhance the sustainability of wheat cropping systems in Australia 2. Soil physical fertility and carbon, Soil Till. Res., 54, 77–89, 2000.
White, I. Sully, M. J., and Perroux, K. M.: Measurement of surface-soil hydraulic properties: disc permeameter, tension infiltrome-ters and other techniques, in: SSSA Special Publ. 30, edited by: Topp, G. C., Reynolds, W. D., and Green R. E., 69–103, Madi-son, WI, USA, 1992.
Wösten, J. H. M., Pachepsky, Y. A., and Rawls, W. J.: Development and use of a database of hydraulic properties of European soils, Geoderma, 90, 169–185, 1999.
Wösten, J. H. M., Lilly, A., Nemes, A., and le Bas, C.: Pedotransfer functions: bridging the gap between available basic soil data and missing soil hydraulic characteristics, J. Hydrol., 251, 123–150, 2001.