Hydrol. Earth Syst. Sci., 18, 1625–1640, 2014 www.hydrol-earth-syst-sci.net/18/1625/2014/ doi:10.5194/hess-18-1625-2014
© Author(s) 2014. CC Attribution 3.0 License.
Hydrology and
Earth System
Sciences
Open Access
Comparison of drought indicators derived from multiple data sets
over Africa
G. Naumann1, E. Dutra2, P. Barbosa1, F. Pappenberger2, F. Wetterhall2, and J. V. Vogt1 1European Commission, Joint Research Centre, Ispra, Italy
2European Centre for Medium Range Weather Forecasts, Reading, UK
Correspondence to: G. Naumann ([email protected])
Received: 13 October 2013 – Published in Hydrol. Earth Syst. Sci. Discuss.: 7 November 2013 Revised: 19 March 2014 – Accepted: 22 March 2014 – Published: 7 May 2014
Abstract. Drought monitoring is a key component to
miti-gate impacts of droughts. Lack of reliable and up-to-date pre-cipitation data sets is a common challenge across the globe. This study investigates different data sets and drought indi-cators on their capability to improve drought monitoring in Africa. The study was performed for four river basins located in different climatic regions (the Oum er-Rbia in Morocco, the Blue Nile in eastern Africa, the Upper Niger in western Africa, and the Limpopo in southeastern Africa) as well as the Greater Horn of Africa.
The five precipitation data sets compared are the ECMWF ERA-Interim reanalysis, the Tropical Rainfall Measuring Mission satellite monthly rainfall product 3B-43, the Global Precipitation Climatology Centre gridded precipitation data set, the Global Precipitation Climatology Project Global Monthly Merged Precipitation Analyses, and the Climate Prediction Center Merged Analysis of Precipitation. The set of drought indicators used includes the Standardized Precip-itation Index, the Standardized PrecipPrecip-itation-Evaporation In-dex, and Soil Moisture Anomalies.
A comparison of the annual cycle and monthly precipita-tion time series shows a good agreement in the timing of the rainy seasons. The main differences between the data sets are in the ability to represent the magnitude of the wet seasons and extremes. Moreover, for the areas affected by drought, all the drought indicators agree on the time of drought on-set and recovery although there is disagreement on the extent of the affected area. In regions with limited rain gauge data the estimation of the different drought indicators is charac-terized by a higher uncertainty. Further comparison suggests that the main source of differences in the computation of the
drought indicators is the uncertainty in the precipitation data sets rather than the estimation of the distribution parameters of the drought indicators.
1 Introduction
Assessment of drought impacts requires understanding of re-gional historical droughts as well as the behaviours on human activities during their occurrences. Traditional methods for drought assessment are mainly based on water supply indices derived from precipitation time series alone (Heim, 2002). A sparse distribution of rain gauges and short or incomplete historical rainfall records may, however, lead to significant errors in the estimation of water supply indices derived from precipitation time series.
As a consequence of drought, many countries in Africa have seen recurrent famines that affected millions of people (Rojas et al., 2011). Since precipitation is fundamental for rain-fed crops in these drought-prone regions, improvements in drought monitoring and early warning will improve our capacity to detect, anticipate and mitigate famine (Wilhite and Svoboda, 2000; Rowland et al., 2005). However, the lack of reliable and up-to-date climatological data in many regions of Africa hinders the development of effective real-time drought monitoring and early warning systems.
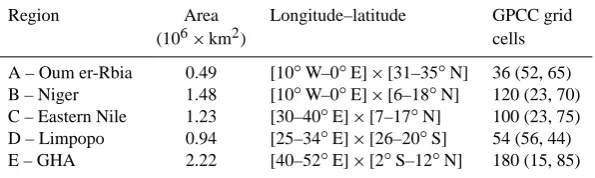
Table 1. Geographical extent of the African regions and number of grid cells analysed for each data set. For GPCC, the percentage of stations per grid and the percentage of pixels without stations are respectively shown in parentheses.
Region Area Longitude–latitude GPCC grid
(106×km2) cells
A – Oum er-Rbia 0.49 [10◦W–0◦E] × [31–35◦N] 36 (52, 65) B – Niger 1.48 [10◦W–0◦E] × [6–18◦N] 120 (23, 70) C – Eastern Nile 1.23 [30–40◦E] × [7–17◦N] 100 (23, 75) D – Limpopo 0.94 [25–34◦E] × [26–20◦S] 54 (56, 44) E – GHA 2.22 [40–52◦E] × [2◦S–12◦N] 180 (15, 85)
2008) and Hirpa et al. (2010). Those authors studied a rel-atively dense station network over the Ethiopian highlands and found that at a monthly time scale and a spatial resolu-tion of 2.5◦CMAP and TRMM 3B-43 performed very well with a bias of less than 10 % and a root mean square error of about 25 %. Thiemig et al. (2012, 2013) found that the Rainfall Estimation Algorithm and TRMM 3B-42 showed a high potential in reproducing the interannual variability, the spatial and quantitative distribution and the timing of rainfall events.
Liebmann et al. (2012) studied the spatial variations in the annual cycle comparing GPCP with TRMM and gauge-based Famine Early Warning System data sets. They found that GPCP estimates are generally higher than TRMM in the wettest parts of Africa, but the timing of the annual cycle and onset dates are consistent. Dutra et al. (2013a) found signifi-cant differences (mainly in the equatorial area) in the quality of the precipitation between the ERA-Interim, GPCP and the Climate Anomaly Monitoring System – Outgoing Longwave Radiation Precipitation Index (CAMS-OPI) data sets for dif-ferent river basins in Africa. From these studies it is evident that the question of which data set best represents African precipitation is still not sufficiently answered.
The difficulty in establishing a “ground truth” of precip-itation in Africa also affects the uncertainty in the calcula-tion of derivatives of precipitacalcula-tion, like drought indicators, since the relationship between the quality of a precipitation product and any drought indicator is nonlinear. This means that errors in the precipitation can be amplified or damp-ened when a drought index is computed. Previous works have reviewed and compared several drought indicators (Heim, 2002; Anderson et al., 2011; Shukla et al., 2011; Vicente-Serrano et al., 2012). However, an agreement between dif-ferent indicators is not necessarily observed as the capabil-ity to detect droughts changes between indicator, system and region.
The main goal of this study was to identify the main sources of uncertainty in the computation of the drought indi-cators. Furthermore, an assessment was done on the ability of the different data sets and drought indicators (SPI, SPEI and SMA) to represent the spatio-temporal features of droughts in different climate regimes across Africa.
Fig. 1. Annual mean precipitation from the GPCC data set and African regions used in this analysis as defined in Table 1. OER: Oum er-Rbia; NIG: Inner Niger Delta; ENL: Eastern Nile, LIM: Limpopo Basin and GHA: Greater Horn of Africa.
2 Data and methods
2.1 Study area
The analysis was performed at continental level over Africa with particular focus on the areas falling in four river basins (Oum er-Rbia, Limpopo, Niger, and Eastern Nile) as well as the Greater Horn of Africa (GHA). The regions were defined as the land areas inside each bounding box (see Fig. 1). The area and geographical extent of the study areas are detailed in Table 1. The regional study areas selected cover a range of climates and socio-economic systems in Africa.
2.2 Precipitation data
[image:2.595.311.543.208.437.2]G. Naumann et al.: Comparison of drought indicators derived from multiple data sets over Africa 1627
Table 2. Description of global data sets available in near-real-time that could be used for monitoring precipitation conditions at continental level.
Data sets Resolution Period Source Update
ERA 0.5◦×0.5◦ 1979– ECMWF Reanalysis 1/2 month
INTERIM present
TRMM 0.25◦×0.25◦ 1998– Remote Sensing Estimate (combination 3B-42, 1 or 2
3B-43 v.6 present CAMS and/or GPCC) months
GPCC v.5 0.5◦×0.5◦ 1901– In situ data 1 month
2010
GPCP v.2.2 2.5◦×2.5◦ 1979– Remote Sensing Estimate (merged from microwave, irregular 2010 infrared and sounder data and precipitation gauge
analyses (GPCC).
CMAP 2.5◦×2.5◦ 1979– Remote Sensing Estimate (GPI, OPI,S SM/I irregular 2009 scattering, SSM/I emission and MSU+
NCEP/NCAR Reanalysis)
bilinear interpolation to 0.5◦×0.5◦), Tropical Rainfall Mea-suring Mission (TRMM) satellite monthly rainfall prod-uct 3B-43 (0.25◦×0.25◦), the Global Precipitation Clima-tology Centre (GPCC) gridded precipitation data set V.5 (0.5◦×0.5◦), the Global Precipitation Climatology Project (GPCP) Global Monthly Merged Precipitation Analyses (2.5◦×2.5◦) and the CPC Merged Analysis of Precipitation (CMAP, 2.5◦×2.5◦) (Table 2).
This work uses the TRMM Multisatellite Precipita-tion Analysis estimaPrecipita-tion computed at monthly intervals as TRMM 3B-43 data set for the period 1998–2010 (Huffman et al., 2007). This product combines the estimates generated by the TRMM and other satellite products (3B-42) with the Cli-mate Anomaly Monitoring System gridded rain gauge data and/or the GPCC global rain gauge data at 0.25◦×0.25◦ resolution. The GPCC full reanalysis version 5 (Rudolf et al., 1994) was used for 1979 to 2010. This data set is based on quality-controlled precipitation observations from a large number of stations (up to 43 000 globally) with irregular cov-erage in time.
The ECMWF ERA-I reanalysis, the latest global atmo-spheric reanalysis produced by ECMWF, extends from 1 Jan-uary 1979 to the present date. See Dee et al. (2011) for de-tailed descriptions of the atmospheric model used in ERA-I, the data assimilation system, the observations used, and various performance aspects. The ERA-I configuration has a spectral T255 horizontal resolution (about 0.7◦×0.7◦ in the grid-point space) with 60 model vertical levels. For the present application, the monthly precipitation means were spatially interpolated (bilinear) to a regular 0.5◦×0.5◦grid. Three-hourly ERA-I precipitation estimates are produced by 12 h model integrations starting at 00:00 and 12:00 UTC. These short-range forecasts are therefore mainly constrained by the analysis of upper-air observations of temperature and humidity, from satellites and in situ instruments.
The Global Precipitation Climatology Project (GPCP, Huffman et al., 2009) combines the precipitation informa-tion available from several sources such as the Special Sensor Microwave/Imager (SSM/I) data from the US Defense Mete-orological Satellite Program satellites, infrared precipitation estimates computed primarily from geostationary satellites, low-Earth orbit estimates including the Atmospheric Infrared Sounder Television Infrared Observation Satellite Program (TIROS) Operational Vertical Sounder (TOVS), and Outgo-ing Longwave Radiation Precipitation Index data from the NOAA series satellites. The gauge data included are assem-bled and analysed by the Global Precipitation Climatology Centre (GPCC). The latest version of GPCP v2.2 that was used is available for the period January 1979 to Decem-ber 2010 in a regular 2.5◦×2.5◦grid.
The CPC Merged Analysis of Precipitation (“CMAP”) is a technique which produces pentad and monthly analy-ses of global precipitation in which observations from rain gauges are merged with precipitation estimates from sev-eral satellite-based sensors (infrared and microwave). The analyses are on a 2.5◦×2.5◦latitude/longitude grid and ex-tend back to 1979. For further information refer to Xie and Arkin (1997).
2.3 Drought indicators
the time series of all indicators were determined by consid-ering different thresholds of the standardized indicators. The duration of each dry event was determined as the number of consecutive months with negative values of the drought in-dices over the period 1998–2010. The monthly drought frac-tional area was computed for different thresholds but is only shown for the values below the−1.0 threshold.
2.3.1 Standardized Precipitation Index (SPI)
The Standardized Precipitation Index (SPI) was developed by McKee et al. (1993, 1995) to provide a spatially and tem-porally invariant measure of the precipitation deficit (or sur-plus) for any accumulation timescale (e.g. 3, 6, 12 months). It is computed by fitting a parametric Cumulative Distribution Function (CDF) to a homogenized precipitation time series and applying an equi-probability transformation to the stan-dard normal variable. This gives the SPI in units of number of standard deviations from the median.
Typically, the gamma distribution is the parametric CDF chosen to represent the precipitation time series (e.g. McKee et al., 1993, 1995; Lloyd-Hughes and Saunders, 2002; Husak et al., 2007) since it has the advantage of being bounded on the left at zero and positively skewed (Thom, 1958; Wilks, 2002). Moreover, Husak et al. (2007) and Naumann et al. (2012) have shown that the gamma distribution adequately models precipitation time series in most of the locations over Africa. In this study we use the maximum-likelihood estima-tion (MLE) method to estimate the parameters of the gamma distribution.
A persistent negative anomaly of precipitation is the pri-mary driver of drought, resulting in a successive shortage of water for different natural and human needs. Since SPI val-ues are given in units of standard deviation from the stan-dardized mean, negative values correspond to drier periods than normal and positive values correspond to wetter periods than normal. The magnitude of the departure from the me-dian is a probabilistic measure of the severity of a wet or dry event.
2.3.2 Standardized Precipitation Evapotranspiration Index (SPEI)
The Standardized Precipitation Evapotranspiration Index (SPEI, Vicente-Serrano et al., 2010) is based on precipitation and temperature data, and it has the advantage of combining different time dimensions (like the SPI) with the capacity to include the effects of temperature variability on drought. The calculation combines a climatic water balance, the accumu-lation of a water deficit/surplus at different timescales, and an adjustment to a log-logistic probability distribution. SPEI is similar to SPI, but it includes the temperature impact via the potential evapotranspiration (PET) that is calculated fol-lowing Thornthwaite (1948). In the current work, we used ERA-I 2 m temperature to derive PET, and the multiscalar
index is calculated asP−PET over the different timescales and normalized (like the SPI) using the log-logistic probabil-ity distribution.
2.3.3 Soil Moisture Anomalies (SMA)
Soil moisture anomalies were derived from ERA-I simula-tions by removing the mean annual cycle. Further standard-ization could be achieved by fitting the soil moisture distri-bution to a probability distridistri-bution (similar to SPI or, SPEI) such as the Beta distribution (Sheffield et al., 2004) or just a simplezscore (Dutra et al., 2008). In the current work we compare the SMAzscore following the considerations de-picted in Dutra et al. (2008). By normalizing the soil mois-ture with thezscore, a classification scheme is obtained that is similar and comparable to that of McKee et al. (1993) and Vicente Serrano et al. (2012).
2.4 Evaluation metrics
The precipitation data sets and drought indicators were as-sessed using different scores available in the hydroGOF R package (Zambrano-Bigarini, 2013): Spearman’s correlation coefficient (r), mean absolute difference (MAD), percent bias (PBIAS) between two products and the index of agree-ment (d). Details of the evaluation scores are listed in the Appendix.
A direct quantitative assessment at continental level is dif-ficult due to the lack of an actual validation data set that represents the ground truth with adequately high spatial or temporal resolution. The performance metrics (mean abso-lute difference, relative bias and index of agreement) were used to diagnose the relative reliability of each indicator over different drought properties. This analysis does not assume that a single data set or indicator is better than the other but highlights their temporal and spatial coherency.
3 Results and discussion
3.1 Comparison of global precipitation data sets
G. Naumann et al.: Comparison of drought indicators derived from multiple data sets over Africa 1629
Fig. 2. (A)–(E) Mean annual precipitation (mm year−1) from different data sets for the common period 1998–2010, (F) longitudinal cross-section at 25◦E of mean annual precipitation.
the areas of maximum precipitation over the African rain-forests related to the location of the Intertropical Conver-gence Zone (ITCZ), as well as in the drier climate of the southwestern part of Africa. The main differences are ob-served in the tropical area and over un-gauged areas. In tran-sition regions from the Sahel to the Sahara TRMM estima-tions can exceed GPCC more than twofold while TRMM is substantially lower than the other estimations along the southwestern coast of West Africa (Liebmann et al., 2012). There is also a tendency of higher precipitation in the trop-ical rainforest in GPCP (Liebmann et al., 2012) and ERA-I (Dutra et al., 2013a, b) compared with the other data sets.
ERA-I overestimates the rainfall in the central African re-gion which is likely to be associated with a substantial warm bias in the model due to an underestimation of aerosol optical depth in the region (Dee et al., 2011).
[image:5.595.158.435.60.517.2]Fig. 3. Mean annual cycle of precipitation from the different data sets averaged over the five regions defined in Fig. 1 (OER: Oum er-Rbia, NIG: Inner Niger Delta, NIL: Eastern Nile, LIM: Limpopo Basin and GHA: Greater Horn of Africa) for the common period 1998–2010.
are higher with an overestimation of ERA-I in the Eastern Nile Basin and GHA and an underestimation in the Niger Basin.
Apparently the density of rain gauges plays a role in de-termining the agreement between data sets. The best gauged regions (Oum er-Rbia and Limpopo; Table 1) are those with the lowest dispersion in terms of annual cycle. These two re-gions (Oum er-Rbia and Limpopo) are located outside the tropical region, and their precipitation variability is mainly controlled by large-scale synoptic weather systems, while in the tropical region small-scale convective events play an im-portant role. In these regions, model uncertainties (for ex-ample land–atmosphere coupling), uncertainties in satellite retrievals as well as poor gauge cover contribute to the large spread in the mean annual cycles computed with the different data sets.
The monthly data sets show a reasonable agreement over all regions in terms of the correlation coefficients which are usually greater than 0.8 (Table 3). The CMAP data set de-viates with values below 0.7 in some regions. Oum er-Rbia
and Limpopo areas show the best agreement between data sets with MAE values below 10 mm month−1. The bias in those two regions is below 20 % in all the cases except when TRMM and CMAP are compared (30 %).
The biggest differences were observed for ERA-I in the Blue Nile and GHA regions. In these regions the overestima-tion of monthly precipitaoverestima-tion reached 40 mm month−1 and the bias can reach 90 % in the Blue Nile and around 50 % in the GHA. These discrepancies are mainly due to the prob-lems of representation of the mean annual cycle of precipita-tion by atmospherics models and the lack of in situ observa-tions (Mariotti et al., 2011; Dutra et al., 2013b).
3.2 Comparison of drought indicators
G. Naumann et al.: Comparison of drought indicators derived from multiple data sets over Africa 1631
Fig. 5. Index of agreement (d) between SPI, SPEI and SMA computed using ERA-I for the five case studies and the whole continent. OER: Oum er-Rbia, NIG: Inner Niger Delta, NIL: Eastern Nile, LIM: Limpopo Basin and GHA: Greater Horn of Africa. Dashed lines extend from 5th to 95th percentile of estimations, boxes extend from 25th to 75th percentile and middle horizontal lines within each box indicate the mean for each region.
(Fig. 4). Although there is in general a good spatial corre-spondence between all the indicators over the study period, there are also areas where there is no agreement between some indicators, such as in central Africa between SPI and SPEI.
Figure 5 shows the index of agreement (d) between all the drought indicators computed with ERA-I. Overall, the index of agreement shows that there is a good correspondence be-tween indicators in all regions with meand values greater than 0.5 for almost all the comparisons. Moreover, the effect of PET on the computations of the SPEI is not major since the agreement of this indicator with the others is still high.
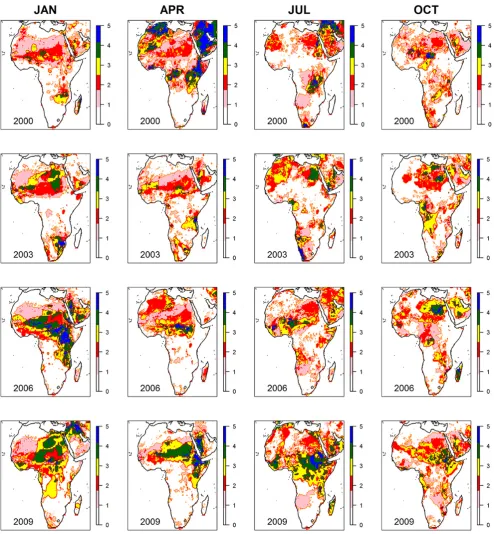
Figure 6 shows the evolution of drought areas in 2000, 2003, 2006 and 2009 characterized by the number of indi-cators below a certain threshold. In almost all areas there is a good agreement, with usually more than three indicators re-porting drought conditions per grid cell. However, there are some areas with only one indicator below the defined thresh-old, mostly over central Africa. There is scope to take ad-vantage of these discrepancies and agreements and propose the construction of a composite indicator (Svoboda et al., 2002; Sepulcre-Canto et al., 2012; Hao and AghaKouchak, 2013). The development of a single composite drought indi-cator could improve the detection of the onset of a drought
and help to monitor its evolution more efficiently, at the same time providing information on the uncertainty in the data. This will allow decision makers and stakeholders to better handle uncertainties in early warning systems.
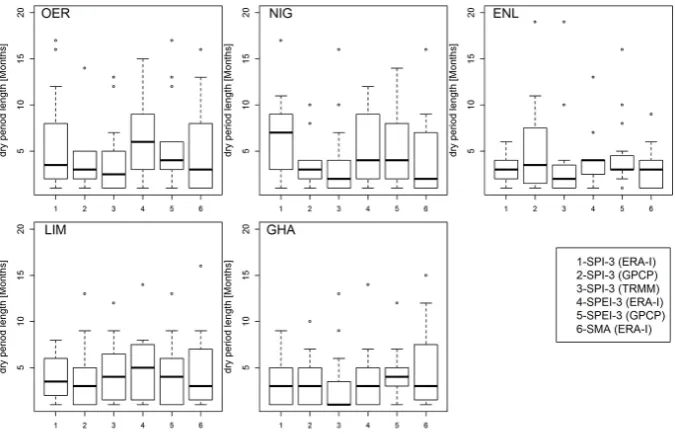
The individual drought episodes were computed from the time series of all indicators considering as dry periods all values of standardized indicators below zero. The duration of each dry event was determined as the number of consec-utive months with negative values for the period 1998–2010. The average duration of dry episodes lasted between 2 to 6 months for all indicators, with the largest differences in du-ration for different indicators being found in the Niger Basin and in the GHA (Fig. 7). Overall, dry periods measured with SPEI tend to be 1 or 2 months more persistent if compared with the other estimations.
G. Naumann et al.: Comparison of drought indicators derived from multiple data sets over Africa 1633
Fig. 6. Month by month evolution of droughts in 2000, 2003, 2006 and 2009 according to grid cells with SPI-3/SPEI-3 computed using ERA-I GPCP, and TRMM below−1.0. Values are ranged between 0 (no data set with SPI-3/SPEI-3 below the threshold) and 5 (all data sets below threshold).
of more than 50 % between SPI and SPEI estimations during the 2009/2010 and 2005/2006 periods, respectively. The soil moisture anomalies tend to define less generalized droughts as it is hard to reach half the region under dry conditions. However, even if the magnitude of the area is smaller with
respect to the other indicators, the soil moisture shows a good correspondence except for the period 2000/2002 in the Inner Niger Delta.
Table 3. Correlation coefficient (r), mean absolute difference (MAD) and percentage bias (%) between the different precipitation data sets averaged over each region for the common period 1998–2010. All correlations are significant at 99 %.
TRMM GPCC GPCP CMAP ERA-I
r MAD BIAS r MAD BIAS r MAD BIAS r MAD BIAS r MAD BIAS
OER TRMM – – – 0.99 2.5 2.7 0.99 2.9 6.7 0.74 7.8 42.8 0.95 7.3 26.3 GPCC 0.99 2.5 −2.6 – – – 0.99 2.5 4.2 0.94 4.7 23.1 0.95 6.7 24.4 GPCP 0.99 2.9 −6.2 0.99 2.5 −4 – – – 0.73 6.5 33.9 0.95 5.7 18.4 CMAP 0.74 7.8 −30 0.94 4.6 −18.7 0.73 6.5 −25.3 – – – 0.68 7.0 −11.6 ERA-I 0.95 7.3 −20.8 0.95 6.6 −19.6 0.95 5.7 −15.5 0.68 7.0 13.1 – – –
NIG TRMM – – – 0.99 5.8 −1.9 0.98 13.6 −14.5 0.8 13.9 7.2 0.94 23.2 8 GPCC 0.99 5.8 1.9 – – – 0.99 11.6 −14.1 0.97 6.9 −1 0.95 22.2 8.3 GPCP 0.98 13.6 17 0.99 11.5 16.4 – – – 0.82 16.7 25.4 0.95 25.8 26.4 CMAP 0.8 13.8 −6.7 0.97 6.9 1 0.82 16.8 −20.3 – – – 0.78 25.8 0.7 ERA-I 0.94 23.1 −7.4 0.95 22.2 −7.7 0.95 25.8 −20.9 0.78 25.8 −0.7 – – –
ENL TRMM – – – 0.94 17.6 −23.7 0.93 17.4 −22.4 0.82 15.3 −0.6 0.93 43.9 −48.1 GPCC 0.94 17.6 31 – – – 1 2.7 1.9 0.97 12.1 22.5 0.97 29.9 −32.3 GPCP 0.93 17.4 28.9 1 2.66 −1.9 – – – 0.85 14.3 28.2 0.97 30.1 −33.1 CMAP 0.82 15.3 0.6 0.97 12.1 −18.4 0.85 14.3 −22 – – – 0.86 43.4 −47.8 ERA-I 0.93 43.9 92.8 0.97 29.9 47.6 0.97 30.1 49.5 0.86 43.4 91.7 – – –
LIM TRMM – – – 0.98 7.03 8.9 0.97 8.4 6.7 0.76 12.6 20.6 0.96 10.4 9 GPCC 0.98 7.0 −8.2 – – – 0.99 5.1 −3.3 0.91 8.3 1.8 0.98 8.1 −1.5 GPCP 0.97 8.4 −6.3 0.99 5.1 3.4 – – – 0.79 9.9 13 0.97 8.8 2.1 CMAP 0.76 12.6 −17 0.91 8.3 −1.8 0.79 9.9 −11.5 – – – 0.79 12.8 −9.6 ERA-I 0.96 10.4 −8.2 0.98 8.1 1.5 0.97 8.8 −2.1 0.79 12.8 10.6 – – –
GHA TRMM – – – 0.82 9.8 −4.2 0.88 6.6 1.7 0.72 9.2 11.2 0.84 17.8 −34 GPCC 0.82 9.8 4.4 – – – 0.9 8.2 7.1 0.84 9.4 8.4 0.83 17.1 −30.9 GPCP 0.88 6.6 −1.7 0.9 8.2 −6.6 – – – 0.7 9.6 9.3 0.92 16.4 −35.1 CMAP 0.72 9.2 −10.1 0.84 9.4 −7.8 0.7 9.6 −8.5 – – – 0.61 22.7 −40.6 ERA-I 0.84 17.8 51.5 0.83 17.1 44.7 0.92 16.4 54.1 0.61 22.7 68.4 – – –
[image:10.595.129.467.422.639.2]G. Naumann et al.: Comparison of drought indicators derived from multiple data sets over Africa 1635
Fig. 8. Fractional area of each region under SPI, SPEI and SMA below−1.0 for the period 1998–2010. OER: Oum er-Rbia, NIG: Inner Niger Delta, NIL: Eastern Nile, LIM: Limpopo Basin and GHA: Greater Horn of Africa.
performed between different thresholds of SPI and the ar-eas affected by droughts in each region. Here the results of the different SPI estimations are presented (Table 4). How-ever, similar results were found for the other indicators (not shown). For almost all regions (except for Oum er-Rbia where this relationship is almost constant) the correlation be-tween the different SPIs is higher for thresholds closer to zero (Fig. 9). To consider a higher threshold (i.e. less negative) to define areas affected by drought (e.g.−0.8 or−1), therefore, will reduce the disagreement between indicators. However, it puts a limit on the detection of the significance and severity of a drought. These results highlight that the main differences between the indicators appear in the extreme events.
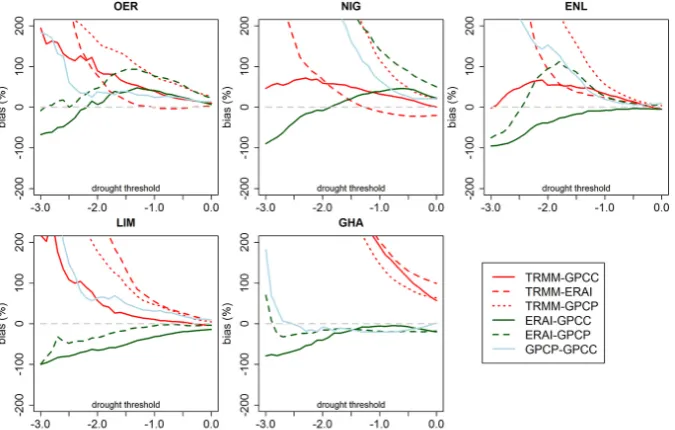
Also, the bias between estimations indicates an acceptable departure between estimations from normal conditions un-til values near−0.5 (Fig. 10). Below this threshold the bias increases exponentially, surpassing quickly a bias of 100 % around SPI values of−1. For Niger and GHA regions there is only a reasonable agreement between ERA-I and GPCC estimations.
Generally in the Oum er-Rbia and Limpopo basins, both extra-tropical regions, the agreement is high, possibly due to the greater number of in situ observations and the importance of large-scale synoptic weather systems in these areas.
For the basins located between the tropics a greater dis-agreement is observed due to different factors. The main common factor is the remarkable absence of observations to calibrate and test the data sets. These deficiencies are also more evident in complex mountainous areas such as the East-ern Nile Basin. Furthermore, droughts in equatorial regions are mainly driven by the absence of convective events during the rainy season. These mesoscale dimension events are hard to be reproduced by models and even difficult to monitor in areas with scarce in situ rain gauges.
Fig. 9. Correlation coefficient of fractional areas under drought between different data sets and thresholds. The horizontal axis represents the SPI threshold below which areas are considered to be under drought.
Fig. 10. Relative bias between the estimation of fractional areas under drought for different data sets and thresholds. The horizontal axis represents the SPI threshold below which areas are considered to be under drought.
confidence of the SPI values. In these cases, the SPI may never attain the necessary threshold, hence failing to de-tect some drought occurrences (e.g. SPI always above−1 in Niger and GHA). The discrepancies between indicators for lower thresholds over regions with limited rain gauge data is characterized by the uncertainties of extreme values. This suggests that the main sources of error are the uncertainties in the precipitation data sets that are propagated in the estima-tion of the distribuestima-tion parameters of the drought indicators.
[image:12.595.131.469.329.544.2]G. Naumann et al.: Comparison of drought indicators derived from multiple data sets over Africa 1637
Table 4. Spearman correlation coefficient (r) and mean absolute difference (MAD) between the different SPI-3 estimations averaged over each region for the common period 1998–2010.
TRMM GPCC GPCP ERA-I
r MAD r MAD r MAD r MAD
Oum er-Rbia TRMM – – 0.89 0.28 0.81 0.38 0.84 0.37
GPCC 0.89 0.28 – – 0.81 0.35 0.81 0.34
GPCP 0.81 0.38 0.81 0.35 – – 0.74 0.5
ERA-I 0.84 0.37 0.81 0.34 0.74 0.5 – –
Niger TRMM – – 0.85 0.26 0.79 0.38 0.71 0.5
GPCC 0.85 0.26 – – 0.91 0.29 0.72 0.46
GPCP 0.79 0.38 0.91 0.29 – – 0.67 0.65
ERA-I 0.71 0.5 0.72 0.46 0.67 0.65 – –
Blue Nile TRMM – – 0.54 0.54 0.53 0.55 0.6 0.5
GPCC 0.54 0.54 – – 0.92 0.27 0.57 0.41
GPCP 0.53 0.55 0.92 0.27 – – 0.67 0.46
ERA-I 0.6 0.5 0.57 0.41 0.67 0.46 – –
Limpopo TRMM – – 0.91 0.28 0.84 0.39 0.8 0.46
GPCC 0.91 0.28 – – 0.92 0.27 0.91 0.33
GPCP 0.84 0.39 0.92 0.27 – – 0.88 0.35
ERA-I 0.8 0.46 0.91 0.33 0.88 0.35 – –
GHA TRMM – – 0.58 0.4 0.65 0.44 0.61 0.44
GPCC 0.58 0.4 – – 0.86 0.29 0.58 0.42
GPCP 0.65 0.44 0.86 0.29 – – 0.68 0.45
ERA-I 0.61 0.44 0.58 0.42 0.68 0.45 – –
Our results further underline the value of maintaining an operational monitoring network at country, continental or even global level since indirect observations have their intrin-sic uncertainties linked to the availability and reliability of “ground truth” for their calibration. Without proper calibra-tion, model (ERA-I) or algorithm (TRMM) inherent errors can propagate resulting in large drought indicator uncertain-ties, bringing no added value with respect to using standard climatology.
The development of a combined indicator based on a prob-abilistic approach (e.g. Dutra et al., 2014) could be useful as a monitoring product at continental level. However, at local scale the kind of indicator and the source of data must be chosen carefully, taking into account their limitations.
4 Conclusions
This study evaluated the capabilities of different drought in-dicators, including SPI, SPEI and SMA, in detecting the tim-ing and extension of drought across Africa, ustim-ing five dif-ferent precipitation data sets (TRMM, ERA-Interim, GPCC, GPCP and CMAP). The analysis was performed on a pan-African scale and on a regional scale focused on four river basins and on the Greater Horn of Africa.
A comparison of the annual cycle and monthly precipita-tion time series shows a good agreement in the timing of the
peaks, including the Greater Horn of Africa where there are two rainy seasons. The main differences are observed in the ability to represent the magnitude of the wet seasons.
The monthly mean precipitation data sets shows good agreement over all regions with the only exception of the CMAP data set that shows a lower agreement. In the Oum er-Rbia and Limpopo basins there is a good agreement be-tween the data sets with mean absolute differences below 10 mm month−1. The bias in those two regions is below 20 %. The worst performance of ERA-I was observed in the Blue Nile Basin, overestimating the monthly precipitation up to 40 mm month−1with a bias of up to 92 % with respect to the other data sets. Also in the GHA region the bias is around 50 % with an overestimation of up to 17 mm month−1.
The comparative analysis between TRMM, ERA-I, GPCP and GPCC data sets suggests that it is feasible to use TRMM time series with high spatial resolution for reliable drought monitoring over parts of Africa. It is possible to take ad-vantage of this data set mainly at regional level due to its high spatial resolution. However, higher discrepancies in SPI estimations are shown in mountainous areas and areas with a sparse in situ station density. On the other hand, drought monitoring at continental level with ERA-I performs better outside the areas influenced by the ITCZ.
sets (driven by a lack of ground information, uncertainties in the estimation algorithms or the parameterization of the convection) rather than to the estimation of the distribution parameters. This is why the SPI estimations for the Oum er-Rbia and Limpopo regions exhibit a better agreement be-tween estimations. While for the other regions the discrepan-cies between data sets are in many cases acceptable, greater discrepancies are observed for the Inner Niger Delta when comparing ERA-I estimations with the other data sets.
Regarding the areas that are under drought, all the indica-tors agree with the time of onset and recovery but there are sometimes disagreements with respect to the area affected, and the level of disagreement tends to be dependent on the threshold selected.
It is proposed to integrate different indicators and accumu-lation periods in the form of a multivariate combined indica-tor in order to take advantage of their different drought prop-erties. The probabilistic nature of such an approach would be very helpful for decision makers and for the combined anal-ysis of multiple risks (Dutra et al., 2014).
Acknowledgements. This work was funded by the European Commission Seventh Framework Programme (EU FP7) in the framework of the Improved Drought Early Warning and Fore-casting to Strengthen Preparedness and Adaptation to Droughts in Africa (DEWFORA) project under Grant Agreement 265454. Gustavo Naumann thanks Mauricio Zambrano-Bigarini for the important discussions about different metrics to compare indicators and for making available the hydroGOF R package.
Edited by: S. Maskey
References
Anderson, M. C., Hain, C., Wardlow, B., Pimstein, A., Mecikalski, J. R., and Kustas, W. P.: Evaluation of drought indices based on thermal remote sensing of evapotranspiration over the continen-tal United States, J. Climate, 24, 2025–2044, 2011.
Dee, D. P., Uppala, S. M., Simmons, A. J., Berrisford, P., Poli, P., Kobayashi, S., Andrae, U., Balmaseda, M. A., Balsamo, G., Bauer, P., Bechtold, P., Beljaars, A. C. M., van de Berg, L., Bid-lot, J., Bormann, N., Delsol, C., Dragani, R., Fuentes, M., Geer, A. J., Haimberger, L., Healy, S. B., Hersbach, H., Hólm, E. V., Isaksen, L., Kållberg, P., Köhler, M., Matricardi, M., McNally, A. P., Monge-Sanz, B. M., Morcrette, J.-J., Park, B.-K., Peubey, C., de Rosnay, P., Tavolato, C., Thépaut, J.-N., and Vitart, F.: The ERA-Interim reanalysis: configuration and performance of the data assimilation system, Q. J. Roy. Meteorol. Soc., 137, 553– 597, doi:10.1002/qj.828, 2011.
Dinku, T., Ceccato, P., Grover-Kopec, E., Lemma, M., Connor, S. J., and Ropelewski, C. F.: Validation of satellite rainfall products over East Africa’s complex topography, Int. J. Remote Sens., 28, 1503–1526, 2007.
Dinku, T., Chidzambwa, S., Ceccato, P., Connor, S. J., and Ro-pelewski, C. F.: Validation of high-resolution satellite rainfall products over complex terrain, Int. J. Remote Sens., 29, 4097– 4110, 2008.
Dutra, E., Viterbo, P., and Miranda, P. M. A.: ERA-40 reanalysis hydrological applications in the characterization of regional drought, Geophys. Res. Lett., 35, L19402, doi:10.1029/2008GL035381, 2008.
Dutra, E., Di Giuseppe, F., Wetterhall, F., and Pappenberger, F.: Seasonal forecasts of droughts in African basins using the Stan-dardized Precipitation Index, Hydrol. Earth Syst. Sci., 17, 2359– 2373, doi:10.5194/hess-17-2359-2013, 2013a.
Dutra, E., Magnusson, L., Wetterhall, F., Cloke, H. L., Balsamo, G., Boussetta, S., and Pappenberger, F.: The 2010–2011 drought in the Horn of Africa in ECMWF reanalysis and seasonal forecast products, Int. J. Climatol., 33, 1720–1729, 2013b.
Dutra, E., Wetterhall, F., Di Giuseppe, F., Naumann, G., Barbosa, P., Vogt, J., Pozzi, W., and Pappenberger, F.: Global meteo-rological drought – Part 1: Probabilistic monitoring, Hydrol. Earth Syst. Sci. Discuss., 11, 889–917, doi:10.5194/hessd-11-889-2014, 2014.
Hao, Z. and AghaKouchak, A.: Multivariate Standardized Drought Index: A parametric multi-index model, Adv. Water Resour., 57, 12–18, 2013.
Heim Jr., R. R.: A review of twentieth-century drought indices used in the United States, B. Am. Meteorol. Soc., 83, 1149–1165, 2002.
Hirpa, F. A., Gebremichael, M., and Hopson, T.: Evaluation of high-resolution satellite precipitation products over very complex ter-rain in Ethiopia, J. Appl. Meteorol. Clim., 49, 1044–1051, 2010. Huffman, G. J., Adler, R. F., Bolvin, D. T., Gu, G., Nelkin, E. J., Bowman, K. P., Hong, Y., Stocker, E. F., and Wolff, D. B.: The TRMM Multi-satellite Precipitation Analysis (TMPA): Quasi-global, multiyear, combined sensor precipitation estimates at fine scales, J. Hydrometeorol., 8, 38–55, 2007.
Huffman, G. J., Adler, R. F., Bolvin, D. T., and Gu, G.: Improving the Global Precipitation Record: GPCP Version 2.1, Geophys. Res. Lett., 36, L17808, doi:10.1029/2009GL040000, 2009. Husak, G. J., Michaelsen, J., and Funk, C.: Use of the gamma
dis-tribution to represent monthly rainfall in Africa for drought mon-itoring applications, Int. J. Climatol., 27, 935–944, 2007. Legates, D. R. and McCabe Jr., G. J.: Evaluating the Use of
“Goodness-of-Fit” Measures in Hydrologic and Hydroclimatic Model Validation, Water Resour. Res., 35, 233–241, 1999. Liebmann, B., Bladé, I., Kiladis, G. N., Carvalho, L. M., Senay, G.,
Allured, D., Leroux, S., and Funk, C.: Seasonality of African pre-cipitation from 1996 to 2009, J. Climate, 25, 4304–4322, 2012. Lloyd-Hughes, B. and Saunders, M. A.: A drought climatology for
Europe, Int. J. Climatol., 22, 1571–1592, 2002.
Mariotti, L., Coppola, E., Sylla, M. B., Giorgi, F., and Piani, C.: Regional climate model simulation of projected 21st century cli-mate change over an all-Africa domain: Comparison analysis of nested and driving model results, J. Geophys. Res., 116, D15111, doi:10.1029/2010JD015068, 2011.
G. Naumann et al.: Comparison of drought indicators derived from multiple data sets over Africa 1639
McKee, T. B., Doesken, N. J., and Kleist, J.: Drought monitoring with multiple time scales, Proc. Ninth Conf. on Applied Clima-tology, Amer. Meteor. Soc., Dallas, TX, 233–236, 1995. Naumann, G., Barbosa, P., Carrao, H., Singleton, A., and Vogt, J.:
Monitoring drought conditions and their uncertainties in Africa using TRMM data, J. Appl. Meteorol. Clim., 51, 1867–1874, doi:10.1175/jamc-d-12-0113.1, 2012.
Rojas, O., Vrieling, A., and Rembold, F.: Assessing drought proba-bility for agricultural areas in Africa with coarse resolution re-mote sensing imagery, Rere-mote Sens. Environ., 115, 343–352, doi:10.1016/j.rse.2010.09.006, 2011.
Rowland, J., Verdin, J., Adoum, A., and Senay, G.: Drought mon-itoring techniques for famine early warning systems in Africa, in: Monitoring and Predicting Agricultural Drought: A Global Study, edited by: Boken, V. K., Cracknell, A. P., and Heathcote, R. L., Oxford University Press, New York, 252–265, 2005. Rudolf, B., Hauschild, H., Rueth, W., and Schneider, U.: Terrestrial
precipitation analysis: Operational method and required density of point measurements, in: Global Precipitations and Climate Change, edited by: Desbois, M. and Desahmond, F., Springer Verlag, Berlin, 173–186, 1994.
Sepulcre-Canto, G., Horion, S., Singleton, A., Carrao, H., and Vogt, J.: Development of a Combined Drought Indicator to detect agri-cultural drought in Europe, Nat. Hazards Earth Syst. Sci., 12, 3519–3531, doi:10.5194/nhess-12-3519-2012, 2012.
Sheffield, J., Goteti, G., Wen, F. H., and Wood, E. F.: A simulated soil moisture based drought analysis for the United States, J. Geophys. Res., 109, D24108, doi:10.1029/2004JD005182, 2004. Shukla, S., Steinemann, A. C., and Lettenmaier, D. P.: Drought monitoring for Washington State: Indicators and applications, J. Hydrometeorol., 12, 66–83, 2011.
Svoboda, M., LeComte, D., Hayes, M., Heim, R., Gleason, K., Angel, J., Rippey, B., Tinker, R., Palecki, M., Stooksbury, D., Miskus, D., and Stephens, S.: The Drought Monitor, B. Am. Me-teorol. Soc., 83, 1181–1190, 2002.
Thiemig, V., Rojas, R., Zambrano-Bigiarini, M., Levizzani, V., and De Roo, A.: Validation of Satellite-Based Precipitation Products over Sparsely Gauged African River Basins, J. Hydrometeorol., 13, 1760–1783, 2012.
Thiemig, V., Rojas, R., Zambrano-Bigiarini, M., and De Roo, A.: Hydrological Evaluation of Satellite-Based Rainfall Estimates over the Volta and Baro-Akobo Basin, J. Hydrol., 499, 324–338, 2013.
Thom, H. C.: A note on the gamma distribution, Mon. Weather Rev., 86, 117–122, 1958.
Thornthwaite, C. W.: An approach toward a rational classification of climate, Geogr. Rev., 38, 55–94, 1948.
Vicente-Serrano, S. M., Beguería, S., and López-Moreno, J. I.: A multiscalar drought index sensitive to global warming: the stan-dardized precipitation evapotranspiration index, J. Climate, 23, 1696–1718, 2010.
Vicente-Serrano, S. M., Beguería, S., Gimeno, L., Eklundh, L., Giu-liani, G., Weston, D., El Kenawy, A., López-Moreno, J., Nieto, R., Ayenew T., Konte, D., Ardö, J., and Pegram, G. G.: Chal-lenges for drought mitigation in Africa: The potential use of geospatial data and drought information systems, Appl. Geogr., 34, 471–486, 2012.
Wilhite, D. A. and Svoboda, M. D.: Drought early warning systems in the context of drought preparedness and mitigation, in: Early Warning Systems for Drought Preparedness and Drought Man-agement, edited by: Wilhite, D. A., Sivakumar, M. V. K., and Wood, D. A., WMO/TD no. 1037, World Meteorological Orga-nization, Geneva, 1–21, 2000.
Wilks, D.: Statistical methods in the atmospheric sciences, Elsevier Academic Press, Burlington, MA, USA, 467 pp., 2002. Willmott, C. J.: On the validation of models, Phys. Geogr., 2, 184–
194, 1981.
Wu, H., Svoboda, M. D., Hayes, M. J., Wilhite, D. A., and Wen, F.: Appropriate application of the standardized precipitation index in arid locations and dry seasons, Int. J. Climatol., 27, 65–79, 2007.
Xie, P. and Arkin, P. A.: Global precipitation: A 17-year monthly analysis based on gauge observations, satellite estimates, and nu-merical model outputs, B. Am. Meteorol. Soc., 78, 2539–2558, 1997.
Appendix A
Description of evaluation metrics
The Spearman correlation represents the Pearson correlation coefficient computed using the ranks of the data. Concep-tually, the Pearson correlation coefficient is applied to the ranks of the data rather than to the data values themselves. The Spearman coefficient is a more robust and resistant alter-native to the Pearson product-moment correlation coefficient (Wilks, 2002). Computation of the Spearman rank correla-tion can be described as
r =1− 6 P
Ri2
n n2−1, (A1)
whereRi is the difference in ranks between theith pair of data values. In cases of ties, where a particular data value appears more than once, all of these equal values are assigned their average rank before computing theRi.
The MAD measures the average magnitude of the differ-ences in a set of different estimations of a certain indicator. It measures accuracy for continuous variables without consid-ering the direction of the error. Also, this quantity is usually used to measure how close are two data sets or indicators as in
MAD= 1
n
n X
i=1
|X1i −X2i|, (A2)
whereX1 and Xare the values of precipitation or drought indicator of data set 1 andnrepresents the number of pairs The percent bias (PBIAS) measures the average tendency of the values of a certain data set to be larger or smaller than a reference one:
PBIAS=100 n P
i=1
|X1i−−X2i| n
P
i=1
X1i
. (A3)
The optimal value of PBIAS is 0, with low-magnitude values indicating accurate representation of drought indicators. Pos-itive values indicate an overestimation bias, whereas negative values indicate an underestimation bias. It must be taken into account that this metric depends on which data set is consid-ered to represent the observations.
The Index of Agreement (d) developed by Willmott (1981) as a standardized measure of the degree of model prediction error varies between 0 and 1. A value of 1 indicates a perfect match, and 0 indicates no agreement at all (Willmott, 1981). The index of agreement can detect additive and proportional differences in the observed and simulated means and vari-ances; however, it is overly sensitive to extreme values due to the squared differences (Legates and McCabe Jr., 1999):
d =1−
P
(X1−X2)2
P