Fingerprinting of bed sediment in the Tay Estuary, Scotland:
an environmental magnetism approach
Pierre A. Jenkins
1, Rob W. Duck
1, John S. Rowan
1and John Walden
21Department of Geography, University of Dundee, Dundee, DD14HN, Scotland
2School of Geography and Geosciences, Irvine Building, University of St. Andrews, St. Andrews, Fife, KY16 9AL, Scotland
Email of corresponding author: p.a.jenkins@dundee.ac.uk
Abstract
Sediment fingerprinting is commonly used for sediment provenance studies in lakes, rivers and reservoirs and on hillslopes and floodplains. This investigation explores the mixing of terrestrial and marine-derived sediment in the Tay Estuary, Scotland, using mineral magnetic attributes for fingerprinting. Samples representative of the estuary sediments and of four sources (end-members) were subjected to a suite of magnetic susceptibility and remanence measurements. Sediment samples from the beds of the Rivers Tay and Earn represented fluvial inputs while samples from the Angus and Fife coasts represented marine input. Multivariate discriminant and factor analysis showed that the sources could be separated on the basis of six magnetic parameters in a simple multivariate unmixing model to identify source contributions to estuarine bed sediments. Multi-domain magnetite signatures, characteristic of unweathered bedrock, dominate the magnetic measurements. Overall contributions of 3% from the River Earn, 17% from the River Tay, 29% from the Angus coast and 51% from the Fife coast source end-members, demonstrated the present-day regime of marine sediment derivation in the Tay Estuary. However, this conceals considerable spatial variability both along-estuary and in terms of sub-environments, with small-scale variations in sediment provenance reflecting local morphology, particularly areas of channel convergence.
Keywords: bed sediment, environmental magnetism, fingerprinting, Tay Estuary, Scotland
Introduction
Predicting the nature, magnitude and time-scale of geomorphological change in an estuarine environment requires an understanding of sediment sources and sinks and of the exchanges that occur, particularly in estuaries with a high level of human activity and intervention in natural processes. Relevant management concerns include navigation and associated dredging, flood risk assessment and pollution dispersal.
Sediment ‘fingerprinting’ is an increasingly popular approach for sediment tracing, using a wide variety of sediment properties including geochemistry, mineral magnetics, radionuclides and biogenic properties (Foster and Lees, 2000), although few previous attempts have been made in estuarine environments (Yu and Oldfield, 1989; Duck et al., 2001). Composite fingerprints have been used with a multivariate mixing model to quantify the relative contributions from different source types and, hence, elucidate system dynamics (Walling and Woodward, 1995).
Previous studies in the Tay Estuary have used natural tracers such as heavy minerals (Mishra, 1969) and shell fragments (Al-Dabbas and McManus, 1987). The present investigation aims to improve the understanding of the estuary as a zone of mixing of terrestrially and marine derived sediment using the mineral magnetic characteristics of bed sediments to discern source-sediment linkages. The mineral magnetic properties of sediments reflect the types and concentrations of naturally occurring Fe-bearing minerals they contain and provide a recognised method for sediment fingerprinting and reconstructing source-sediment linkages (Oldfield et al., 1979). Particular attention is given to the relative contributions from sediment sources to the estuary and the spatial variability in provenance among the present day bed sediments.
Study Area
1008
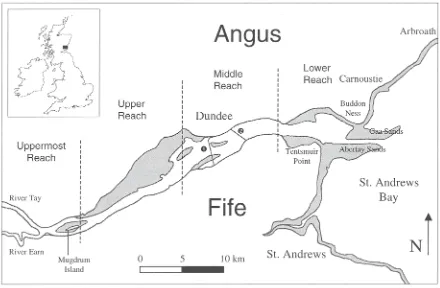
partially-mixed, macrotidal body of water; its tidal reach extends 50 km inland (Fig. 1), the maximum depth is 30 m and tidal ranges for neap, spring and equinoctial tides are 3.5 m, 5 m and 6 m respectively.
Two rivers, the Tay and the Earn, deliver a long-term mean daily flow of 198 m3s–1 into the uppermost reach of the
estuary from a 6500 km2 catchment area. Of this, the River
Tay discharges 167 m3s–1 (84%), the largest flow of any
river in Britain, while the River Earn discharges 31 m3s–1
(16%) (Charlton et al., 1975; McManus, 1986a). The upper regions of the drainage areas of both rivers lie north of the Highland Boundary Fault and are underlain by mixed assemblages of Moine and Dalradian (Precambrian) metamorphic rocks. South of the fault, the catchment rests on suites of conglomerates, sandstones, lavas and tuffs of the Lower Devonian. Drift deposits consisting of Pleistocene tills and fluvioglacial sands and gravel are widespread.
Buller et al. (1971) described the Tay Estuary in terms of four reaches (Fig. 1), of which the uppermost was channelised for navigation in the mid-19th century. The artificially-deepened channel along the southern shore cuts into partly consolidated late-glacial laminated clays while, along the northern shore, there is a largely natural and partially silted channel. In the upper reach of the estuary, the entire northern shoreline west of Dundee is flanked by
largely stable intertidal flats of subdued relief, backed by marshes dominated by the reed Phragmites communis. The sediments of these flats coarsen from the shore towards the channels, with the 5% dry weight contour of silt plus clay dividing the flats into two, almost equal, upper and lower zones (Buller, 1975). Tidal currents and wave activity mould the sediments into small dune and ripple bedforms. The main channel in this sector follows the southern shoreline closely and is floored by gravels and coarse sands. The middle reach of the estuary is unstable, with migrating channels separated by large sandbanks. Channel sediments consist of mobile sands which form small to large dunes under the influence of tidal currents surpassing 1 m s–1. In the lower reach, tidal
flats backed by beaches and dune ridges reappear along both the north and south shores. Silty and fine sands are interrupted occasionally by exposures of natural tills or artificially introduced pebbles (McManus, 1999). The channel, the bed of which is lined with locally exposed gravels, joins the North Sea between two sand spit complexes, namely the Abertay Sands (south) and the Gaa Sands (north).
At the estuary mouth, the beaches along the northern shore culminate in the sandy headland of Buddon Ness. The beaches of the Angus coast between Buddon and Carnoustie, facing St. Andrews Bay, have been subjected to coastal
[image:2.595.70.510.415.703.2]erosion, severe on occasion; this has led to the installation of protection works (McManus, 1984). On the opposite shore, Tentsmuir Point consists of lines of coastal dune ridges separated by low-lying intervening slacks. Driven by wave and wind activity, the Point has advanced in a north-easterly direction at a rate of 15 m yr–1 since 1941 (McManus
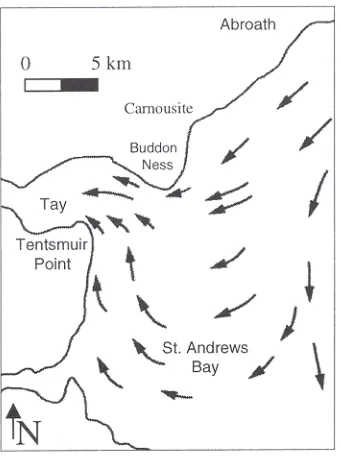
and Wal, 1996). In St. Andrews Bay, net longshore sand transport induced by wave action and implemented by the tidal circulation pattern operates as two cellular systems (Ferentinos and McManus, 1981; Sarrikostis and McManus, 1987). These move in opposite directions, converge at the mouth of the Tay Estuary and deliver sediment to two local transport gyres around the Abertay and Gaa Sands (see Fig. 2).
Methodology
Based on a review of existing literature and extensive reconnaissance of contemporary processes, four end-member sediment sources contributing to the bed sediments of the estuary were identified as the Rivers Tay and Earn and the marine sectors immediately to the north (Angus coast) and south (Fife coast) of the estuary mouth.
In the case of fluvial sources, 27 bed sediment samples were collected directly using a van Veen grab from the lower reaches (as far as 2 km upstream of the confluence) of both rivers as well as from an additional site on the River Earn 20 km upstream. Care was taken to collect material representative of both the centre and margins of the river channels. In the case of marine sources, 15 samples
representing the northern marine sector were collected at low water from the beach between Carnoustie and Buddon Ness and 15 samples representing the southern marine sector were collected at low water from the beach between the Eden Estuary and Tentsmuir Point. In the Tay Estuary itself, 407 bed sediment samples were assembled involving both archival and samples collected during the period 2001 to 2002, with all reaches represented. Immediately after collection, all samples were air dried and stored in sealed bags under cool, dry conditions. Major transformation of the magnetic properties of the archival samples during storage was not anticipated because the organic matter content of the samples was generally low.
Samples were screened to 1 mm and packed into 10 ml plastic containers, using cling-film to immobilise the sediment. To ensure that variable sample volumes did not influence results, containers were filled to at least half capacity (Dearing, 1994). Magnetic susceptibility was determined for each sample as the mean of five repeat measurements using a Bartington MS2B Dual Frequency sensor, with low and high frequency settings of 0.47 kHz and 4.7 kHz respectively. A Molspin AF demagnetiser with an ARM attatchment and a Molspin 1 T pulse magnetiser induced ahysteretic remanence magnetisation (ARM) and isothermal remanence magnetisation (IRM) respectively, measured subsequently using a Molspin 1 A fluxgate magnetometer. IRM was measured for forward fields of 40 mT, 100 mT, 300 mT, 500 mT and 1.0 T and a reverse field of 100 mT. IRM1.0T is, hereafter, referred to as the saturation isothermal remanent magnetisation (SIRM).
The full range of magnetic parameters obtained (Table 1) was subjected to a simultaneous R- and Q-mode factor analysis (Walden and Smith, 1995). This technique reduces the dimensionality of magnetic datasets by extracting underlying trends. Source contributions were estimated by inputting the data to a mixing model based on optimised linear programming (Rowan et al., 2000). The robustness of the optimised solution was gauged by the explained variance (Nash and Stucliffe, 1970), termed the efficiency (E).
∑
∑
= = − − − = m i i i m i i i x x x x E 1 2 1 2 ) ( ) ˆ ( 1 (1)where mis the total number of sediment properties,xis the mean of the source group properties, and xiand xˆ are thei measured and predicted values for property i(i = 1, 2, .., m). The linear mixing model used to calculatexˆi is of the form:
∑
== n j ij j
i a b
x
1
) (
ˆ (2)
[image:3.595.90.260.67.295.2]1010
Table 1. Mass specific mineral magnetic parameters and parameter ratios acquired during this study and an overview of their interpretation (after Walden and Ballantyne, 2002; Walden, 1999; Thompson and Oldfield, 1986).
χ Initial low field mass specific magnetic susceptibility. Its value is roughly proportional to the concentration (10–7 m3 kg–1) of ferrimagnetic minerals within a sample, although, in materials with little or no ferrimagnetic component and
a relatively large antiferromagnetic component, the latter may dominate the signal.
χfd Frequency dependent susceptibility. This is a measure of the variation of susceptibility when measured at a
(%) low (0.47 kHz) and high (4.7 kHz) frequency, expressed as a percentage of total low frequency susceptibility in this study. It indicates the presence of viscous grains lying at the stable single-domain/superparamagnetic boundary and their delayed response to the magnetising field.
χarm Anhysteretic remanent magnetisation (ARM) was induced in samples during this study by combining a peak
(10–7 Am2 kg–1) AC field of 100 mT with a DC biasing field of 0.04 mT. The final measurement is expressed as mass specific ARM per unit of steady field, or χarm. The value is roughly proportional to the concentration of ferrimagnetic grains in the 0.02 to 0.4 mm (stable single-domain) range.
SIRM Saturation isothermal remanent magnetisation (SIRM) is the highest amount of magnetic remanence that can (10–5 Am2 kg–1) be produced in a sample by applying a large magnetic field. A ‘saturating’ field of 1 T was used in this study
and this will produce saturation in most mineral types. However, some antiferromagnetic minerals may not be saturated at this field (e.g. goethite) and therefore this parameter is often called IRM1.0T. SIRM is related to the concentrations of all remanence-carrying minerals in a sample but is also dependent upon the assemblage of mineral types and their magnetic grain size.
IRMsoft The amount of isothermal remanent magnetisation (IRM) acquired by a sample in a forward field of 40 mT. At (10–5 Am2 kg–1) such low fields, the magnetically ‘hard’ (high coercivity) canted antiferromagnetic minerals, such as haematite or geothite, are unlikely to contribute to the IRM, even at fine grain sizes. The value is therefore approximately proportional to the concentration of the magnetically ‘softer’ (low coercivity) ferrimagnetic minerals (e.g. magnetite) within the sample, although it is also grain size dependent.
IRMhard Defined as SIRM minus IRM300mT. At fields of 300 mT, the majority of magnetically ‘soft’ (low coercivity) (10–5 Am2 kg–1) ferrimagnetic minerals will already have saturated and any subsequent growth of IRM will be due to a magnetically
‘harder’ (high coercivity) canted antiferromagnetic component within the sample. The value is therefore roughly proportional to the concentration of canted antiferromagnetic minerals (e.g. haematite and goethite) within the sample.
IRM Various magnetisation parameters can be obtained by applying one or more magnetic fields to a sample. The acquisition magnetisation at each forward or reversed step can be expressed as a ratio of IRMfield/SIRM, and therefore gives ratios a result between +1 and –1, normalised for concentration. These ratios can be used to discriminate between (dimensionless) ferrimagnetic and antiferromagnetic mineral types. A parameter frequently cited in magnetic investigations is
the ‘S’ ratio, defined in this study as IRM-100mT/SIRM. Samples dominated by a ferrimagnetic mineral assemblage generally produce S ratio values approaching –1, as the majority of the ferrimagnetic component is saturated in a field of 100 mT. Conversely, samples dominated by an antiferromagnetic mineral assemblage will produce values closer to 0.
SIRM/χlf These parameters can reveal the dominant types and grain sizes of magnetic minerals occurring within a sample.
(102 Am-1) SIRM/χ
lf may be diagnostic of either mineralogy (e.g. a low ratio may be indicative of the presence of paramagnetic minerals) or, where samples have similar mineral types and concentrations, dominant magnetic grain size. The SIRM/χarm ratio of SIRM/χarm is a useful indicator of magnetic grain size because SIRM responds primarily to the overall (102 Am-1) concentration of remanence-holding magnetic minerals whereas χ
arm is strongly dependent upon the concentration of specific ferrimagnetic grain sizes. The ratio of χarm/χlf may also be indicative of the concentration of finer
subject to the constraints
∑
=
=
n
j j b
1
1 and 0≤bj ≤1
where n is the number of source groups, a is the mean value of property i (i=1, 2, ..., m) of source group j (j = 1, 2, ....n) and b is the contributory coefficient of source group j.
Multivariate discriminant analysis (MDA) is useful in optimising the parameter set in an unmixing model of the type described above (Rowan et al., 2000; Collins and Walling, 2002). In this instance, a stepwise approach yielded
χlf, χarm/χlf, SIRM/χlf, IRM40/SIRM, S ratio and IRMhard as
the composite tracer group most effective in discriminating between the source end-members.
The sediment samples representing the Tay Estuary were grouped according to the sub-environment and reach from which they were collected and average source contributions were calculated for each group. The sub-environments of the Tay Estuary (Buller et al., 1975) assume that sediment texture represents the integration of physical, chemical and biological variables over a sufficient time interval for a deposit to become ‘characteristic’ of its particular hydraulic and hydrodynamic setting.
Results and interpretation of the
magnetic measurements
Differences between the fluvial and marine end-members are shown most clearly by concentration-dependent parameters, with higher values of χlf, χarm and SIRM for the
Rivers Earn and Tay (Table 2). The estuarine sample
populations display an intermediate value for both χlf and
χarm but approximate more closely to the marine
end-members in terms of SIRM. Values of χfd are very low for
all sample groups and the value for the estuary matches that of the Fife coast end-member.
Interparametric ratios are useful for sample discrimination in studies of sediments with mixed provenance as they remove the masking effects of concentration of magnetic minerals on bulk sediment magnetic properties. This permits evaluation of other controls, such as mineral type and the grain sizes of ferrimagnetic components (Lees, 1999). The River Earn and River Tay source end-members are strongly discriminated by IRM40/SIRM, S ratio and SIRM/χlf (Table 2). These parameters also discriminate between the Angus coast and Fife coast source end-members, albeit not so strongly as in the case of the fluvial sources.
[image:5.595.65.542.502.731.2]The higher values of χlf for fluvial sediments relative to their marine counterparts indicate a higher concentration of magnetisable material in the samples while higher SIRM values confirm that this material is principally ferrimagnetic minerals. However, the pattern of IRM acquisition, which was measured at five different fields and is summarised in Table 1 by the ratios of IRM40/SIRM and IRM300/SIRM, reveals an assemblage containing more than simply ferrimagnetic components of uniform grain size. Ferrimagnetic minerals generally display complete saturation at fields of 100 mT but, at 40 mT, only 25 to 41% saturation occurred and, at 300 mT, saturation was still not achieved in any of the sample sets. The S ratio is a useful parameter for distinguishing mineral type, although it is also
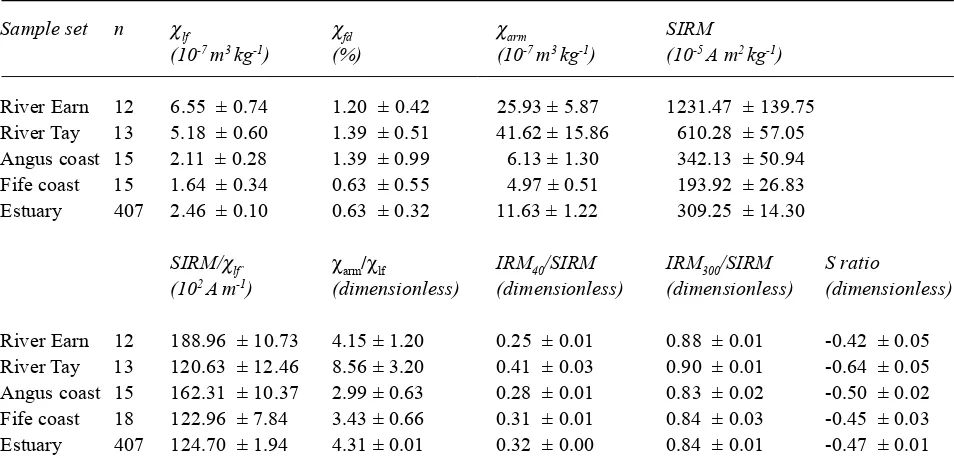
Table 2. Average values and 95% confidence intervals for selected magnetic parameters and parameter ratios.
Sample set n χlf χfd χarm SIRM
(10-7 m3 kg-1) (%) (10-7 m3 kg-1) (10-5 A m2 kg-1)
River Earn 12 6.55 ± 0.74 1.20 ± 0.42 25.93 ± 5.87 1231.47 ± 139.75
River Tay 13 5.18 ± 0.60 1.39 ± 0.51 41.62 ± 15.86 610.28 ± 57.05
Angus coast 15 2.11 ± 0.28 1.39 ± 0.99 6.13 ± 1.30 342.13 ± 50.94
Fife coast 15 1.64 ± 0.34 0.63 ± 0.55 4.97 ± 0.51 193.92 ± 26.83
Estuary 407 2.46 ± 0.10 0.63 ± 0.32 11.63 ± 1.22 309.25 ± 14.30
SIRM/χlf` χarm/χlf IRM40/SIRM IRM300/SIRM S ratio
(102 Am-1) (dimensionless) (dimensionless) (dimensionless) (dimensionless)
River Earn 12 188.96 ± 10.73 4.15 ± 1.20 0.25 ± 0.01 0.88 ± 0.01 -0.42 ± 0.05
River Tay 13 120.63 ± 12.46 8.56 ± 3.20 0.41 ± 0.03 0.90 ± 0.01 -0.64 ± 0.05
Angus coast 15 162.31 ± 10.37 2.99 ± 0.63 0.28 ± 0.01 0.83 ± 0.02 -0.50 ± 0.02
Fife coast 18 122.96 ± 7.84 3.43 ± 0.66 0.31 ± 0.01 0.84 ± 0.03 -0.45 ± 0.03
1012
influenced by magnetic grain size. S ratio values become more negative with increasing ferrimagnetic contribution and approach –1 in the case of coarse magnetite. The bed sediments of the estuary and source end-members displayed S ratio values from –0.42 to –0.64; these imply a contribution to their mineral magnetic assemblages from canted antiferromagnets.
An interpretation based on χlf alone suggests that, of the
two fluvial sources, the River Earn is the source of sediment with the greater concentration of magnetisable minerals. However, the pattern of IRM acquisition in forward fields combined with more negative S ratio values suggest that the magnetic mineral assemblage of the River Tay incorporates a greater ferrimagnetic component, characterised by a ‘softer’ magnetic signal. Furthermore, higher values of χarm/χlf for the River Tay than for the River
Earn imply that the sediments of the former incorporate a greater concentration of magnetic grains in the fine, stable single-domain range. Variation of both concentration-dependent parameters and concentration-inconcentration-dependent ratios between the marine source end-members is lower than that between the fluvial end-members. This is indicative of a greater similarity in the types and grain sizes of the magnetic mineral assemblages characterising the bed sediments derived from each marine source.
Results of the factor analysis and
unmixing model
Descriptive statistics and inter-parameter correlations were used to select magnetic parameters as input variables for the factor analysis. It was decided to omit χfd to avoid any
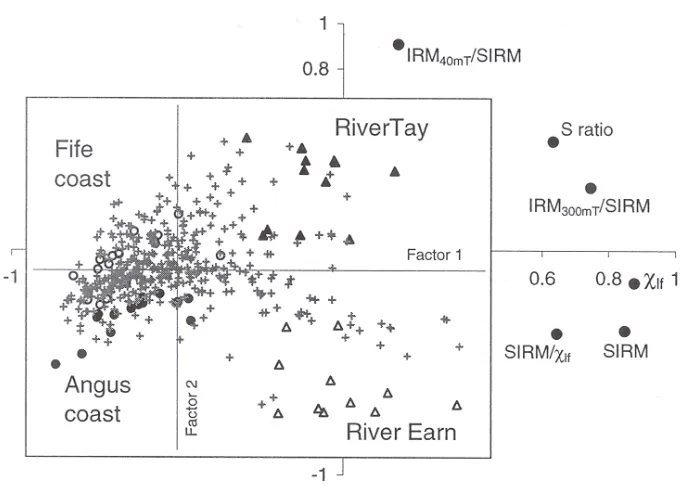
potential for measurement error associated with samples displaying a weak response. Simultaneous R- and Q- mode factor analysis allows variable and sample loadings to be plotted together to provide a visualisation of the underlying trends in a dataset (Walden and Smith, 1995) and Fig. 3 shows output from such a factor analysis using the dataset in this study. Lees (1999) observed that patterns typically seen in magnetic data are caused by two main components, a ferrimagnetic and a canted antiferromagnetic component. In Fig. 3, Factor 1, upon which χlf and SIRM have high
loadings (> 0.8), represents the first of these while Factor 2, upon which the loading of IRM40mT/SIRM is high (>0.9), possibly represents the second, although magnetic grain size may also be an influence. More than 70% of the variation inherent in the selected variables is accounted for by these first two Factors. In Fig. 3, estuarine samples generally plot between the clusters defined by samples belonging to the source end-members. This outcome satisfied the authors that no major sediment source to the Tay Estuary had been omitted from the study and that mathematical unmixing of source contributions to the estuarine bed sediments could
Fig. 3. Scatter plot showing the results of the factor analysis, with inset expanding the area of the origin. The River Earn, River Tay, Angus coast and Fife coast samples are indicated by open triangles, closed triangles, closed circles and open circles respectively, and
[image:6.595.121.464.450.693.2]proceed. The high degree of association between the estuarine samples and marine end-members, particularly the Fife coast source, is consistent with the findings of an earlier attempt to model sediment provenance in an upper Tay Estuary channel (Duck et al., 2001).
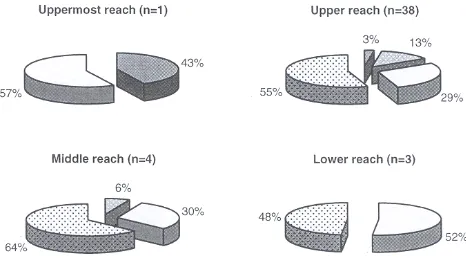
Bulk average source end-member contributions to the Tay Estuary bed sediments are 3% from the River Earn, 17% from the River Tay, 29% from the Angus coast and 51% from the Fife coast. Figures 4 to 9 show average source contributions on the basis of sub-environment and reach.
Sediments of the channels and sandbanks are dominated by marine derived material (Fig. 4). The fluvial contribution increases with distance from the mouth of the estuary, peaking at 41% in the uppermost reach. Seaward of the uppermost reach, material derived from the River Earn diminishes dramatically and is completely absent from the lower reach. The Fife coast source contribution to channel and bank sediments progressively overshadows that of the Angus coast with increasing distance from the mouth of the estuary.
Sediment occurring in shoals, on major sandbanks and on the margin between channel and intertidal flats tends to be dominated by material derived from the Fife coast (Fig. 6). The contribution from the River Tay is greater in the upper than in the middle reach while that of the River Earn is insignificant in both. Although marine source contributions to intertidal flat sediments vary greatly with distance from the estuary mouth, the fluvial source contributions are consistently higher among upper intertidal flat sediments (Figs. 7 and 8). The fluvially derived component of marsh edge sediments exceeds that of the upper intertidal flats but displays the same dominance of the River Tay source contribution over that of the River Earn (Fig. 9).
Fig. 4. Average source contributions to the bed sediments of channels and sandbanks
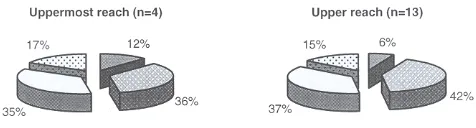
Fig. 5. Average source contributions to the bed sediments of scoured channels
The fluvial contribution to sediment in scour-dominated channels (Fig. 5) is greater than that observed in lined channels and the Fife coast source accounts for only a minor part of the marine contribution.
Fig. 6. Average source contributions to the bed sediments of shoals, minor channels, major sandbanks and the lower margin of the
intertidal flats
Fig. 7. Average source contributions to the bed sediments of the lower intertidal flats
[image:7.595.317.554.72.131.2] [image:7.595.54.292.343.483.2] [image:7.595.315.548.404.537.2] [image:7.595.313.546.619.684.2]1014
Discussion
The mineral magnetic signatures encountered in this study typically show multi-domain ferrimagnetic magnetite components characteristic of unweathered bedrock, including low χfd values and steep acquisition and loss of
IRM in low fields (Oldfield, 1999). Fluvial bed sediments display higher concentrations of magnetic grains than those of the marine source end-members. Furthermore, the sediments of the River Tay are distinguished by a ‘softer’ ferrimagnetic signal than those of the River Earn.
Rising sea level during the Holocene (maximum 5 ka B.P.) enabled the transfer of shelf sediments into estuarine sinks (Carter, 1989) and the majority of sediment in temperate estuaries is thought to be derived from marine sources (Dyer, 1986). Furthermore, the subtle and interchangeable balance existing in the Tay Estuary between sediment input from marine and fluvial sources may have changed, resulting in a transition from one sediment regime to another (Buller and McManus, 1975). Growth over the past half century in hydroelectric schemes in the catchment of the Tay, coupled with the natural trapping of sediment in Highland lochs, has resulted in a reduction in fluvial sediment input, exhibited by patterns of scour in the upper estuary channel and intertidal flats. Characterised by emergent banks, subaqueous dunes and sediment-lined channels, the middle estuary is a zone of accumulation for marine-derived sediment in addition to sand from upper estuary channels and margins and coarse sand from the River Earn. The balance at present appears to be in favour of marine domination. This interpretation is supported by the results of the unmixing model which indicate dominance of marine-derived sediment not only in the lower and middle reaches but also in the upper and uppermost reaches.
[image:8.595.42.280.65.129.2]Mapping of source contributions to individual sediment samples reveals a complex pattern with a potential for large variations over small spatial scales. This may owe much to the complex hydrodynamics and morphology of estuarine systems where flow may be separated by mid-estuary banks into multiple ebb- and flood-dominated channels. Localised areas of high variability in source contribution typically denote zones where channels converge. Such a zone occurs
Fig. 9. Average source contributions to the bed sediments along marsh edges
immediately west of the Road Bridge (Fig. 1) where multiple channels of the middle reach meet the single main channel of the upper estuary. Variations may also be due to the presence of faecal deposits built by mussel colonies, the mucilaginous content of which permits the retention of fine sediment which is resuspended under purely physical conditions.
The main trends for the Tay Estuary emerging from the unmixing procedure may be summarised as follows:
z ‘High energy’ sub-environments characterised by high
flow velocities, wave action and turbulence, display low fluvial source contributions. The River Tay is the dominant fluvial source and, except in scoured channels, the Fife coast is the dominant marine source. Contributions from the fluvial and marine sources generally fall with distance from the head and mouth of the estuary respectively.
z ‘Low energy’ marginal sub-environments characterised
by low flow velocities, wave action and turbulence display higher fluvial contributions to their bed sediments. The River Tay once again dominates the fluvial contribution but the Angus coast prevails as the dominant marine source. Furthermore, marine and fluvial sediment contributions do not fall with distance from their respective entry points to the estuary.
1990 may have stabilised this section of the Angus coastline. The results of this preliminary study offer weight to this interpretation but require corroboration from other sources. Higher fluvial contributions to bed sediments of the upper tidal flats and marsh edges are likely to be related to the preferential accumulation of suspended load in these areas. Low flow velocities and minimal turbulence allow the settling of silt and clay particles but limit the influx of the sand. Indeed, bedload transport decreases gradually onto the tidal flats but ceases abruptly in the upper regions at the contour line of 10% silt and clay (McManus, 1986b). Whereas fluvial and marine sediment contributions to the high energy sub-environments decline with distance from the head and mouth of the estuary respectively, the transport of suspended load through vertical gravitational circulation and regular resuspension and concentration in shifting turbidity maxima means that such a pattern is observed neither on the upper tidal flats, nor along marsh edges. An explanation for the marine source dominance in marginal areas from the Angus coast remains elusive as knowledge of variations in quantities and concentrations of suspended sediment being introduced into the estuary by flood tides is presently unavailable.
Previous sedimentological surveys of the uppermost reach of the estuary suggested the existence of a ribbon of coarse sediment extending from the mouth of the River Earn into the channels trending north of Mugdrum Island (Buller and McManus, 1975). However, results of the factor analysis and unmixing model indicate that the River Tay source contributions dominate the channel sediments to the north of the island. Conversely, contributions from the River Earn are greater to the south, although active scour in this channel means that there is little mobile bed material for collection and analysis.
Conclusions
Infilling by marine-derived sediment accompanying post-glacial sea level rise, as observed in other estuaries of the North Sea (Anthony, 2000), is reflected in the modern bed sediments of the Tay Estuary. Use of the fingerprinting approach permitted the further apportionment of the wider estuarine sink in terms of its various sediment inputs. In this study, composite magnetic signatures dominated by magnetic susceptibility and remanence permitted discrimination of the four main sources of bed sediments in the estuary. Lees (1997) suggested that this is the maximum number of sources which may be unmixed successfully on the basis of such magnetic characterisation and further research must address the uncertainty associated with the unmixing procedure (Rowan et al., 2000). In these
preliminary results, conservative behaviour and the absence of enrichment or dilution effects were assumed and future work will explore these assumptions in greater detail.
References
Al-Dabbas, M.A.M. and McManus, J., 1987. Shell fragments as indicators of bed sediment transport in the Tay Estuary. Proc. Roy. Soc. Edinburgh, 92B, 335–344.
Anthony, E.J., 2000. Marine sand supply and Holocence coastal sedimentation in northern France between the Somme estuary and Belgium. In: Coastal and Estuarine Environments: Sedimentology, Geomorphology and Geoarchaeology, K. Pye and J.R.L.Allen, (Eds.). Geol. Soc., London, Special Publications, 175, 87–97.
Buller, A.T., 1975. Sediments of the Tay Estuary. II. Formation of ephemeral zones of high suspended sediment concentrations.
Proc. Roy. Soc. Edinburgh, 75B, 66–89.
Buller, A.T. and McManus, J., 1975. Sediments of the Tay Estuary, Part 1:Bottom sediments of the upper and upper middle reaches.
Proc. Roy. Soc. Edinburgh, 75B, 41–64.
Buller, A.T., McManus, J. and Williams, D.J.A., 1971.
Investigations in the estuarine environments of the Tay. Tay Estuary Research Centre (TERC), University of Dundee, Rept 1. Buller, A.T., Green, C.D. and McManus, J., 1975. Dynamics and sedimentation: The Tay in comparison with other estuaries. In:
Nearshore sediment dynamics and sedimentation, J.Hails and A.Carr (Eds.). Wiley, Chichester, UK. 201–249.
Carter, R.W.G., 1989. Coastal Environments. Academic Press, London.
Charlton, J.A., McNicoll, W. and West, J.R., 1975. Tidal and freshwater induced circulation in the Tay Estuary. Proc. Roy. Soc. Edinburgh, 75B, 11–27.
Collins, A.L. and Walling, D.E., 2002. Selecting fingerprint properties for discriminating potential suspended sediment sources in river basins. J. Hydrol., 261, 218–244.
Dearing, J.A., 1994. Environmental magnetic susceptibility: using the Bartington MS2 system. Chi Publishing, Kenilworth, UK. Duck, R.W., Rowan, J.S., Jenkins, P.A. and Youngs, I., 2001. A
multi-method study of bedload provenance and transport pathways in an estuarine channel. Phys. Chem. Earth (B), 26, 747–752.
Dyer, K.R., 1986. Coastal and Estuarine Sediment Dynamics. Wiley, Chichester. UK.
Ferentinos, G. and McManus, J., 1981. Nearshore processes and shoreline development in St. Andrews Bay, Scotland, U.K. Spec. Publs. Int. Ass. Sediment. 5, 161–174.
Foster, I.D.L. and Lees, J.A., 2000. Tracers in geomorphology: theory and applications in tracing fine particulate sediments. In: Tracers in Geomorphology, I.D.L.Foster (Ed.). Wiley, Chichester, UK., 3–20.
Lees, J. A., 1997. Mineral magnetic properties of mixtures of environmental and synthetic materials: linear additivity and interaction effects. Geophys. J. Int., 131, 335-346.
Lees, J.A., 1999. Evaluating magnetic parameters for use in source indentification, classification and modelling of natural and environmental materials. In: Environmental magnetism: a practical guide, J. Walden, F.Oldfield and J.P.Smith (Eds.).
Technical Guide, No. 6. Quaternary Research Association, London, 113–138.
1016
McManus, J., 1986a. Land derived sediment and solute transport to the Forth and Tay Estuaries, Scotland. J. Geol. Soc., 143,
927–934.
McManus, J., 1986b. Sediment transport patterns in the Tay Estuary. In: 3rd International Symposium on River
Sedimentation, S.Y.Wang, H.W. Shen and L.Z.Ding, (Eds.). School of Engineering, University of Mississippi, 517–524. McManus, J., 1999. Coarse estuary mouth ballast gravel deposits:
a source case history. Estuar. Coast. Shelf Sci., 48, 677–682. McManus, J. and Wal, A., 1996. Sediment accumulation
mechanics on the Tentsmuir Coast. In: Fragile Environments,
G.Whittington (Ed.). Scottish Cultural Press, 1–15.
Mishra, S.K., 1969. Heavy mineral studies of the Firth of Tay region, Scotland. J. Geol. Soc., University of Saugar, 5, 37–49. Nash, J.E. and Sutcliffe, J.V., 1970. River flow forecasting through conceptual models. A discussion of principles. J. Hydrol.,10, 282–290.
Oldfield, F., 1999. The rock magnetic identification of magnetic mineral and magnetic grain size assemblages. In: Environmental magnetism: a practical guide, J.Walden, F.Oldfield and J.P. Smith, (Eds.). Technical Guide, No. 6. Quaternary Research Association, London, 98–112.
Oldfield, F., Brown, A. and Thompson, R., 1979. The effect of microtopography and vegetation on the catchment of airborne particles, measured by remanent magnetism. Quaternary Res.,
12, 326–332.
Rowan, J.S., Goodwill, P. and Franks, S.W., 2000. Uncertainty estimation in fingerprinting suspended sediment sources. In:
Tracers in Geomorphology, I.D.L.Foster (Ed.). Wiley, Chichester, UK., 279–289.
Sarrikostis, E. and McManus, J., 1987. Potential longshore transports on the coasts north and south of the Tay Estuary.
Proc. Roy. Soc. Edinburgh, 92B, 267–310.
Thompson, R. and Oldfield, F., 1986. Environmental Magnetism. Allen and Unwin, London.
Walden, J., 1999. Remanence measurements. In: Environmental magnetism: a practical guide, J.Walden, F.Oldfield. and L.P.Smith (Eds.), Technical Guide 6. Quaternary Research Association, London, 63–87.
Walden, J. and Smith, J. P., 1995. Factor analysis: a practical application. In: Statistical Modelling of Quaternary Science Data, D.Maddy and J.S.Brew, (Eds.) Technical Guide 5, Quaternary Research Association, Cambridge, 39–63. Walden, J. and Ballantyne, C.K., 2002. Use of environmental
magnetic measurements to validate the vertical extent of ice masses at the Last Glacial Maximum. J. Quaternary Sci., 17,
193–200.
Walling, D.E. and Woodward, J.C., 1995. Tracing sources of suspended sediment in River Basins – A case-study of the River Culm, Devon, UK. Mar. Freshwater Res., 46, 327–336. Yu, L. and Oldfield, F., 1989. A multivariate mixing model for
identifying sediment source from magnetic measurements.