www.hydrol-earth-syst-sci.net/16/3293/2012/ doi:10.5194/hess-16-3293-2012
© Author(s) 2012. CC Attribution 3.0 License.
Earth System
Sciences
Depression storage and infiltration effects on overland flow
depth-velocity-friction at desert conditions: field plot results and
model
M. J. Rossi and J. O. Ares
National Patagonic Centre, CONICET, Boulvd. Brown 2915, 9120 Puerto Madryn, Chubut, Argentina Correspondence to: M. J. Rossi (rossijulieta@gmail.com)
Received: 3 April 2012 – Published in Hydrol. Earth Syst. Sci. Discuss.: 7 May 2012 Revised: 6 August 2012 – Accepted: 20 August 2012 – Published: 14 September 2012
Abstract. Water infiltration and overland flow are relevant in
considering water partition among plant life forms, the sus-tainability of vegetation and the design of sustainable hydro-logical models and management. In arid and semi-arid re-gions, these processes present characteristic trends imposed by the prevailing physical conditions of the upper soil as evolved under water-limited climate. A set of plot-scale field experiments at the semi-arid Patagonian Monte (Argentina) were performed in order to estimate the effect of depres-sion storage areas and infiltration rates on depths, veloci-ties and friction of overland flows. The micro-relief of undis-turbed field plots was characterized atz-scale 1 mm through close-range stereo-photogrammetry and geo-statistical tools. The overland flow areas produced by controlled water in-flows were video-recorded and the flow velocities were mea-sured with image processing software. Antecedent and post-inflow moisture were measured, and texture, bulk density and physical properties of the upper soil were estimated based on soil core analyses. Field data were used to calibrate a physically-based, mass balanced, time explicit model of in-filtration and overland flows. Modelling results reproduced the time series of observed flow areas, velocities and infiltra-tion depths. Estimates of hydrodynamic parameters of over-land flow (Reynolds-Froude numbers) are informed. To our knowledge, the study here presented is novel in combining several aspects that previous studies do not address simulta-neously: (1) overland flow and infiltration parameters were obtained in undisturbed field conditions; (2) field measure-ments of overland flow movement were coupled to a detailed analysis of soil microtopography at 1 mm depth scale; (3) the effect of depression storage areas in infiltration rates and
depth-velocity friction of overland flows is addressed. Rele-vance of the results to other similar desert areas is justified by the accompanying biogeography analysis of similarity of the environment where this study was performed with other desert areas of the world.
1 Introduction
The complexity of interactions between overland flow and infiltration has long received attention in hydrological stud-ies. The spatial variability of soil microtopography has been identified as a major determinant of infiltration rates and the hydrological response of watersheds (Abrahams et al., 1990; K¨ohne et al., 2009; Darboux et al., 2001). Usual procedures to study run-off-infiltration processes involve the use of hy-drological models based on hydrograph records. Although a large body of literature has been devoted to the criteria used to inspect hydrograph records (Ewen, 2011), less atten-tion has been paid to the fact that many hydrological models that can accurately reproduce hydrograph records, produce severely biased estimates of overland flow velocities (M¨ugler et al., 2011; Legout et al., 2012) or Reynolds-Froude num-bers (Tatard et al., 2008).
3294 M. J. Rossi and J. O. Ares: Infiltration and overland flow at desert condition
(Darboux et al., 2001; Hessel et al., 2003; Li, 2009). Both of these are calculated from the same variables (flow rate, terrain slope, roughness, Reynolds numbers) and both suffer from limitations imposed by the high variability of the repre-sented effects both in space and time. Abrahams et al. (1990) studied Darcy-Weisbach’sf for desert hill slopes and found that it varies with the rate of flow. Since the rate of flow is highly variable in space, so too isf. Analogous limitations can be expected in relation to Manning’sn.
In the case of arid and semi-arid areas, complex inter-actions between run-off generation, transmission and re-infiltration over short temporal scales (Li et al., 2011; Re-aney, 2008) add difficulties in the estimation of infiltration-overland flows. In these areas, the soil surface is predomi-nantly flat and gently sloped at extended spatial scales, and the excess rainfall moves at the surface of the soil in very shallow structures combining small overland flow areas inter-spersed with finely ramified fingering patterns of small chan-nels. Infiltration in arid and semi-arid regions can also be modified by the development of water-repellent areas (Lip-sius and Mooney, 2006) which in cases occur in relation to soil microtopography (Biemelt et al., 2005).
Composite patterns of overland flow (Parsons and Wain-wright, 2006; Smith et al., 2011) can be expected to produce spatially heterogeneous patterns of water infiltration in the upper soil (van Schaik, 2009). Results obtained by Esteves et al. (2000) in laboratory run-off plots, indicate that despite the soil being represented by only one set of parameters, infiltra-tion was not homogeneous all over the plot surfaces. They concluded that the microtopography had a strong effect on observed flow directions, producing small ponds along the paths of flow and altering the flow depths and velocity fields. Descroix et al. (2007) observed that catchments and small plot studies in arid regions usually show a so-called “hor-tonian” trend, with characteristic absence of base flow. This was the case in semi-arid northern Mexico for catchments as large as tens of thousands of km2, and for approxi-mately 500 km2 in the Western Sierra Madre. Latron and Gallart (2007) working at the Pyrenees determined that there is a strong relationship between the base flow and the ex-tension of saturated areas at the basin scale. In Australia’s semi-arid rangelands, patches of bare soils were determined to be the main run-off controlling factor (Cammeraat, 2002; Bartley et al., 2006).
Thompson et al. (2011) observed that the lateral redistri-bution of ponded water generated during intense rainstorms plays an important role in the hydrological, biogeochemical and ecological functioning of patchy arid ecosystems. Lateral redistribution of surface water in patchy arid ecosystems has been hypothesized to contribute to the maintenance of vege-tation patches through the provision of a water subsidy from bare sites to vegetated sites (Bromley et al., 1997). A strong control on field-scale infiltration is exerted by the horizon-tal spatial variability of infiltration properties (Lipsius and Mooney, 2006; van Schaik, 2009). Such infiltration-overland
flow processes occur during hortonian run-off events on slop-ing ground. Surface flow redistribution may also occur on flat ground if the presence of vegetation patches creates contrasts in infiltration rate between dry soil and water saturated areas. Changes in the pattern of surface water re-distribution oc-cur during early stages of desertification (Ares et al., 2003). Several studies indicate that the horizontal movements of the naturally scarce rainfall water on the surface soil in arid regimes contribute to define the spatial pattern of woody and herbaceous vegetation forms as well as the extent of bare soil patches (Aguiar and Sala, 1999; Ares et al., 2003; Borgogno et al., 2009; Dunkerley, 2002).
Water infiltration in the soil has been successfully mod-elled through various techniques. Some existing models ap-ply numerical solutions to the Richards equation (Radcliffe and Simunek, 2010; Weill et al., 2011), while others use various modifications to the Green-Ampt (Green and Ampt, 1911) model (Gowdish and Mu˜noz C´arpena, 2009; Mengistu et al., 2012; Schr¨oder, 2000).
Experiments and models on overland flow have exten-sively used so-called kinematic wave reduced solutions to the Saint-Venant (S-V) equations (M¨ugler et al., 2011; Thomp-son et al., 2011). The numerical solutions of these reductions require the estimation of frictional effects acting on overland flow. Also, in order to construct continuity equations, the av-erage depth of the overland flow must be known as well as its propagation velocity. Although the S-V equations have consistently proved capable of accurately simulating hydro-graphs at plot scale, most of the assumptions underlying the estimation of frictional forces and flow depth do not hold when applied to overland flows in field conditions (Smith et al., 2007). Moreover, the choice of roughness models to be used in the S-V equations is most often done with the purpose of increasing the hydrograph quality, while the actual travel time of water is ignored. In extended hydrological practice, frictional factors are usually taken from published tables or assumed spatially constant (Esteves et al., 2000).
rainfall input as a consequence of the position of the plot area in the drainage network. Abrahams et al. (1990) used trick-les to supply 140 000 mm3s−1 to the top of 10 m2plots in studies of flow resistance in semi-arid environments, while Dunkerley (2003) choose perforated pipes to deliver 1×10³ to 9×103mm3s−1to laboratory plots of 1.4 m2.
Plot studies usually require some disturbance of naturally occurring conditions, like constructing flumes (Esteves et al., 2000; Gim´enez et al., 2004), modifying the soil surface to ob-tain desired flow channels (M¨ugler et al., 2011) or simulating the soil surface with technical artifacts (Dunkerley, 2003). Rainfall-run-off plot experiments where a device is used to generate rainfall events mimicking natural conditions may also require measuring the water flow at an outlet in order to compute water mass balances (Grierson and Oades, 1977; Cerd´a et al., 1997). These experimental setups introduce arti-facts affecting to some degree the characteristics of the over-land flows as compared to those under field conditions.
Plot experiments are often used to obtain estimates of de-pression storage (DS) (Antoine et al., 2011) in studies of overland flow, in the context of interpreting DS retention effect on hydrograph records (Govers et al., 2000; Hansen, 2000; Darboux et al., 2001). The underlying concept is that DS areas behave as a temporary passive storage of overland flow resulting in a delay in the hydrograph signals. This in turn prompts interest in its direct measurement at the plot scale through geometrical analysis of elevation models (Plan-chon and Darboux, 2002) or from surface roughness mea-surements (Antoine et al., 2011).
Comparisons among results obtained in field studies on overland flows at various semi-arid/arid environments might benefit from biogeography analysis of the corresponding ex-perimental sites. Regional similarities as estimated through comparative biogeography (Parenti and Ebach, 2009) result from analyzing spatial and functional patterns of biodiver-sity, species distribution, and geological history.
This study is part of a larger project at the National Patag-onic Centre (Chubut, Argentina) to develop tools for the eco-hydrological analysis of the desertification processes. It builds on previous results obtained by Ares et al. (2003) indicating that early desertification processes involve mod-ifications of the overland flow patterns and its distribution among the various vegetation life forms in the Patagonian Monte (Argentina). Here, an experimental protocol is pre-sented of the field plot experiments and coupled simulation model to estimate infiltration and overland flow parameters in the Monte environment. The protocol involves parameters that can be quantitatively estimated with an adequate degree of precision (overland flow velocity, infiltration depth, soil water content, depression storage area) as well as others that can indirectly be estimated through modelling results (sur-face frictional effect, average overland flow depth, Reynolds-Froude numbers). Specifically, this study addresses: (1) the effect of plot microtopography on infiltration-overland flows, and (2) the estimation of overland flow parameters (velocity,
depth, friction) needed to characterize water movement at the soil surface. A biogeography analysis of the similarity of the experimental site in this study with other areas of the world is also included to ease eventual comparisons of the results presented here with those obtained in similar studies.
2 Site and field experiments
2.1 Biogeography of the experimental site
The Monte desert is a South American subtropical to warm temperate desert and semi-desert located in western Ar-gentina from 24◦150S to 44◦200S. The study here presented was performed at a representative site of the biome in the area of the Patagonian Monte, a temperate region with a Mediterranean-like rainfall regime produced by the West-erlies from the Pacific affected by the rain shadow effect from the Andes (Abraham et al., 2009). Past precipitation records, observed (Haylock et al., 2006) and predicted pre-cipitation anomalies expected under various scenarios of cli-mate change (Carrera et al., 2007), indicate that precipitation events may occur at both high (>20 mm day−1) as well as low (<3 mm day−1) depths. This pattern corresponds to al-ternative atmospheric mechanisms of rain generation charac-teristic of the tropical regime prevailing at the northern part of the territory or prevailing winter-rain of the temperate lat-itudes (Prohaska, 1976). Both types are observable at times along most of the area occupied by the biome. There is a remarkable convergence between the desert areas of North and South America (Monte, Chihuahuan-Sonoran deserts) consisting in the same climate subtypes, the same dominant vegetation and the same combination of biological forms (Morello, 1984 as quoted by Abraham et al., loc. cit.). Sim-ilar conditions are extensively found in arid and semi-arid climates worldwide (Mares et al., 1985).
3296 M. J. Rossi and J. O. Ares: Infiltration and overland flow at desert condition
Poa ligularis (Nees ex Steud)) (Ares et al., 1990; Carrera et al., 2008). Soils are a complex of Typic Petrocalcids–Typic Haplocalcids with a fractured calcium carbonate layer from 0.45 to 1 m below the soil surface (del Valle, 1998). Upper soil texture types (USDA) are sandy or loamy sand.
2.2 Field experiments
Ten field plot experiments in undisturbed bare soil patches (800×800 mm) along a 540 m, down-sloping (−7.2 %) tran-sect from S:−42.17046, W:−64.96343 to S:−42.21366, W: −64.99225 were conducted during the dry season on days with air temperatures in the range of 20–32◦C. The spa-tial arrangement of plots was aimed to explore an altitudinal range of variation of soil texture. Water inflow to plots was applied at mid/low-slope length locations of inter-mound soil areas through a portable, wind protected, single-nozzle sys-tem mounted at 30 cm above soil level on a wooden frame, and calibrated with a pressure gauge to supply water in-flow rates in the range 225–4500 mm3s−1 to a small area (4.7±5.2 %) of each plot that was further neglected for es-timations of overland flow velocities. This created two plot sub-regions: one directly receiving the water inflow and an-other receiving the overland flow resulting from the excess of water input to the former. The water inflow range was aimed to simulate flow accumulation values at the spatial scales of this study as estimated with a flow routing algo-rithm (Tarboton and Ames, 2001). The frame supported a Kodak EasyShare Z712 IS 7.1 MP camera (©Eastman Ko-dak Company, Rochester, New York) with video mode, at near zenith position over the centre of the plot and about 1 m above ground level to obtain images of the whole plot area. Video records of the expanding overland wetted ar-eas were obtained during experiments of varying time length (72–1128 s) until the wet front reached some of the borders of the camera image in any direction. This implied a zero-discharge condition (all overland flow was infiltrated within the observed plot areas at the end of the experiments).
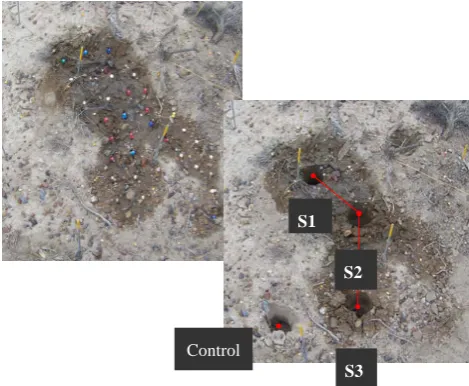
Soil moisture was evaluated immediately after the wa-ter inflow ceased with a TDR (Time-Domain Reflect mewa-ter, TRIME®-FM, Ettlingen) pin (50 mm) probe inserted at a proper angle in order to sample the top 30 mm of the soil at equidistant (30–35 mm) points of a grid covering the whole overland flow area and neighbouring dry points. TDR mates of soil moisture were calibrated with gravimetric esti-mates (y= 1.166x+ 0.05;R2= 0.92,n= 101;x: gravimetric θestimate) obtained by extracting 2–5 soil cores (Ø: 40 mm) along the main axis of the overland flow plumes, at the cen-tre of the directly wetted area and equidistant positions up to the wetted border and control at nearby dry soil (Fig. 1). Soil cores were extended to depths 0–30, 30–90 and 90– 180 mm, brought to the laboratory in sealed containers and wet-dry (105◦C) weighed for moisture content. Gravimetric moisture was expressed in volumetric terms through correc-tion with soil bulk density measured through the excavacorrec-tion
S1
S2
S3 Control
Fig. 1. (left) Overhead view of a field plot in this study at the end of the water inflow period with
TDR probe position marks and spikes with control marks used in the CRS-GSM procedure. (Right).
Soil cores along the main axis of the overland flow area are already extracted. Flow occurred in the
direction S1 to S3.
[image:4.595.310.545.64.257.2]1
Fig. 1. Left panel: overhead view of a field plot in this study at the
end of the water inflow period with TDR probe position marks and spikes with control marks used in the CRS-GSM procedure. Right panel: soil cores along the main axis of the overland flow area are already extracted. Flow occurred in the direction S1 to S3.
method (ISO 11272, 1998) at a nearby location. Maps of soil moisture in the wetted area at the end of the water inflow period were based on calibrated TDR estimates. Map val-ues were obtained by interpolation of 4–6 closest TDR es-timates, based on a search radius algorithm (Idrisi v. 14.02, Clark Labs, Worcester).
The texture of the extracted soil core samples was mea-sured with Lamotte’s 1067 texture kit (LaMotte Co., Chester-town) calibrated with replicate estimates obtained at two reference laboratories (National Patagonic Centre, National University of the South, Argentina) with the Robinson’s pro-tocol (Gee and Bauder, 1986). Parameters corresponding to residual volumetric moisture (θr), saturated moisture con-tent (θs), saturated hydraulic conductivity (Ksat) tortuosity-connectivity (L), and shape of the soil moisture-water head function (log10α, log10n) (Van Genuchten, 1980) corre-sponding to the obtained soil samples were estimated based on textural data through an ANN (Artificial Neural Net) pe-dotransfer algorithm (Rosetta v. 1.2, US Salinity Laboratory, Riverside) developed by Schaap and Leij (1998).
at regularly spaced time intervals (6–240 s). The spacing of time intervals within this range was selected according to the duration of the experiments. Time intervals were con-stant (Ti = 6 s) for those experiments of short duration with relatively higher water input rates (Plots 1 to 4). In longer experiments with low water input rates (Plots 5 to 10), time intervals (s) were selected according to Ti = (e(0.265×t s))×6, where ts is the cardinal number of the interval. This resulted in 10–18 images at short intervals during the early stages of fast overland flow and gradually longer intervals during later stages of slow overland flow. Images were then exported to an image processing application (Idrisi v. 14.02, Clark Labs, Worcester), ortho-rectified (RMSE: 7.59±1.3 mm, P <0.05, n= 10) and overlaid to their corresponding plot DEM and map of flow vector fields at the same resolution of the DEM. Flow vectors were estimated from the DEM. At any map node, flows were in the direction of the steepest de-scent and the magnitude of the arrow depended on the steep-ness of the descent. The terrain height change corresponding to the overland flow advance at each time interval was evalu-ated by averaging the altitude differences between all pixels along the borders of successive images.
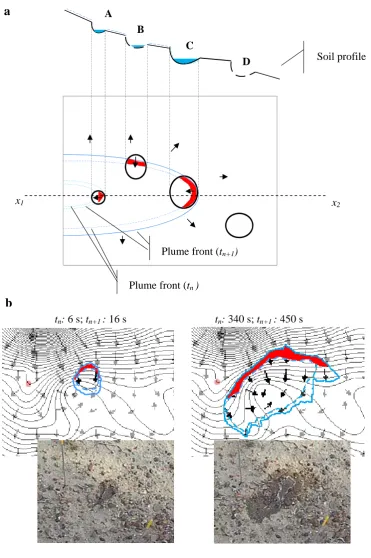
Depression storage (DS) (Antoine et al., 2011) areas were identified at each sampling interval (tn+1,tn) by measuring the areaA(t )n+1−A(t )n advanced by the overland plumes during the n-th interval, discriminating between: (1) area advanced down slope, and (2) area advanced in a counter-slope direction (CSA, Counter-Slope-Advance). CSA esti-mates were then weighed to correct for great advances at flow start and small advances at flow end:
w(t )= A(t )(n+1)−A(t )(n) A(t )(n+1)
, (1)
and DS was expressed as the accumulated CSA areas as a percent ofA(t )n+1(also see Fig. 2):
DS(t )% =
t=n P t=1
CSA(t )(n+1)×w(t )
×100 A(t )(n+1)
. (2)
3 Model
The changes observed at the overland flow areas and sub-surface soil water content at the plots were modelled with a physically based continuity model consisting of a set of non-linear ordinary differential and continuity equations with time variable parameters representing the changes in stor-ages of overland water (Eq. 3) and at the upper vadose zone (Eq. 4):
dQo
dt =W−IN(t )−O(t ) (3)
dQv
dt =IN(t ) (4)
CW=Qo+Qv. (5)
Qo: Water stored at the overland plume (mm3). Qv: Water stored at the upper vadose zone (mm3). W: Water inflow (mm3s−1).
IN(t): Total infiltration flow (mm3s−1). CW: Cumulative water inflow (mm3). O(t ): overland flow (mm3s−1).
Note that evaporation was disregarded due to the short du-ration of the field experiments. While W is time constant for each single plot experiment, INt−Ot can be expected to change with time depending on the effects of soil micro-relief and the physical properties of the surface soil. Further, the overland flow plume includes DS areas where water accu-mulates during the water inflow period, and other parts where the water inflow is not enough to maintain free water at the soil surface. Accordingly, IN(t) may be expected to result from the composition of flows under both saturated and un-saturated conditions. Saturated conditions occur at DS areas, while both saturated and/or unsaturated infiltration flows can occur at other areas depending on their water content: IN(t )=INsat(t )+INunsat(t ). (6) INsat(t ): transient, saturated infiltration flow at DS areas (mm3s−1).
INunsat(t ): transient, saturated and/or non-saturated infiltra-tion flow at non-DS areas (mm3s−1).
The INsatflow was modelled through a Darcy’s law con-cept, where infiltration was assumed to occur under saturated conditions depending on the gradient of water head between the soil surface and a point at the infiltrating wetting front (see Appendix A):
INsat=Ksat×
ψf×
θs −θ (t ) F
+1
×ADS (7)
F =zf(t )×(θs−θ (t )) . (8)
Ksat: saturated hydraulic conductivity (mm s−1). ψf(θ ): suction at the wetting front (mm).
θs,θ (t ): saturation and instantaneous volumetric water con-tent at the wetting front respectively (dimensionless). F: accumulated infiltration (mm).
ADS: DS area (mm2).
zf(t ): instantaneous water infiltration depth (mm).
In areas of the overland plume where no DS occurs, water infiltration was assumed to occur under unsaturated condi-tions (see Appendix A). Replacing in Eqs. (7) and (8) through corresponding terms:
INunsat(t )=Kh(θ (t ))×
ψf(θ (t ))×
θ (t )−θi F
+1
3298 M. J. Rossi and J. O. Ares: Infiltration and overland flow at desert condition
1
CSA areas
t
n:
340 s; t
n+1:
450 s
t
n:
6 s; t
n+1: 16 s
b
a
Plume front (t
n)
Plume front (t
n+1)
Soil profile
A
B
C
D
[image:6.595.113.485.57.616.2]x
1x
2Fig. 2. Estimation of local CSA (Counter-Slope-Advance) overland plume areas in this study. (a) An example of a soil profile atx1−x2
with micro-depressions (A–D). An overland plume advances down-slope from left to right up to depressionC, over totally ponded A–C and partially ponded B. Plume fronts circumscribe plume areasA(t )(n)andA(t )(n+1)(see Eqs. 1–2). Part (red areas) of the plume advances occur up-slope while the plumes fill depressions and finally overflow the depression boundaries. (b) Scene examples (lower insets) of plume advances at Plot #10 at two sampling intervals. Left panel:tn: 6 s,tn+1:16 s; right panel:tn: 340 s,tn+1: 450 s after water inflow start, overlaid
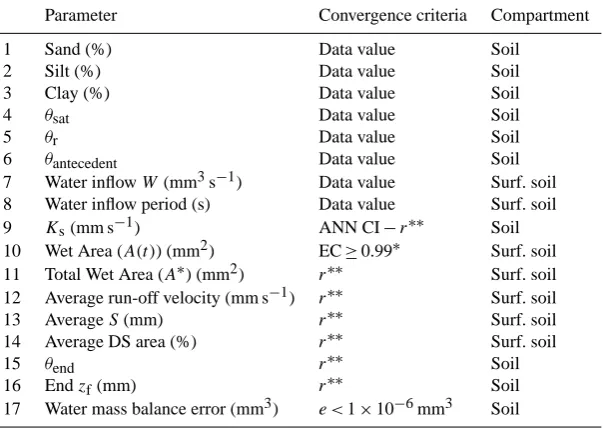
Table 1. Calibration parameters and variables of soil surface and upper vadose and convergence criteria used in tuning a model of the field
plot experiments. ANN CI: Confidence interval of the ANN estimation process;r: correlation coefficient, linear regression model-data values (xmodel=a+b×xdat a;H0:a= 0,b= 1) over all plot experiments. (A(t )): convergence evaluated at 10–15 times during the water inflow
period (∗∗: statistical significance atP <0.05).
Parameter Convergence criteria Compartment 1 Sand (%) Data value Soil
2 Silt (%) Data value Soil 3 Clay (%) Data value Soil
4 θsat Data value Soil
5 θr Data value Soil
6 θantecedent Data value Soil
7 Water inflowW(mm3s−1) Data value Surf. soil 8 Water inflow period (s) Data value Surf. soil 9 Ks(mm s−1) ANN CI−r∗∗ Soil
10 Wet Area (A(t )) (mm2) EC≥0.99∗ Surf. soil 11 Total Wet Area (A∗) (mm2) r∗∗ Surf. soil 12 Average run-off velocity (mm s−1) r∗∗ Surf. soil 13 AverageS(mm) r∗∗ Surf. soil 14 Average DS area (%) r∗∗ Surf. soil
15 θend r∗∗ Soil
16 Endzf(mm) r∗∗ Soil
17 Water mass balance error (mm3) e <1×10⁻⁶mm3 Soil
∗Nash and Sutfliffe (1970).
Kh(θ (t )): variable hydraulic conductivity (mm s−1). θi: Antecedent water content of the soil.
A(t ): Wet area of overland plume at timet(mm2).
Kh(θ (t ))andψf(θ (t ))were estimated through the solution (van Genuchten, 1980) of Mualem’s (Mualem, 1976) for-mulation to predict the relative hydraulic conductivity from knowledge of the soil-water retention curve.
The instantaneous overland water volume was estimated as
Qo =A(t )×d(t ). (10)
d(t): average depth of the overland flowing water volume at timet(mm).
Flowing in thex-yspace, with varying velocity depending on the local altitude gradient along its border, such that d(t) is inversely related to the slope of the underlying soil surface. This relation would follow Darcy’s general form of frictional law (Dingman, 2007; M¨ugler et al., 2011):
d(t )=
W
C 2
/S(t, t +dt ). (11)
C: Proportionality constant.
S(t, t+dt ): Average terrain height drop around the overland plume during the intervalt, t+dt(mm).
Where the velocity term is replaced in this case with the water inflow rateW, andS(t, t−dt )was obtained from suc-cessive video images of the overland flow overlaid on the plot DEMs. The termC was found through inverse modelling of
the continuity Eqs. (3)–(5), solved through numerical inte-gration with a fourth-order Runge-Kutta approximation, at solution time intervals 0.06≤1t≤0.3 s, and an accepted mass balance error thresholde≤1×10⁻⁶mm3.
Modelling parameters and variables: calibration and validation
Table 1 summarizes the parameters and variables used to ibrate the model of the field plot experiments. Model cal-ibration was achieved through trial-error on parameter C and simultaneous calibration on parameters 9–16 (Table 1). In order to restrict the possibility of compensatory artifacts during the calibration process, the quality of the calibration procedure was evaluated through simultaneous convergence of all measured values describing the experimental setting, the morphology of the plot surface soil and the textural-hydrological properties of the upper vadose zone. The cri-teria in the case of parameters 1–8 was strict convergence to measured data values. Convergence of parameter 9 (Ks) was pursued within the confidence interval of the ANN es-timation process as reported in Shaap and Leij (1998). Vari-able 10 (A(t )) was required to converge to time-serial data as estimated through a Nash-Sutcliffe’s efficiency coefficient (EC≥0.99) (Nash and Sutcliffe, 1970). Values of 11–16 were required to converge to:
6i=1,n(xi −xdata)2=min (12)
3300 M. J. Rossi and J. O. Ares: Infiltration and overland flow at desert condition
for convergence to data at the inter-plot scale such that their correlation with measured values would be significant at P <0.01 over the set of 10 plots studied. Variables 12–14 are average values of the corresponding variable over the simu-lation time.
Several procedures were used for model validation. Unit consistency and ranges ofKs, Kh(θ (t )), and ψf(θ (t ))were independently checked through comparison with estimates obtained with CHEMFLO-2000 (Nofziger and Wu, 2003), an application that solves Richards equations in one-dimension to simulate transient water (and chemical) transport in soils.
In order to detect eventual spurious correlation values (Ta-ble 2, column “r”) resulting from outlier data points, confi-dence intervals (P <0.05) of the correlation coefficientrof measured-modelled values 9–16 were built by bootstrapping randomly selected paired 5-plot sets.zfandθend values ob-served in the field were additionally tested for consistency with CHEMFLO-2000 estimates.
Additionally, the following variables were defined based on model outputs:
ς∗ = 6t=1,n(O(t )/W (t )
/n . (13)
ς∗: mean run-off coefficient
where ς∗ is a mean (dimensionless) run-off estimate, of ς=O(t )/W (t ), including transient depression storage.
d∗ = 6t=1,nd(t )/n . (14)
d∗: mean d(t) (mm) v∗= A∗0.5
tend. (15)
v∗:mean overland flow velocity (mm s−1).
Several parameters of the experimental plots which are usually estimated in overland flow studies (Abrahams et al., 1990; Parsons et al., 1994; Dunkerley, 2001) were also com-puted to ease comparisons of conditions in this study with reported data. As long as basic assumptions underlying their rationale are granted, the Froude number (F) relates the ve-locity of the overland laminar flow to the expected veve-locity of a gravitational wave, or the ratio of the laminar flow in-ertia to gravitational forces. Analogously, the dimensionless Reynolds number (Re) gives a measure of the ratio of iner-tial forces to viscous forces for given flow conditions. High Reynolds numbers characterize turbulent flow.
4 Results
Table 2 summarizes results obtained from the plot experi-ments and the calibration of their models. The upper va-dose zone (zf≤55 mm) of all plots showed various combi-nations of sand, silt and clay fractions within the boundaries of Sandy-Loam and Loamy-Sand USDA textural classes (Pa-rameters 1–3) as well as their basic hydraulic properties (pa-rameters 4–5, 9). The values of parameter 6 corresponded to
0.00
0.30 0.25 0.20 0.15 0.10 0.05
0.35
Plot 5
100 mm
100
mm
Plot 6
Plot 8 Plot 10
Fig. 3. Upper soil moisture (θend , 0-30mm ) maps of the overland plumes based on TDR probing (red dots) at the end of the water inflow periods at four plots in this study. Yellow circles indicate the water inflow areas. Maps overlay rectified plot photos and corresponding level (mm) contour lines.
4
Fig. 3. Upper soil moisture (θend, 0–30 mm) maps of the overland
plumes based on TDR probing (black dots) at the end of the water inflow periods at four plots in this study. Yellow circles indicate the water inflow areas. Maps overlay rectified plot photos and corre-sponding level (mm) contour lines.
very dry conditions of the upper soil due to the fact that all the plot experiments were performed during the dry season of the local climate regime. The range of water input flows (param-eter 7) produced groups of relatively fast and slow overland flow and water infiltration conditions. Calibration values of Ksatand parameters 11–16 were significantly correlated with data values.H0:a= 0,b= 1 was rejected in the case of pa-rameter 16 (zf,model=−8.41 + 0.955×zf,data,P= 1.42E-06). This is to be expected due to the fact that zf,data were es-timated from soil cores along the main overland flow axes, whilezf,model expresses the average infiltration depth corre-sponding to the whole wet area. The modeled time series of overland flow areasA(t )(variable 10) were in all cases sig-nificantly correlated with the observed areas as indicated by the Nash-Sutcliffe’s EC.
Figure 3 shows examples of maps of the distribution of upper vadose zone (0–30 mm) moisture (θend,0-30mm) at four plots in this study as obtained with the TDR probe at the end of the water inflow period. Depending on the position of the water inflow and the local microtopography, some areas contain moisture at near saturation levels while various levels of unsaturated conditions prevailed at other areas.
3302 M. J. Rossi and J. O. Ares: Infiltration and overland flow at desert condition
Table 3. Froude (F), Reynolds (Re) numbers andC,d∗parameter values and slopes (s, %) of the field plot experiments.
P1 P2 P3 P4 P5 P6 P7 P8 P9 P10
1 Fa 0.096 0.006 0.033 0.051 0.005 0.001 0.012 0.008 0.005 0.005 2 Reb 8.39 101.77 45.76 16.22 0.19 3.71 0.33 0.84 0.68 0.18 3 C 9.50E+04 4.80E+03 7.60E+03 1.50E+04 3.50E+03 8.60E+02 7.00E+03 4.6E+03 3.20E+03 5.0E+03 4 d∗ 0.34 11.40 2.16 1.09 0.21 3.70 0.16 0.28 0.45 0.19 5 s 1.1 14.0 2.9 7.2 7.8 1.7 2.2 5.5 11.0 3.0
aF=v∗/(g×d∗)0.5;g= 9806.65 mm s−12 bRe = 4×v∗×d∗/v;v= 0.9 mm2s−1
-60 -40 -20 0
0 0.2 0.4 0.6
(v/v)
De
p
th
(
zf
,
mm
)
Plot 3
-120 -80 -40 0
0 0.2 0.4 0.6
De
p
th
(
cm
)
Plot 6
-60 -40 -20 0
0 0.2 0.4 0.6
(v/v)
D
ept
h (
cm
)
Plot 8
θend (v/v)
Depth
(
z
f,
[image:10.595.313.545.209.606.2]mm)
Fig. 4.
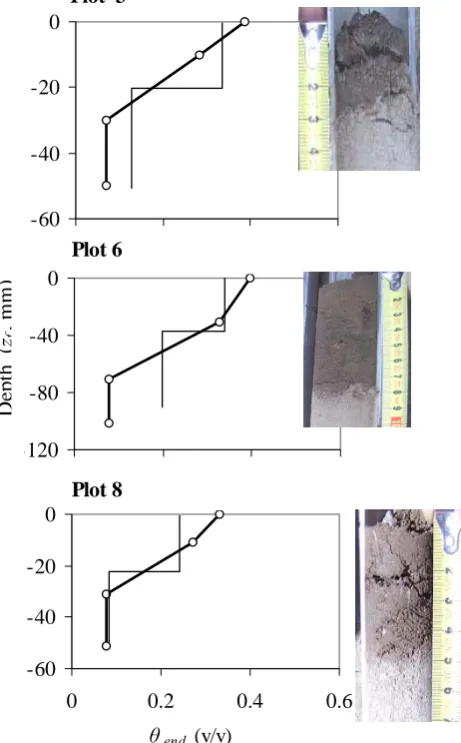
Comparison of
z
f(photo insets) and
θ
endfield soil core data (circle-lines) used as
input the model in this study and estimates through CHEMFLO-2000 (lines). Soil core
photos obtained immediately after ceasing water inflow are also shown.
[image:10.595.52.283.214.586.2]5
Fig. 4. Comparison ofzf(photo insets) andθendfield soil core data(circle-lines) used as an input to the model in this study and esti-mates through CHEMFLO-2000 (lines). Soil core photos obtained immediately after ceasing water inflow are also shown.
0 40 80 120
0 20 40 60 80
Time (s)
T
o
ta
l A
re
a
(mm
2 x 10 3 )
0 20 40 60
DS
(
m
m
2 x 10 3 )
160 80
Data Model Data Model Plot 1
0 40 80 120 160
0 20 40 60 80
Time (s)
T
o
ta
l A
rea
(
m
m
2 x 10 3 )
0 5 10 15 20
DS
(
m
m
2 x 1
0
3 )
Data Model Data Model
Plot 4
0 30 60 90 120
0 200 400 600 800
Time (s)
T
o
ta
l A
re
a
(mm
2 x 10 3)
0 20 40 60 80
DS
(
m
m
2 x 10 3 )
Data Model Data Model
Plot 7
Fig. 5. The progression of overland flow A(t) and DS areas during the water inflow
periods in three field plots as estimated from rectified video imagery and the model
used in this study.
6
Fig. 5. The progression of overland flowA(t )and DS areas dur-ing the water inflow periods in three field plots as estimated from rectified video imagery and the model used in this study.
7
ς
Plot 7
Plot 9
DS (%)
ς
ς
Plot 3
ς
Plot 1
Plot 6
Plot 8
Plot 10
DS (%) Plot 4
Plot 2
Plot 5
ς
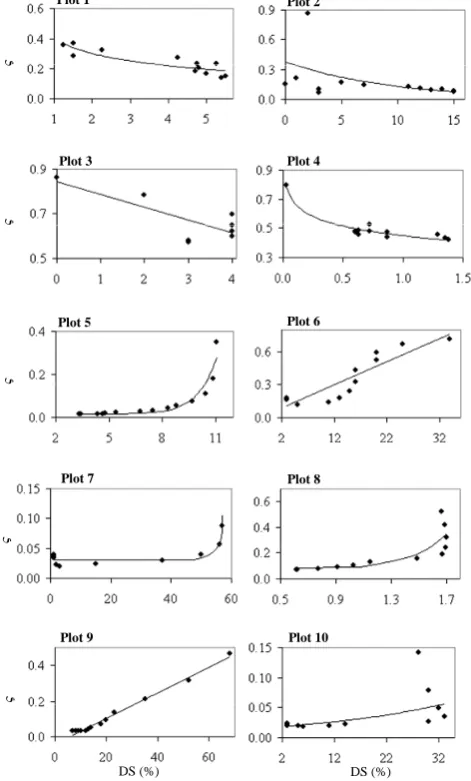
Fig. 6. Intra-plot time-serial relations between the estimated DS and the runoff (ς)
coefficient.
Fig. 6. Intra-plot time-serial relations between the estimated DS and
the runoff (ζ) coefficient.
shows A(t )values and point and average estimates of DS areas of several plots as measured and estimated with the model of Eqs. (3)–(5).
No significant correlations were found between the extent of DS areas and other variables at the inter-plot scale. At intra-plot scale (time-serial values corresponding to sampling time intervals at each experimental plot) run-off (ς) values were variously related to DS (Fig. 6) depending on the water inflow. At plots 1–4 (high inflow rate), decreasing relations were observed. Run-off increased with DS estimates at most plots under low water inflow.
Table 3 summarizes theoretical hydrodynamic overland flow parameters of the plot experiments and Fig. 7 shows the relationC–F.
y = 2509.7e38.22x
R2 = 0.88
0.0E+00 3.0E+04 6.0E+04 9.0E+04
0.00 0.03 0.06 0.09 0.12
F
[image:11.595.327.527.60.183.2] [image:11.595.48.284.67.458.2]C
Fig. 7. Inter-plot statistical relations between parameters C-F .
8
Fig. 7. Inter-plot statistical relations between parametersC–F.
5 Discussion
In plot experiments where natural or simulated rain occurs over the plot area the kinetic energy of the rainfall may modify the overland flow momentum and velocity. Measured ranges of rainfall kinetic energy all over the world under var-ious methods indicate a range of 12–22 J m−2mm−1 for a storm of 10 mm h−1 (Rosewell, 1986), which is a common event in semi-desert areas under tropical regime. Aside from potential effects on soil microtopography (erosion) these en-ergy inputs can reasonably be expected to contribute to the overland flow momentum balance.
Flume plot experiments (Esteves et al., 2000; Dunkerley, 2004) may introduce various kinds of artifacts. To avoid wall effects, the soil relief must be manipulated in order to deliver the overland flow to the central part of the flume. In labora-tory flume experiments, the natural soil must be transported and necessary modifications in soil structure must follow. Overland flow studies using technical materials to simulate the soil surface might not reproduce field conditions.
Experiments on overland flow involving the measurement of run-off through an outlet (a need in computing water mass balances and runoff coefficients) may require modifications of the soil microtopography to deliver run-off to the outlet. Interflow measurement (Wang et al., 2011) might require so-phisticated outlet configurations.
Some of the above mentioned potential limitations of plot studies on overland flow were addressed through the experi-mental setup in this study. Estimates of overland flow depth, velocity and friction were obtained without manipulation of the microtopography of field plots; overland-infiltration flows were considered simultaneously and the effect of de-pression storage areas was estimated. Inertial forces acting on the overland flows were small as estimated through F numbers (Table 3). Flows were predominantly laminar (see Re numbers, Table 3).
3304 M. J. Rossi and J. O. Ares: Infiltration and overland flow at desert condition
of sub-surface soil heterogeneity on infiltration flows. In this study, attention is given to surface soil heterogeneity in the x-y plane and it is hypothesized that infiltration must occur under saturated conditions at DS areas, while both saturated-unsaturated infiltration could occur at non-DS areas. This interpretation is consistent with observations on composite overland flow by Abrahams et al. (1990) on run-off plots in arid southern Arizona (USA), where flow occurred as shal-low sheets of water with threads of deeper, faster fshal-low diverg-ing and convergdiverg-ing around surface protuberances, rocks, and vegetation.
The results presented in Fig. 6 indicate that the effect of DS areas on the overland flow (as estimated through the run-off coefficient) is more complex than expected from consid-ering those as areas of passive transient water storage. The effect of DS areas may result from various transient balances of inflow, overland flow and infiltration. This view is sup-ported by the results of the time serial relations DS-ς which are predominantly increasing at plots with low rates of wa-ter inflow and decreasing at plots with high wawa-ter inflow. In explaining these trends, it should be considered that af-ter the initiation of a waaf-ter inflow exceeding the infiltration rate (plots 1–4), DS areas become filled before the underly-ing top soil reaches saturation. This is reflected in shallow endzfvalues (23.7±3.9 mm, see Table 2, #16). The DS ef-fect on overland flow approaches that of a passive storage and results in decreasing DS-run-off relations (Fig. 6). In the cases of plots receiving low inflows during longer periods (Plots P5–P10), the water inflow is nearly balanced by the saturated infiltration at DS areas. In these plots deeperzf val-ues (45±10.1 mm, see Table 2, #16) were observed. Once the upper soil profile under DS areas becomes saturated, in-filtration in DS areas diminishes reaching a low, steady rate (Mao et al., 2008) and the run-off flow increases with in-creasing DS.
Equations (11) and (14) allow the estimation of the av-erage overland flow depthd∗ once the termC is estimated through inverse modelling of the continuity Eqs. (3)–(5). The termCis similar to the Chezy frictional constant, in that the flow velocity (v) is replaced by the water inflow rate (W) in Eq. (11). However,C is indeed a friction descriptor as con-firmed through its high correlation with the Froude number (Table 3, Fig. 7).
Values d(t)−d∗ (Table 3) obtained in this study are in a similar scale as those reported by Esteves et al. (2000) and instrumentally measured by Dunkerley (2001) in laboratory conditions and Smith et al. (2011) in field conditions.
6 Conclusions
This study gives the following findings about the effects of depression storage and infiltration on overland flow charac-teristics: (1) overland flow properties (velocity, depth, fric-tion) as well as infiltration-overland flow mass balances are
consistently modelled by considering variable infiltration rates corresponding to depression storage and/or non-ponded areas. (2) The effect of DS on run-off varies depending on the local soil balance of water inflow and infiltration, the latter modified by the local microtopography.
A protocol of experiments in undisturbed field conditions and coupled time-distributed modelling to 1–2 above is de-scribed. A biogeography-based analysis of the experimental site is given to ease comparisons with experiments on over-land flows in other areas of the world.
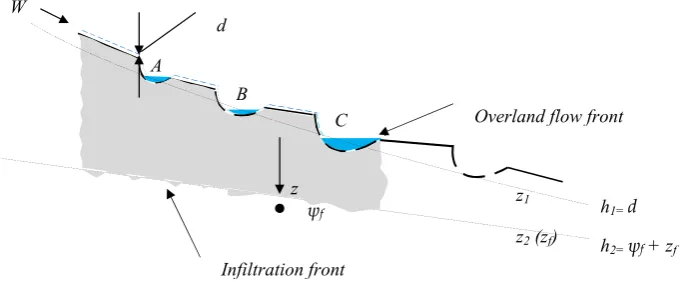
Appendix A
Saturated-unsaturated infiltration
Consider a soil profile at an experimental plot surface (Fig. A1) receiving a continuous water inflow (W). A water front at the soil surface limits a soil area where simultaneous saturated infiltration occurs at ponded areas, and un-saturated infiltration occurs in non-ponded sectors.
Saturated infiltration can be estimated from Darcy’s equation:
q=Ksat
dh
dz =Ksat h2−h1
z2−z1
=Ksat
(ψf+zf)−(d+0)
zf−0
=Ksat
ψf+zf−d
zf , (A1)
where
q= infiltration rate at saturated condition (mm s−1), Ksat= saturated hydraulic conductivity (mm s−1), ψf= suction at wetting front (mm),
d= the depth of overland flow (mm).
A cumulative depth of infiltrationF (mm) is defined:
F =zf(θs−θi) , (A2)
where
θi= initial volumetric moisture content (dimensionless) and θs= saturated volumetric moisture content (dimensionless), rearranging Eq. (A2) and substituting into Darcy’s equation: q = dF
dt =Ksat
ψf+ θs−θiF−d F θs−θi
=Ksat
ψf+ F
θs −θi −d
θ
s−θi
F . (A3)
Assumingdis small relative to the other terms, the previous equation simplifies to
INsat= dF
dt =Ksat
ψf θs −θi
F +1
, (A4)
M. J. Rossi and J. O. Ares: Infiltration and overland flow at desert condition 3305
19 SATURATED-UNSATURATED INFILTRATION
Consider a soil profile at an experimental plot surface (Figure I-1) receiving a
continuous water inflow (W). A water front at the soil surface limits a soil area where
simultaneous saturated infiltration occurs at ponded areas, and un-saturated infiltration 5
occurs in non-ponded sectors.
10
15
Fig. I-1. Schematic representationof parameters involved in considering infiltration up
to depth zfof a water inflow W on sloping soil with partially ponded depressed areas
(A-C) (Also see main text, Figure 2).
Saturated infiltration can be estimated from Darcy's equation: 20
(
)
(
)
f f f sat f
f f sat sat
sat
z d z K
z d z K
z z
h h K dz dh K
q = + −
− + − + =
− − =
= ψ ψ
0 0
1 2
1
2 (I-1)
in which,
q = infiltration rate at saturated condition (mm/s),
Ksat = saturated hydraulic conductivity (mm/s),
25
ψf = suction at wetting front (mm),
d = the depth of overland flow (mm).
d
z2 (zf) h
2= ψf + zf
h1= d
z z
1
ψf
Infiltration front
Overland flow front W
B
[image:13.595.127.471.64.205.2]C A
Fig. A1. Schematic representation of parameters involved in considering infiltration up to depthzfof a water inflowWon sloping soil with
partially ponded depressed areas (A–C) (also see main text, Fig. 2).
q =Khdh dz =Kh
h2−h1 z2−z1
=Kh(ψf+zf)−(d+0) zf−0 =Khψf+zf−d
zf
, (A5)
whereKh(θ )andψf(θ )are the variable hydraulic conductiv-ity and the variable suction, respectively.
Substituting in Eq. (A3) and assumingd is small in rela-tion to the other water potential terms:
INunsat = dF dt =Kh
ψfθunsat−θi
F +1
, (A6)
whereθunsatis the unsaturated water content of the soil.
Acknowledgements. This study was supported by grants of
Agencia Nacional de Investigaciones Cient´ıficas y T´ecnicas (AN-PCyT) PICT 07-1738 and Consejo Nacional de Investigaciones Cient´ıficas y T´ecnicas (CONICET) PIP 1142 0080 1002 01 to J. O. Ares. M. J. Rossi was a doctoral fellow from ANPCyT during 2009–2012. An anonymous reviewer, S. Thompson and C. Harman stimulated discussion on earlier versions of this paper.
Edited by: S. Thompson
References
Abraham, E., del Valle, H., Roig, F., Torres, L., Ares, J., Coronatp, F., and Godagnone, R.: Overview of the geography of the Monte desert of Argentina, J. Arid Environ., 73, 144–153, 2009. Abrahams, A. D., Parsons, A. J., and Luk, S.: Field experiments
on the resistance to overland flow on desert hillslopes, Ero-sion, Transport and Deposition Processes, in: Proceedings of the Jerusalem Workshop, March–April 1990, IAHS Publ. no. 189, Jerusalem, 1990.
Aguiar, M. R. and Sala, O. E.: Patch structure, dynamics and im-plications for the functioning of arid ecosystems, Trends Ecol. Evol., 14, 273–277, 1999.
Antoine, M., Chalon, C., Darboux, F., Javaux, M., and Bielders, C.: Estimating changes in effective values of surface detention, depression storage and friction factor at the interril scale, using a cheap and fast method to mold the soil surface microtopography, Catena, 91, 10–20, 2011.
Ares, J. O., Beskow, M., Bertiller, M. B., Rostagno, C. M., Iris-arri, M., Anchorena, J., Deffos´e, G., and Merino, C.: Structural and dynamic characteristic of overgrazed grassland of northern Patagonia, Argentina, in: Managed Grassland, Breymeyer, A., Elsevier Science, Amsterdam, 149–175, 1990.
Ares, J. O., del Valle, H. F., and Bisigato, A.: Detection of process-related changes in plant patterns at extended spatial scales dur-ing early dryland desertification, Global Change Biol., 9, 1643– 1659, 2003.
Bartley, R., Roth, C., Ludwig, J., McJannet, D., Liedloff, A., Cor-field, J., Hawdon, A., and Abbott, B.: Runoff and erosion from Australia’s tropical semi-arid rangelands: influence of ground cover for differing space and time scales, Hydrol. Process., 20, 3317–3333, 2006.
Biemelt, D., Schappa, A., Kleeberg, A., and Gr¨unewald, U.: Over-land flow, erosion, and related phosphorus and iron fluxes at plot scale: a case study from a non-vegetated lignite mining dump in Lusatia, Geoderma, 129, 4–18, 2005.
Borgogno, F., D’Odorico, P., Laio, F., and Ridolfi, L.: Mathemati-cal models of vegetation pattern formation in ecohydrology, Rev. Geophys., 47, 1–36, 2009.
Bromley, J., Brouwer, J., Barker, A. P., Gaze, S. R., and Valentin, C.: The role of surface water redistribution in an area of patterned vegetation in a semi-arid environment, south-west Niger, J. Hy-drol., 198, 1–29, 1997.
Cammeraat, L. H.: A review of two strongly contrasting geomor-phological systems within the context of scale, Earth Surf. Proc. Land., 27, 1201–1222, 2002.
Carrera, A., Ares, J., Labraga, J., Thurner, S., and Bertiller, M.: Sce-narios of Future Climate and Land-Management Effects on Car-bon Stocks in Northern Patagonian Shrublands, Enviro. Manage., 40, 944–957, 2007.
3306 M. J. Rossi and J. O. Ares: Infiltration and overland flow at desert condition
Cerd´a, A., Ib´a˜nez, S., and Calvo, A.: Design and operation of a small and portable rainfall simulator for rugged terrain, Soil Technol., 11, 163–170, 1997.
Darboux, F., Davy, Ph., Gascuel-Odoux, C., and Huang, C.: Evolu-tion of soil surface roughness and flowpath connectivity in over-land flow experiments, Catena, 46, 125–139, 2001.
del Valle, H. F.: Patagonian soils: a regional synthesis, Ecolog´ıa Austral, 8, 103–123, 1998.
Descroix, L., Viramontes, D., Estrada, J., Gonzalez Barrios, J. L., and Asseline, J.: Investigating the spatial and temporal bound-aries of Hortonian and Hewlettian runoff in Northern Mexico, J. Hydrol., 346, 144–158, 2007.
Dingman, S. L.: Analytical derivation of at-a-station hydraulic– geometry relations, J. Hydrol., 334, 17–27, 2007.
Dunkerley, D. L.: Estimating the mean speed of laminar overland flow using dye-injection-Uncertainty on rough surfaces, Earth Surf. Proc. Land., 26, 363–374, 2001.
Dunkerley, D. L.: Infiltration rates and soil moisture in a groved mulga community near Alice Springs, arid central Australia: ev-idence for complex internal rainwater redistribution in a runoff– runon landscape, J. Arid Environ., 51, 199–219, 2002.
Dunkerley, D. L.: Determining friction coefficients for interrill flows. The significance of flow filaments for interrill flows, Earth Surf. Proc. Land., 28, 475–491, 2003.
Dunkerley, D. L.: Flow threads in surface run-off: implications for the assessment of flow properties and friction coefficients in soil erosion and hydraulics investigations, Earth Surf. Proc. Land., 29, 1011–1026, 2004.
Esteves, M., Faucher, X., Galle, S., and Vauclin, M.: Overland flow and infiltration modelling for small plots during unsteady rain: numerical results versus observed values, J. Hydrol., 228, 265– 282, 2000.
Ewen, J.: Hydrograph matching method for measuring model per-formance, J. Hydrol., 408, 178–187, 2011.
Gee, G. W. and Bauder, J. W.: Particle-size analysis, in: Meth-ods of soil analysis, Part 1. Physical and mineralogical methMeth-ods, 2nd Edn., edited by: Klute, A., Agronomy Monograph No. 9, ASA-SSSA, Madison, 383–411, 1986.
Gim´enez, R., Planchon, O., Silvera, N., and Govers, G.: Longitu-dinal velocity patterns and bed morphology interaction in a rill, Earth Surf. Proc. Land., 29, 105–114, 2004.
Govers, G., Takken, I., and Helming, K.: Soil roughness and over-land flow, Agronomie, 20, 131–146, 2000.
Gowdish, L. and Mu˜noz-C´arpena, R.: An Improved Green–Ampt Infiltration and Redistribution Method for Uneven Multistorm Series, Vadose Zone J., 8, 470–479, 2009.
Green, W. H. and Ampt, G. A.: Studies on soil physics: 1. the flow of air and water through the soils, J. Agr. Sci., 4, 1–24, 1911. Grierson, I. T. and Oades, J. M.: A rainfall simulator for field studies
of run-off and soil erosion, J. Agr. Eng. Res., 22, 37–44, 1977. Hansen, B.: Estimation of surface runoff and water-covered area
during filling of surface micro relief depressions, Hydrol. Pro-cess., 14, 1235–1243, 2000.
Haylock, M. R., Peterson, T., Abreu de Sousa, J. R., Alves, L. M., Ambrizzi, T., Anunciac¸˜ao, Y. M. T., Baez, J., Barbosa de Brito, J. I., Barros, V. R., Berlato, M. A., Bidegain, M., Coronel, G., Corradi, V., Garcia, V. J., Grimm, A. M., Jaildo dos Anjos, R., Karoly, D., Marengo, J. A., Marino, M. B., Meira, P. R., Miranda, G. C., Molion, L., Moncunill, D. F., Nechet, D., Ontaneda, G.,
Quintana, J., Ramirez, E., Rebello, E., Rusticucci, M., Santos, J. L., Trebejo, I., and Vincent, L.: Trends in total and extreme South American rainfall in 1960–2000 and links with sea surface temperature, J. Climate, 19, 1490–1512, 2006.
Hessel, R., Jetten, V., and Guanghui, Z.: Estimating Manning’s n for steep slopes, Catena, 54, 77–91, 2003.
K¨ohne, J. M., K¨ohne, S., and Simunek, J.: A review of model appli-cations for structured soils: a) water flow and tracer transport, J. Contam. Hydrol., 104, 4–35, 2009.
Latron, J. and Gallart, F.: Seasonal dynamics of runoff-contributing areas in a small Mediterranean research catchment (Vallcebre, Eastern Pyrenees), J. Hydrol., 335, 194–206, 2007.
Legout, C., Darboux, F., N´ed´elec, Y., Hauet, A., Esteves, M., Re-naux, B., Denis, H., and Cordier, S.: High spatial resolution map-ping of surface velocities and depths for shallow overland flow, Earth Surf. Proc. Land., 37, 984–993, 2012.
Le´on, R. J. C., Bran, D., Collantes, M., Paruelo, J. M., and Soriano, A.: Grandes unidades de vegetaci´on de la Patagonia extraandina, Ecolog´ıa Austral, 8, 125–144, 1998.
Li, G.: Preliminary study of the interference of surface objects and rainfall in overland flow resistance, Catena, 78, 154–158, 2009. Li, X., Contreras, S., Sol´e-Benet, A., Cant´on, Y., Domingo, F.,
L´azaro, R., Lin, H., Van Wesemael, B., and Puigdef´abregas, J.: Controls of infiltration–runoff processes in Mediterranean karst rangelands in SE Spain, Catena, 86, 98–109, 2011.
Lipsius, K. and Mooney, S. J.: Using image analysis of tracer stain-ing to examine the infiltration patterns in a water repellent con-taminated sandy soil, Geoderma, 136, 865–875, 2006.
Mao, L. L., Lei, T. W., Li, X., Liu, H., Huang, X. F., and Zhang, Y. N.: A linear source method for soil infiltrability measurement and model representations, J. Hydrol., 353, 49–58, 2008. Mares, M. A., Morello, J., and Goldstein, G.: Semi-arid shrublands
of the world, in: Hot deserts and arid shrublands, Ecosystems of the world, chapter 10, edited by: Evenari, M., Noy-Meir, I., and Goodall, D., Elsevier, Amsterdam, The Netherlands, 203–237, 1985.
Mengistu, B., Defersha, A., and Melesse, M.: Field-scale investiga-tion of the effect of land use on sediment yield and runoff us-ing runoff plot data and models in the Mara River basin, Kenya, Catena, 89, 54–64, 2012.
Morello, J. H.: Perfil Ecol´ogico de Sud Am´erica, Instituto de Coop-eraci´on Iberoamericana, Madrid, 93 pp., 1984.
Mualem, Y.: A new model for predicting the hydraulic conductivity of unsaturated porous media, Water Resour. Res., 12, 593–622, 1976.
M¨ugler, C., Planchon, O., Patin, J., Weill, S., Silvera, N., Richard, P., and Mouche, E.: Comparison of roughness models to simulate overland flow and tracer transport experiments under simulated rainfall at plot scale, J. Hydrol., 402, 25-40, 2011.
Nash, J. E. and Sutcliffe, J. V.: River flow forecasting through con-ceptual models, 1, a discussion of principles, J. Hydrol., 10, 282– 290, 1970.
Parenti, L. R. and Ebach, M. C.: Comparative Biogeography, Univ. of California Press, Princeton, 312 pp., 2009.
Parsons, A. J. and Wainwright, J.: Depth distribution of interrill overland flow and the formation of rills, Hydrol. Process., 20, 1511–1523, 2006.
Parsons, A. J., Abrahams, A. D., and Wainwright, J.: On determin-ing resistance to interrill overland flow, Water Resour. Res., 30, 3515–3521, 1994.
Planchon, O. and Darboux, F.: A fast, simple and versatile algorithm to fill the depressions of digital elevation models, Catena, 46, 159–176, 2002.
Prohaska, F.: The climate of Argentina, Paraguay and Uruguay, in: Climates of Central and South America, Chapter 2, edited by: Schverdtfeger, W., Elsevier, Amsterdam, 532 pp., 1976. Radcliffe, D. R. and Simunek, J.: Soil Physics with HYDRUS:
Modeling and Applications, CRC Press, New York, 2010. Reaney, S. M.: The use of agent based modelling techniques in
hy-drology: determining the spatial and temporal origin of channel flow in semi-arid catchments, Earth Surf. Proc. Land., 33, 317– 327, 2008.
Rosewell, C. J.: Rainfall kinetic energy in Eastern Australia, J. Clim. Appl. Meteorol., 25, 1695–1701, 1986.
Rossi, M. J. and Ares, J. O.: Close range stereo-photogrammetry and video imagery analyses in soil eco-hydrology modelling, Photogramm. Record, 27, 111–126, 2012.
Schaap, M. G. and Leij, F. J.: Database Related Accuracy and Uncertainty of Pedotransfer Functions, Soil Sci., 163, 765–779, 1998.
Schr¨oder, A.: WEPP, EUROSEM, E-2D results of application at the plot scale, in: Soil Erosion-Application of Physically Based Models, edited by: Schmidt, J., Springer Verlag, Berlin, Heidel-berg, New York, 199–250, 2000.
Smith, M. W., Cox, N. J., and Bracken, L. J.: Applying flow resis-tance equations to overland flows, Prog. Phys. Geogr., 31, 363– 387, 2007.
Smith, M. W., Cox, N. J., and Bracken, L. J. Modeling depth distri-bution of overland flows, Geomorphology, 125, 402–413, 2011. Soriano, A.: La vegetaci´on del Chubut, Revista Argentina de
Agronom´ıa, 17, 30–66, 1950.
Tarboton, D. G. and Ames, D. P.: Advances in the mapping of flow networks from digital elevation data, World Water and En-vironmental Resources Congress, 20–24 May, ASCE, Orlando, Florida, 2001.
Tatard, L., Planchon, O., Wainwright, G., Nord, J., Favis-Mortlock, D., Silvera, N., Ribolzi, O., Esteves, M., and Huang C.H.: Mea-surement and modelling of high-resolution flow-velocity data un-der simulated rainfall on a low-slope sandy soil, J. Hydrol., 348, 1–12, 2008.
Thompson, S., Katul, G., Konings, A., and Ridolfi, L.: Unsteady overland flow on flat surfaces induced by spatial permeability contrasts, Adv. Water Resour., 34, 1049–1058, 2011.
van Genuchten, M. Th.: A closed form equation for predicting the hydraulic conductivity of unsaturated soils, Soil Sci. Soc. Am. J., 44, 892–898, 1980.
van Schaik, N. L.: Spatial variability of infiltration patterns related to site characteristics in a semi-arid watershed, Catena, 78, 36– 47, 2009.
Wang, J., Yang, H., Li, L., Gourley, J., Sadiq, K., Yilmaz, K., Adler, R., Policelli, F., Habib, S., Irwin, D., Limaye, A., Korme, T., and Okello, L.: The coupled routing and excess storage distributed hydrological model, Hydrolog. Sci. J., 56, 84–98, 2011. Weill, S., Mazzia, A., Putti, M., and Paniconi, C.: Coupling