A Monthly Double-Blind Peer Reviewed Refereed Open Access International e-Journal - Included in the International Serial Directories.
GE-International Journal of Engineering Research (GE-IJER) ISSN: (2321-1717) 37 | P a g e
GE-International Journal of Engineering Research
Vol. 3, Issue 12, Dec 2015 IF- 4.007 ISSN: (2321-1717)
© Associated Asia Research Foundation (AARF) Publication
Website: www.aarf.asia Email : editor@aarf.asia , editoraarf@gmail.com
ENERGY PERFORMANCE ASSESSMENT OF STEAM DISTRIBUTION
SYSTEM AND HEAT RECOVERY SYSTEM IN FLUID CATALYTIC
CRACKING UNIT OF AN OIL REFINERY
Chirag Rabadia
Mechanical Engineering Department, Marwadi Education Foundation, Rajkot, India.
ABSTRACT
This paper presents energy performance assessment of steam distribution system and heat
recovery system in Fluid catalytic cracking unit of an oil refinery to save thermal energy and
cost at the end in terms of money. The leakages and failure of steam traps are the main
problems noted in steam distribution system. It has been found that there are three types of
steams, high pressure steam, medium pressure steam and low pressure steam, used
depending on their pressure and around 602.95, 1199.87 and 508.15 MT/annum of steam
loss have been found. In addition, there is a great loss of exhaust gases in CO-oxidizer at
high temperature has been observed and therefore, Rs.1323 lacks/annum can be saved with
payback period of around 12 months by installing gas turbine in CO gas line.
KEYWORDS– Energy audit, Energy conservation and saving, Energy performance assessment, Heat recovery, Insulation system, Steam system
NOMENCLATURE
∆T Temperature difference, oC
CO Carbon Monoxide
Cp Specific heat, k Cal/kg oC
FCCU Fluid Catalytic Cracking Unit
FSA Flash Steam Available
A Monthly Double-Blind Peer Reviewed Refereed Open Access International e-Journal - Included in the International Serial Directories.
GE-International Journal of Engineering Research (GE-IJER) ISSN: (2321-1717) 38 | P a g e
L2 Latent heat of flash steam at lower pressure).
LP Low Pressure
MP Medium Pressure
PL Plume length
QHeat Total heat available in flue gas, kCal/hr
Qleak Quantity of steam leaked, kg/hr
S1 Sensible heat of higher pressure condensate
S2 Sensible heat of the steam at lower pressure
TPH Tons per hour
VFlow Flow rate, m3/hr
ρ Density of fluid, kg/m3
1. INTRODUCTION
Industrial energy efficiency has emerged as one of the key issues in India. The industrial
sector uses about 40% of total energy in the country [1]. India accounts for 4.5% of industrial
energy use worldwide [2]. According to the International Energy Agency (IEA) World
Energy Outlook energy consumption in Indian industry is projected to more than double by
2030 and so increases its share of total final energy consumption to 31% [2].
A considerable amount of energy, in a refinery, is utilized in pump, fan, compressor
operation, steam production and distribution, and therefore an energy performance
assessment into pump, fan, compressor operation, steam production, distribution and waste
heat recovery system would yield valuable information. Insulation of equipment and pipe
work, heat recovery from processed fluids, etc., are all seen as an area where heat could be
saved, which in turn saves fuel [3].
An energy audit is a technique for identifying energy losses, quantifying them, estimating
conservation potential, evolving technological options for conservation and evaluating
techno-economics for the measures suggested. Though the objectives of an energy audit are
universally accepted, the methodology is not standardized [4], but an attempt can be made to
standardize the methodology of an energy audit by determining the overall efficiency of a
A Monthly Double-Blind Peer Reviewed Refereed Open Access International e-Journal - Included in the International Serial Directories.
GE-International Journal of Engineering Research (GE-IJER) ISSN: (2321-1717) 39 | P a g e
determined independently. This would provide a clue as to where to act on improving the
energy efficiency of the system [4].
Steam trap is an essential part of steam distribution system. Three important functions of
steam traps are to discharge condensate as soon as it is formed, not to allow steam to escape
and to remove air and other incondensable gases. Loss equivalent to 25% of total steam
occurs due to malfunctioning of steam traps [5]. Such steam traps are to be replaced to avoid
loss of live steam which conserves a lot of energy.
Waste heat recovery steam generation (WHRSG) is well proven technique for energy
conservation. Waste heat available in the plant may be used for either process heating or for
power generation depending on the enthalpy of the said steam. Typical case study for a
cement industry indicates that about 4.4 MW of electricity may be generated which leads to
energy conservation of 42.88 MWh/year [7]. Another literature regarding the secondary kiln
shell of the cement plant indicates that the use of waste heat can save up to 5.3MWof thermal
energy, which is equivalent to 10.4% of the total input energy of plant [7]. This can save fuel
consumption and energy efficiency of the unit increases by 5%.
The main aim of this paper is to save energy in steam distribution system, heat recovery
system and insulation system. There are three different type of steams, high pressure (HP)
steam (37.42 kg/cm2), medium pressure (MP) steam (12.5 kg/cm2) and low pressure steam (4
kg/cm2), depending upon pressure variation. A steam leak survey of all these three types of
steam has been carried out and total 16 numbers of HP steam traps, 18 numbers of MP steam
traps and 7 numbers of LP steam traps have been found with leakages in it. Moreover,
tremendous amount of heat energy can be recovered in CO-oxidizer unit of an FCCU.
2. ENERGY PERFORMANCE ASSESSMENT METHODOLOGY IN STEAM
DISTRIBUTION SYSTEM
The steam distribution system is the essential link between the steam generator and the steam
user. Steam with the right quality, correct pressure and in the right quantity is essential for an
efficient steam distribution system [8].
2.1.1 PERFORMANCE OF STEAM DISTRIBUTION SYSTEM
There are two main areas where performance of steam distribution system can be assessed in
FCCU:
Steam traps
A Monthly Double-Blind Peer Reviewed Refereed Open Access International e-Journal - Included in the International Serial Directories.
GE-International Journal of Engineering Research (GE-IJER) ISSN: (2321-1717) 40 | P a g e
(a)MONITORING STEAM TRAPS
The purpose of installing the steam traps is to obtain fast heating of the product and
equipment by keeping the steam lines and equipment free of condensate, air and
non-condensable gases. A steam trap is a valve device that discharges condensate and air from the
line or piece of equipment without discharging the steam [8].
Steam trap performance assessment is basically concerned with answering the following two questions:
Is the trap working correctly or not?
If not, has the trap failed in the open or closed position?
There are two type of failure of steam traps: Open condition type and Close condition type.
Traps that fail ’Open’ result in a loss of steam and its energy. At a same time as condensate is
not returned back to the circuit, the water is lost to atmosphere which is loss of energy. The
result is significant economic loss, directly via increased boiler plant costs, and potentially
indirectly, via decreased steam heating capacity. Traps that fail ’closed’ do not result in
energy or water losses, but can result in significantly reduced heating capacity and/or damage
to steam heating equipment.
There are three energy saving opportunities as far as steam trap is concerned:
(a) Avoiding Steam Leakages:
Steam leaks on high-pressure mains are prohibitively costlier than on low pressure mains.
Any steam leakage must be quickly attended to. In fact, the plant should consider a regular
surveillance program for identifying leaks at pipelines, valves, flanges and joints. One
method of identifying steam leak is to measure the plume length of the leaking steam from a
spot [9]. The following equation (1) can be used to assess the approximate quantity of steam
leak.
A Monthly Double-Blind Peer Reviewed Refereed Open Access International e-Journal - Included in the International Serial Directories.
[image:5.595.185.429.50.198.2]GE-International Journal of Engineering Research (GE-IJER) ISSN: (2321-1717) 41 | P a g e
Figure 1: Plume length (L) of leaking steam
Figure 1 shows the layout of a pipe line carrying steam. Whenever any hole develops on the
surface, steam will start leaking through it. The length of plume may be measured by a steel
tape or a meter scale as accurate as possible.
(b) Condensate Recovery:
The steam condenses after giving off its latent heat in the heating coil or the jacket of the process
equipment. A sizable portion (about 25%) of the total heat in the steam leaves the process
equipment as hot water. The percentage of energy in condensate to that in steam can vary
from 18% at 1 bar to 30% at 14 bar; clearly the liquid condensate is worth reclaiming. If
this water is returned to the boiler house, it will reduce the fuel requirements of the boiler.
For every 60o C rise in the feed water temperature, there will be approximately 1% saving of
fuel in the boiler [8].
(c) Flash Steam Recovery:
This shall not be mistaken for a steam leak through the trap. The users sometimes get
confused between a flash steam and leaking steam. The flash steam and the leaking steam can
be approximately identified as follows:
If steam blows out continuously in a blue stream, it is a leaking steam.
If a steam floats out intermittently in a whitish cloud, it is a flash steam [8].
Flash steam is produced when condensate at a high pressure is released to a lower pressure such
steam can be used for low pressure heating. The higher the steam pressure and lower the flash
steam pressure the greater the quantity of flash steam that can be generated. In many cases, flash
A Monthly Double-Blind Peer Reviewed Refereed Open Access International e-Journal - Included in the International Serial Directories.
GE-International Journal of Engineering Research (GE-IJER) ISSN: (2321-1717) 42 | P a g e
reduce use of steam through pressure reducing valves. The flash steam quantity can be calculated
by the equation (2) with the help of a steam table:
𝐹𝑆𝐴 =𝑺𝟏−𝑺𝟐
𝑳𝟐 (2)
3. ENERGY PERFORMANCE ASSESSMENT METHODOLOGY IN WASTE HEAT
RECOVERY SYSTEM
Waste heat is heat is generally generated in a process by way of fuel combustion or chemical
reaction, and then dumped into the environment even though it could still be reused for some
useful and economic purpose [10]. The essential quality of heat is not the amount but rather
its value. The strategy of how to recover this heat depends in part on the temperature of the
waste heat gases and the economics involved. CO- oxidizer and flue gas cooler are the
equipments which are used for extracting waste heat comes from regenerator.
3.1. CO-OXIDIZER
Huge quantities of low pressure flue gases containing carbon monoxides (CO) are available
in refineries as a by-product of the catalyst regeneration process in fluid catalytic cracking
(FCC) unit. This CO gas is being converted into CO2 by CO- oxidizer. This CO gas is
utilized for steam production for three reasons:
To recover the heat available in flue gases
To convert CO into CO2 before discharging the flue gases to atmosphere
The flue gases are rich in carbon monoxide which is to be converted to carbon dioxide before
its discharge to atmosphere. CO boiler design must take into consideration the three reasons
mentioned above, i.e. recover the heat available and convert the CO to CO2. These
equipments are not only boilers but also incinerators where residence time at high
temperature is the key factor for the proper CO oxidation.
3.2 FLUE GAS COOLER
Flue gas cooler is used in cases where little or no CO is present in the flue gases (when fully
converted in the catalyst regeneration process). Flue gas coolers are heat recovery units where
sensible heat contained in the flue gases is utilized to produce and superheat steam or to
preheat process oil streams for energy conservation purposes in fluid catalytic cracking unit.
A Monthly Double-Blind Peer Reviewed Refereed Open Access International e-Journal - Included in the International Serial Directories.
GE-International Journal of Engineering Research (GE-IJER) ISSN: (2321-1717) 43 | P a g e
By installing flue gas cooler, heat can be recovered to pre-heat the combustion air and hence
the fuel savings would be 33% (@ 1% fuel reduction for every 22oC reduction in temperature
of flue gas)
3.3ARRANGEMENT OF CO-OXIDIZER AND FLUE GAS COOLER IN
FCCU
Figure 2 shows the detail arrangement of CO-oxidizer and Flue gas cooler used in FCCU.
3.4CALCULATION OF TOTAL QUANTITY OF RECOVERABLE HEAT
The total heat recoverable at final exhaust temperature can be calculated by equation (3).
[image:7.595.133.485.234.521.2]QHeat = 𝑉𝑓𝑙𝑜𝑤 × ρ × CP × ∆T (3)
Figure 2: Arrangement of CO-Oxidizer and Flue gas cooler
4. RESULTS AND DISCUSSION
4.1ACTUAL PERFORMANCE DETAILS OF STEAM DISTRIBUTION
SYSTEM
Fluid Catalytic Cracking Unit (FCCU) is one of the major steam consuming units in Essar oil
refinery. Steam leak survey as well as survey of heat loss through un- insulated surface has
A Monthly Double-Blind Peer Reviewed Refereed Open Access International e-Journal - Included in the International Serial Directories.
GE-International Journal of Engineering Research (GE-IJER) ISSN: (2321-1717) 44 | P a g e HP steam pressure (37.42 kg/cm2)
MP steam pressure (12.5 kg/cm2)
LP steam pressure (4 kg/cm2)
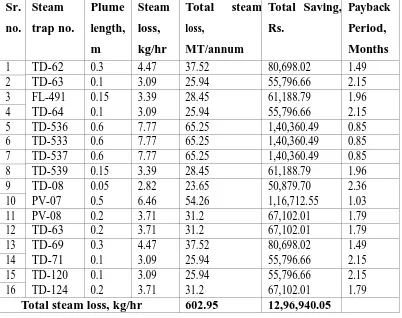
4.1.1 STEAM LEAK SURVEY
Most of steam traps, used in FCCU, are Thermodynamic (TD) type and Thermostatic
(Balanced Pressure-BPT) type. Steam leak quantity was calculated in FCCU by plume length
method. Plume length measured by visual inspection with the steel scale. Table 1, Table 2
and Table 3 show the steam leaks quantity, total saving in Rs. and payback period of HP
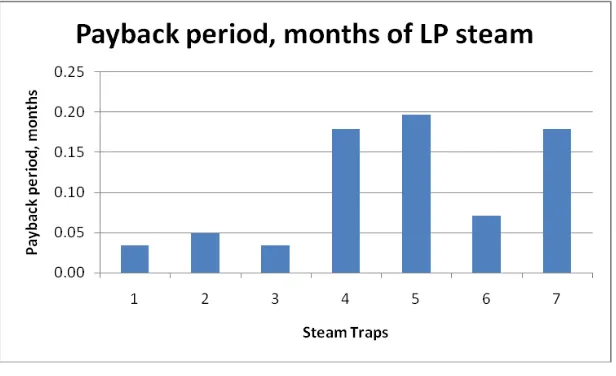
steam, MP steam and LP steam respectively. Figure 3, Figure 4 and Figure 5 show the steam
leaks quantity, total saving in Rs. and Payback period, months of HP steam respectively, in
form of charts. Figure 6, Figure 7 and Figure 8 show the steam leaks quantity, total saving in
Rs. and Payback period, months of MP steam respectively, in form of charts. Figure 9, Figure
10 and Figure 11 show the steam leaks quantity, total saving in Rs. and Payback period,
months of LP steam respectively, in form of charts.
Table 1: Actual Performance Details of HP Steam leakages from the steam traps
Sr. no. Steam trap no. Plume length, m Steam loss, kg/hr Total steam loss, MT/annum
Total Saving,
Rs.
Payback
Period,
Months
1 TD-62 0.3 4.47 37.52 80,698.02 1.49
2 TD-63 0.1 3.09 25.94 55,796.66 2.15
3 FL-491 0.15 3.39 28.45 61,188.79 1.96
4 TD-64 0.1 3.09 25.94 55,796.66 2.15
5 TD-536 0.6 7.77 65.25 1,40,360.49 0.85
6 TD-533 0.6 7.77 65.25 1,40,360.49 0.85
7 TD-537 0.6 7.77 65.25 1,40,360.49 0.85
8 TD-539 0.15 3.39 28.45 61,188.79 1.96
9 TD-08 0.05 2.82 23.65 50,879.70 2.36
10 PV-07 0.5 6.46 54.26 1,16,712.55 1.03
11 PV-08 0.2 3.71 31.2 67,102.01 1.79
12 TD-63 0.2 3.71 31.2 67,102.01 1.79
13 TD-69 0.3 4.47 37.52 80,698.02 1.49
14 TD-71 0.1 3.09 25.94 55,796.66 2.15
15 TD-120 0.1 3.09 25.94 55,796.66 2.15
16 TD-124 0.2 3.71 31.2 67,102.01 1.79
[image:8.595.107.509.373.691.2]A Monthly Double-Blind Peer Reviewed Refereed Open Access International e-Journal - Included in the International Serial Directories.
GE-International Journal of Engineering Research (GE-IJER) ISSN: (2321-1717) 45 | P a g e
Table 2: Actual Performance Details of MP Steam leakages from the steam traps
Sr. no. Steam trap no. Plume length, m Steam loss, kg/hr Total
steam loss, MT/annum
Total Saving, Rs.
Payback Period, Months
1 TD-450 0.05 2.82 23.65 50,879.70 0.2
2 TD-495 0.8 11.24 94.38 2,03,001.64 0.05
3 TD-457 0.1 3.09 25.94 55,796.66 0.18
4 TD-462 0.1 3.09 25.94 55,796.66 0.18
5 TD-465 0.05 2.82 23.65 50,879.70 0.2
6 BPT-431 0.05 2.82 23.65 50,879.70 0.2
7 BPT-434 0.1 3.09 25.94 55,796.66 0.18
8 BPT-435 1.5 40.88 343.36 7,38,568.65 0.01
9 PV-409 1 16.25 136.49 2,93,598.76 0.03
10 PV-411 0.2 3.71 31.2 67,102.01 0.15
11 PV-412 0.5 6.46 54.26 1,16,712.55 0.09
12 PV-414 0.1 3.09 25.94 55,796.66 0.18
13 TD-47 0.1 3.09 25.94 55,796.66 0.18
14 TD-48 0.4 5.37 45.12 97,048.81 0.1
15 TD-49 0.4 5.37 45.12 97,048.81 0.1
16 TD-579 0.1 3.09 25.94 55,796.66 0.18
17 TD-580 0.1 3.09 25.94 55,796.66 0.18
18 TD-581 1.2 23.5 197.41 4,24,628.24 0.02
Total steam loss, kg/hr 1199.87 2580925.21
Table 3: Actual Performance Details of LP Steam leakages from the steam traps
Sr. no. Steam trap no. Plume length, m Steam loss, kg/hr Total
steam loss,
MT/annum
Total Saving,
Rs.
Payback
Period,
Months
1 BPT-438 1 16.25 136.49 2,93,598.76 0.03
2 BPT-506 0.8 11.24 94.38 2,03,001.64 0.05
3 BPT-476 1 16.25 136.49 2,93,598.76 0.03
4 BPT-478 0.1 3.09 25.94 55,796.66 0.18
5 TD-393 0.05 2.82 23.65 50,879.70 0.2
6 BPT-480 0.6 7.77 65.25 1,40,360.49 0.07
7 BPT-127 0.1 3.09 25.94 55,796.66 0.18
[image:9.595.106.509.79.422.2] [image:9.595.107.509.490.678.2]A Monthly Double-Blind Peer Reviewed Refereed Open Access International e-Journal - Included in the International Serial Directories.
GE-International Journal of Engineering Research (GE-IJER) ISSN: (2321-1717) 46 | P a g e
Figure 3: HP Steam Loss Quantity
Figure 4: Total Saving in HP Steam
[image:10.595.123.431.51.190.2] [image:10.595.126.436.251.436.2] [image:10.595.147.454.495.659.2]A Monthly Double-Blind Peer Reviewed Refereed Open Access International e-Journal - Included in the International Serial Directories.
GE-International Journal of Engineering Research (GE-IJER) ISSN: (2321-1717) 47 | P a g e
Figure 6: MP Steam Loss Quantity
Figure 7: Total Saving in MP Steam
[image:11.595.128.436.41.218.2] [image:11.595.126.436.285.467.2] [image:11.595.126.435.528.722.2]A Monthly Double-Blind Peer Reviewed Refereed Open Access International e-Journal - Included in the International Serial Directories.
GE-International Journal of Engineering Research (GE-IJER) ISSN: (2321-1717) 48 | P a g e
[image:12.595.125.440.40.447.2]Figure 9: LP Steam Loss Quantity
Figure 10: Total Saving in LP Steam
[image:12.595.128.435.41.220.2] [image:12.595.128.436.506.694.2]A Monthly Double-Blind Peer Reviewed Refereed Open Access International e-Journal - Included in the International Serial Directories.
GE-International Journal of Engineering Research (GE-IJER) ISSN: (2321-1717) 49 | P a g e
Steam loss quantity shown in Figure 3, Figure 6 and Figure 9 found due to failure of steam
traps in Open condition. Payback period was calculated by taking steam trap cost as Rs.10,
000. Figure 5, Figure 8 and Figure 11 presents the payback period which is not more than 3
months. It is recommended to replace all steam traps mentioned above, hence total savings in
HP steam, MP steam and LP steam will be Rs.12.96 Lacks, Rs.25.8 Lacks and Rs.10.93 Lacks
respectively, by incorporating the modifications suggested. Condensate recovery system and
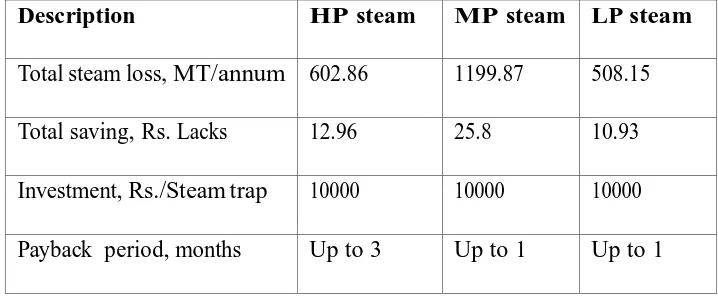
Flash steam separator exist in FCCU but these equipments are not utilized properly. Table 4 is
prepared based on steam leak readings taken in FCCU, which shows total steam loss, total savings
and payback period of HP steam, MP steam and LP steam.
Table 4: Proposed saving calculation of steam leaks
Description HP steam MP steam LP steam
Total steam loss, MT/annum 602.86 1199.87 508.15
Total saving, Rs. Lacks 12.96 25.8 10.93
Investment, Rs./Steam trap 10000 10000 10000
Payback period, months Up to 3 Up to 1 Up to 1
4.2ACTUAL PERFORMANCE DETAILS OF CO-OXIDIZER AND FLUE
GAS COOLER IN FCCU
Design parameters of CO-oxidizer and flue gas cooler have been collected from operation
and maintenance manual which is given by the manufacturer of the equipment. Pertinent
parameters of like pressure, temperature, flow rate of CO gas have been measured at the
inlet and exhaust for calculating actual efficiency of the equipment. Same pertinent
parameters have also been measure for boiler feed water, saturated steam and superheated
steam. Energy can be saved by decreasing exhaust gas temperature. Performance details of
CO-Oxidizer are given in Table 5. Performance details of Flue gas cooler are given in Table
6 Total available heat in flue gas has been calculated by equation (4) So total available heat
in flue gas,
𝑄𝐻𝑒𝑎𝑡 = 216287.9 × 1.16 × 0.31 × (895 − 313) = 45266288.98 kCal/hr
(4)
It is noticed that HP superheated steam, HP saturated steam and MP superheated steam is
[image:13.595.117.476.269.420.2]A Monthly Double-Blind Peer Reviewed Refereed Open Access International e-Journal - Included in the International Serial Directories.
GE-International Journal of Engineering Research (GE-IJER) ISSN: (2321-1717) 50 | P a g e
flue gas cooler. Flue gas inlet and outlet temperatures are observed 895oC and 313oC
respectively and hence total 45266288.98 kCal/hr of available heat in flue gas is calculated
from Table 5 and Table 6. It is noticed that still more heat can be recovered by reducing flue
gas outlet temperature. Reductions of 15 oC in Flue gas outlet temperature can be possible.
Therefore total 184.58 MT/annum of fuel can be saved and so Rs.31.69 Lacks can be saved in
Flue gas cooler.
Table 5: Performance details of CO-Oxidizer
Sr. no. Description Unit Actual Value
1 Flue gas inlet temperature-CO Oxidizer o C 605
2 Flue gas flow rate-CO Oxidizer m3/hr 216287.9
3 Flue gas inlet pressure kg/cm2 0.215
4 Flue gas outlet pressure kg/cm2 0.161
5 Fuel gas(FG) supply quantity kg/hr 425
6 Flue gas outlet temperature o C 898
Table 6: Performance details of Flue gas cooler
Sr. no. Description Unit Actual Value
1 Flue gas flow rate-FGC m3/hr 216287.9
2 Flue gas flow rate-FGC kg/hr 250893.96
3 Flue gas inlet temperature-FGC o C 895
4 Flue gas outlet temperature-FGC o C 313
5 Flue gas inlet Pressure-FGC kg/cm2 0.161
6 Flue gas outlet Pressure-FGC kg/cm2 0.094
7 Boiler feed water inlet temperature o C 188
8 Boiler feed water inlet pressure kg/cm2 44
9 Boiler feed water inlet flow rate T/hr 111
10 Economizer outlet temperature o C 220
11 Saturated HP steam outlet temperature o C 250
12 Saturated HP steam outlet pressure kg/cm2 40
13 Saturated HP steam outlet flow rate T/hr 27
14 Superheated HP steam outlet temperature o C 390
15 Superheated HP steam outlet pressure kg/cm2 38.89
[image:14.595.97.521.204.312.2]A Monthly Double-Blind Peer Reviewed Refereed Open Access International e-Journal - Included in the International Serial Directories.
GE-International Journal of Engineering Research (GE-IJER) ISSN: (2321-1717) 51 | P a g e
17 Saturated MP steam inlet temperature o C 194
18 Saturated MP steam inlet pressure kg/cm2 13.6
19 Saturated MP steam inlet flow rate T/hr 20.8
20 Superheated MP steam outlet temperature o C 299
21 Superheated MP steam outlet pressure kg/cm2 13
22 Superheated MP steam outlet flow rate T/hr 20.8
It is also recommended to install gas turbine in the exhaust CO gas line of Regenerator-I. At
present the CO gas from Regenerator-I exhausted at 624.9oC and 2.06kg/cm2. Then CO gas
passes through the orifice chamber and is sent into the CO oxidizer at 0.7 kg/cm2, which
burns the CO gas and flue gas sent out of the CO oxidizer at 910oC. The energy in CO gas
exhausted at 2 kg/cm2 could be used to drive a gas turbine and the gas turbine connected to a
generator could produce electrical energy. Literature says that similar project successfully
carried out in one of the plant in china [25]. Cost benefit analysis of such a system is given in
the Table 7 below.
Table 7: Cost benefit analysis of Gas Turbine
Description Units Values
Actual parameters
CO TPH 3
Proposed parameters
Turbine generation kW 3,000
Hours of operation of plant per annum hrs/annum 8,400
Cost of unit energy Rs./kWh 5.25
Energy saved per annum kWh/annum 2,52,00,000
Total Savings per annum Rs. Lacks 1,323
Investment Rs. Lacks 1,400
Payback Period Months 12.69
Table 7 shows proposed total savings per annum, investment and payback period. It is
recommended to install gas turbine and so Rs.1323 lacks can be saved.
5. CONCLUSION
Energy conservation is prime important for any of the plant. Energy can be conserved in
FCCU by routine check-up of plant equipments, proper operation and maintenance work of
the plant. Following recommendations should be implemented for saving huge amount of
[image:15.595.97.517.35.168.2] [image:15.595.117.478.403.577.2]A Monthly Double-Blind Peer Reviewed Refereed Open Access International e-Journal - Included in the International Serial Directories.
GE-International Journal of Engineering Research (GE-IJER) ISSN: (2321-1717) 52 | P a g e
It is found in steam distribution system that most of the steam traps fail in open condition
hence steam leaks found from those failed traps. It is recommended to replace all the steam
traps mentioned in section 3.3.1. Total savings in HP steam, MP steam and LP steam will be
Rs.12.96 Lacks, Rs.25.8 Lacks and Rs.10.93 Lacks respectively by incorporating the
modifications suggested, with maximum payback period of only 3 months. It is also
suggested to utilize existing condensate recovery system and flash steam separator properly
in FCCU.
Flue gas inlet and outlet temperatures are observed as 895 oC and 313oC respectively, in case
of CO-oxidizer and Flue gas cooler. Hence, total 45266288.98 kCal/hr of available heat in
flue gas is calculated with the help of equation (4). It is noticed that still more heat can be
recovered by reducing flue gas outlet temperature. Reduction in flue gas outlet temperature
by 15oC has been recommended and if this recommendation is implemented, total 184.58
MT/annum of fuel can be saved and so Rs.31.69 Lacks can be saved in Flue gas cooler. It is
also recommended to install gas turbine immediately in CO line and hence Rs.1323 Lacks
can be saved with payback period of 12.69 months.
REFERENCES
[1] M. Yang, “Energy efficiency policy impact in India: Case study of investment in
industrial energy efficiency", International Energy Agency, vol. 34, pp. 3104- 3114, 2006.
[2] D. Gielen and P. Taylor, “Indicators for industrial energy efficiency in India",
International Energy Agency, vol. 34, pp. 962-969, 2009.
[3] G. McKay and C. Holland, “Energy savings from steam losses on an oil refinery",
Engineering Costs and Production Economics, vol. 5, pp. 193-203, 1981.
[4] R. Saidur, N. A. Rahim, and M. Hasanuzzaman, “A review on compressed-air energy use
and energy savings", Renewable and Sustainable Energy Reviews, vol. 14, pp. 1135-1153,
2010.
[5]. McKay and C. Holland, “Energy savings from steam losses on an oil refinery",
Engineering Costs and Production Economics, vol. 5, pp. 193-203, 1981.
[6] O. A. Dombayci, M. Golcu, and Y. Pancar, “Optimization of insulation thickness for
external walls using di_erent energy-sources," Applied Energy, vol. 83, pp. 921-928, 2006.
[7] G. Kabir, A. Abubakar, and U. El-Nafaty, “Energy audit and conservation opportunities
for pyro-processing unit of a typical dry process cement plant," Energy, vol. 35, pp.
A Monthly Double-Blind Peer Reviewed Refereed Open Access International e-Journal - Included in the International Serial Directories.
GE-International Journal of Engineering Research (GE-IJER) ISSN: (2321-1717) 53 | P a g e
[8] BEE, Steam systems. New Delhi, India: Ministry of Environment and Forests, Ministry of
Power, Government of India, 2007.
[9] G. G. Rajan, Energy savings in steam system. Cochin, India: Chemical engineering, 2003.
[10] BEE, Waste heat recovery system. New Delhi, India: Ministry of Environment and