Link to Leeds Beckett Repository record: http://eprints.leedsbeckett.ac.uk/4711/
Document Version:
Conference or Workshop Item
The aim of the Leeds Beckett Repository is to provide open access to our research, as required by funder policies and permitted by publishers and copyright law.
The Leeds Beckett repository holds a wide range of publications, each of which has been checked for copyright and the relevant embargo period has been applied by the Research Services team.
We operate on a standard take-down policy. If you are the author or publisher of an output and you would like it removed from the repository, please contact us and we will investigate on a case-by-case basis.
Safety climate validation for UK rail infrastructure workers:
Analysis of the nomological network for design engineers and rail
maintenance workers
Rajkiran KANDOLA, Matteo CURCURUTO, & James I. MORGAN
School of Social Sciences, Leeds Beckett University, UK
AbstractPreviousresearch has explored the relationship between safety climate and safety behaviour, suggesting that safety climate can predict safety performance, however the construct validity of safety climate models has not yet been extensively investigated in the rail
maintenance and engineering industry. The present paper outlines research testing the factor structure of Zohar and Luria’s Multilevel Safety Climate questionnaire (MSC scale; 2005) in a infrastructure maintenance organization and explores the nomological network of the MSC scale
Keywords
Safety climate, group level safety climate, organizational level safety climate, construct validity
1. Introduction
Despite a downward trend in accident and injury rates in the workplace, this continues to remain an issue. The Rail Safety and Standards Board report for 2016/17 shows 164 major injuries experienced by members of the workforce (RSSB, 2017). There is a significant cost to industries in the UK due to workplace accidents. The HSE report 30.4 million days lost in the UK due to work-related illness and workplace injury, with estimated costs of £14.1 billion (HSE 2015/16). It is common for safety critical industries, such as those involved in rail maintenance, design and engineering, to attempt to monitor safety performance and understand safety culture using safety climate measures in order to improve safety. At present, because safety climate validation research in the rail industry is lacking, organizations utilize safety climate tools validated in other industries, leading to potential misinterpretation of data. A rail-specific validation of safety-climate measures is therefore required.
1.1. Safety climate
safety related behaviours, such as safety compliance and safety participation (Griffin & Curcuruto, 2016; Neal, Griffin & Hart, 2000). However, replication of safety climate research remains inconsistent, even within similar industries (Clark, 2006; Flin et al., 2000; Guldenmund, 2000; Hale, 2000), perhaps due to the complexity of safety climate as a multilevel (i.e.
individual, organisational level) and multidimensional (i.e. management commitment to safety, work pressure) construct. Therefore, Flin et al. (2000) suggests that due to methodological variations, direct evaluations of safety climate factors amongst different industries should be avoided. Despite these issues with safety climate measurement, it remains common practice for industries to evaluate their current safety climate, suggest recommendations, and attempt to make improvements based on the results. The validity of safety climate tools is particularly limited within the UK rail and road industry and the present paper aims to address this issue. As well as rail operatives, consulting design engineers are equally responsible for accident
prevention during design and planning stages as this provides an opportunity to identify and reduce engineering safety hazards before work begins on site, where it may be more difficult to do so. Despite this, previous research has indicated that designers lack safety knowledge, and show a limited consideration of safety during the design process (Gambatese, Behm & Hinze, 2005). One aim of the present research is to explore intercorrelations between safety climate and safety-related constructs both at the blunt-end (i.e. for consulting design engineers) and compare these with those at the sharp end (i.e. for rail operatives) within the rail maintenance sector. and Given that rail infrastructure maintenance organisations operate within a safety critical
environment made up of complex hierarchical structures, there is a clear need to evaluate safety climate scales and relationships with safety outcomes, in multiple work groups using validated multilevel tools.
1.2. Multilevel safety climate
Safety climate can be measured at various different levels of an organisation (e.g. individual, group and organisational). Zohar and Luria (2005) suggest safety climate should be assessed in this way and so developed the multilevel safety climate scale. The scale is comprised of two separate measurement scales: the organisational level (measuring perceptions of top
management’s commitment to safety and safety priorities) and the group level (measuring perceptions of interaction between supervisors and group members to safety priorities during competing demands). Group level safety climate has previously been found to predict safety performance, however tools containing group level items are limited. Previous researchers have attempted to validate the group level scales and have found equivocal results (Huang et al., 2013a; Huang et al., 2013b; Huang et al, 2017) and have either renamed factors (Johnson, 2007), or found only a single factor (Cooper & Phillips, 2004; Navarro et al., 2013), contradicting the original structure by Zohar and Luria (2005).
1.3. Related constructs (nomological network)
The rail industry in particular deal with a number of demands at the sharp-end such as
and affect levels of fatigue (Fido & Ghali, 2008). Due to the specific nature of designer and operative work we deemed it important to include measures of production pressure,
consideration of future safety consequences and mood as highly relevant constructs within the safety-climate nomological network.
1.4. Overall research aims
The aim of the present paper was to further explore the construct validity of the multilevel safety climate (MSC) scale developed my Zohar and Luria (2005) in the rail industry. A preliminary study by Curcuruto, Morgan, Kandola & Griffin (under review), tested the internal factor structure of the MSC scale, adopting a cross validation approach within an infrastructure maintenance organisation by using exploratory factor analysis on half of the sample size and a confirmatory factory analysis on the second half of the sample. This study is an extension of this work and hopes to further contribute to the understanding of the construct validity of the MSC scale in two ways: a) by testing the factor structure of the MSC scale in an additional design engineer sample (N = 1,126), and b) by exploring the associations of the MSC scale with related constructs (e.g. production pressure, consideration of future safety consequences and mood dimensions) adopting an approach known in literature as nomological network analysis.
2. Method
2.1. Participants
Participants from a safety critical infrastructure maintenance organization were invited to take part in the questionnaire study. The participants were made up of two groups: consulting and rail. The consulting design engineers’ sample comprised of employees who design and plan engineering of rail and road, and environmental services. The rail sample comprised of employees who work in rail operations such as track electrification, track renewals, switches, signaling and inspections and the management of assets. Both samples of employees are involved in safety critical operations as part of their normal duties. A total of 1,654 responses were collected from the business unit (528 from rail and 1,126 from consulting) indicating a response rate of approximately 45%.
2.2. Measures
2.2.1. Zohar and Luria (2005) Multilevel safety climate questionnaire
The multilevel safety climate questionnaire developed by Zohar and Luria (2005) was used in the present study. This tool contains a 16-item organizational safety climate (OSC) sub-scale that contains items such as “Top management in this company tries to continually improve safety levels in each department”. In addition the tool also contains a 16-item group level sub-scale of safety climate (GSC) that contains items such as “My direct supervisor frequently tells us about the hazards in our work”. Both sub-scales utilise a 1 (strongly agree) to 5 likert scale (strongly disagree). Zohar & Luria (2005) confirmed the existence of two factors OSC and GSC, however the item loadings were not published. Higher scores indicate more positive views of safety at the organizational and group level.
2.2.2. Zohar and Luria MSC scale validation
validity of the multilevel safety climate scale (MSC; Zohar and Luria, 2005) in a sample of rail infrastructure workers (N = 528). Data from the sample was split in two parts, the first half was used for exploratory factor analysis (EFA) and the second half used for confirmatory factor analysis (CFA). The EFA was conducted initially to identify relevant latent safety climate factors, which were further verified using CFA. This process allowed appropriate testing of the distinctiveness of safety climate factors. The first factor was identified as a single factor at the organizational level (α = .93) labeled Organizational Safety Climate (OSC) and consisted of the 16 items measuring perceptions of management commitment to safety when dealing with competing priorities as originally proposed by Zohar and Luria (2005). Perceptions of group level safety climate revealed two factors. The first factor containing six items which measured supervisors’ communication strategies to promote and encourage safety, which we labeled as
supervisors’ safety communication (SSC; α = .89). The second factor at the group level comprised of five items measuring control and checking of compliant safety regulations and procedures, which we labeled as supervisors safety monitoring (SSM; α = .82). Results contradict the single factor at GSC originally proposed by (Zohar & Luria, 2005) and three factor GSC (Johnson (2007), Overall as a MSC scale, these results differ from the two-factor model originally proposed by Zohar and Luria (2005).
2.2.3. Nomological network constructs
Additional variables were included in the analyses that are considered important for our rail workforce. These included:
• Production Pressure – measured using the Organizational Production Pressure tool
(Probst & Grasso, 2013), comprising of a 4-item scale on a 7-point likert scale ranging from strongly disagree (1) to strongly agree (7). An example item: “I experience
workplace injuries due to production demands”. High scores indicate production priority over safety. (Design engineers: α = .75; Rail: α = .78)
• Consideration of future safety consequence (CFSC) – Aunidimensional construct measured using the tool developed by (Probst, Graso, Estrada and Greer, 2013), which considers individuals tendency to be more future safety orientated rather than immediate. Comprised of a 6-item scale, three items that are future orientated e.g. “Even though reporting accident can take a lot of time and effort, it helps other workers in the future’ and three items that are immediate orientated e.g. “Safety practices aren’t worth the time or effort when the risk of injury is low”. Higher scores indicate greater consideration of future-orientated safety consequences (i.e. enhanced safety) as opposed to immediate. (Design engineers: α = .79; Rail: α = .77)
• Job related well-being – A mood scale by Warr’s (1990) was used to measure job related well-being on a 6-point scale ranging from never (1) to all of the time (6). Mood was measured across two axis; anxiety-contentment (α = .76), containing positive and
negative worded items e.g. tense, uneasy, calm, relaxed and depression-enthusiaum(α = .80), e.g. gloomy, depressed, cheerful, optimistic. For the purpose of this study a third axis was also incorporated into the scale; tired-alert containing four items (fatigue, tired, alert, energetic). Higher scores indicate a negative mood. (Design engineers: α = .91 Rail: α = .92)
Day and night workshop sessions were scheduled across areas of the rail and consulting business unit, lasting one hour in total. Participants were presented with details of the
questionnaire and the overall research aims prior to completing the questionnaire. Participation was voluntary and all employees who wished to take part were allocated time within their shift to complete the questionnaire in the second half of the workshop, taking approximately 30 minutes to complete in full. In addition, an online version of the questionnaire was created to maximize participation from the consulting workforce. A link was attached to posters, email notifications and provided in team briefing sessions.
3. Results
3.1. Multilevel safety climate validation in the design engineering sample
Confirmatory factor analysis (CFA) was conducted to test the goodness of fit of the factor pattern previously identified by Curcuruto et al. (under review). CFA is usually used to test whether measures of a construct are consistent with a researcher's conceptualization of the nature of that construct. As such, the objective of confirmatory factor analysis is to test whether the data fit a hypothesized measurement model of the construct. AMOS version 24.0 was used in the current study. For model estimation, maximum likelihood method was applied. For model evaluation, a number of frequently used fit indices were adopted in the current study (Byrne, 2001), including the ratio of model chi-square to the degrees of freedom (Chi2/df), root mean square error of approximation (RMSEA), comparative fit index (CFI). A Chi2/df value less than 5 indicates an acceptable model fit to the data. RMESA values of less than 0.08 indicate an acceptable fit. CFI ranges from 0 to 1. Values over 0.90 are considered to be acceptable model fit to the data, whereas values higher than .95 are considered good. According to our statistical findings, the three factor model proposed by Curcuruto et al. (under review) presented fit indices which were all at the acceptable level for the measurement model (Chi2/df = 4.5, RMSEA = .06, CFI = 0.93), and better against all the other alternative factor model solutions which were tested in the light of existing studies on the MSC scale already existing in literature, like the original two factor structure proposed by Zohar and Luria (2005) (Chi2/df = 5.9, RMSEA = .07, CFI = 0.92), or a more complex four factor model solution based on the study proposed by Johnson (2007) (Chi2/df = 5.1, RMSEA = .07, CFI = 0.93). In summary, our analyses confirmed the goodness of a three factor model of the 27 item version of the MSC scale: organizational safety climate (α = .96), supervision safety communication, (α = .92), supervision safety monitoring α
= .84).
3.2. Nomological network measures
rail. Similarly, stronger correlations were found for CFSC at the organizational level for rail (rs[482] = .46, p = .00) and consulting (rs[1038] = .45, p = .00). At the group level, strongest correlational differences were found between SSC & SSM within rail in comparison to
[image:7.595.69.523.203.407.2]consulting with a larger difference on depression-enthusiasm between SSC (rs[491] = -.43, p = .00) and SSM (rs[492] = -.34, p = .00).
Table 1: Intercorrelations and descriptive statistics: Consulting sample (N=1,126)
M Sd 1 2 3 4 5 6 7 8
1. Organizational safety climate (OSC)
3.17 .67 -
2. Supervisor safety communication (SSC)
3.72 .83 .64 -
3. Supervisor safety monitoring (SSM)
4.01 .70 .60 .69 -
4. Production pressure 2.31 1.08 -.49 -.44 -.41 -
5. Consideration of future
safety consequences (CFSC) 6.07 .82 .45 .39 .37 -.60 -
6. Tired-Alert* 3.16 .81 -.33 -.28 -.28 .27 -.20 -
7. Depression-Enthusiasm* 2.76 .92 -.43 -.39 -.36 .33 -.28 .65 -
8. Anxiety-Contentment* 3.17 .93 -.31 -.26 -.27 .28 -.18 .57 .68 -
Note: all correlations are significant at p < .01 *High scores indicate worsening mood
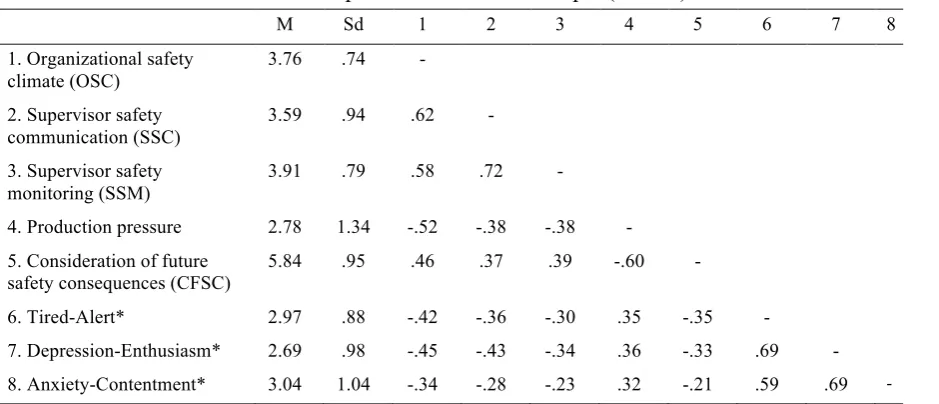
Table 2: Intercorrelations and descriptive statistics: Rail sample (N=528)
M Sd 1 2 3 4 5 6 7 8
1. Organizational safety climate (OSC)
3.76 .74 -
2. Supervisor safety communication (SSC)
3.59 .94 .62 -
3. Supervisor safety monitoring (SSM)
3.91 .79 .58 .72 -
4. Production pressure 2.78 1.34 -.52 -.38 -.38 -
5. Consideration of future safety consequences (CFSC)
5.84 .95 .46 .37 .39 -.60 -
6. Tired-Alert* 2.97 .88 -.42 -.36 -.30 .35 -.35 -
7. Depression-Enthusiasm* 2.69 .98 -.45 -.43 -.34 .36 -.33 .69 -
8. Anxiety-Contentment* 3.04 1.04 -.34 -.28 -.23 .32 -.21 .59 .69 -
Note: all correlations are significant at p < .01 *High scores indicate worsening mood
[image:7.595.65.535.448.650.2]4.1. MSC scale validation in consulting design engineers
The aim of our research was to contribute to the validation of the multilevel safety climate questionnaire (Zohar and Luria, 2005) within the rail industry by conducting confirmatory factor analysis on the three factors identified by Curcuruto et al. (under review) using a consulting design engineer data sample. Results confirmed the goodness of fit for the scale as a three-factor model when compared to previous findings (e.g. Johnson, 2007 and Navarro et al, 2013). When evaluating safety climate the following tool considers one organizational level factor and two distinct group level factors (supervisors safety communication and supervisors safety
monitoring) as appropriate for design engineers.
4.2. Nomologial network; OSC in Rail and Consulting
The present study examined the associations of nomological network variables with the validated factors of the multilevel scale. Results revealed strong associations with the scale factors and additional variables included as part of the nomological network in consulting (shown in Table 1) and rail (shown in Table 2). The correlations reveal stronger positive
relationships between OSC scores and self reported consideration of future safety consequences than both SSM and SSC. In addition, stronger negative correlations were found between mood and production pressure than both factors (SSM and SSC) at group level in both consulting and rail samples. This implies that when there is a higher perceived safety commitment of top management, perceptions of production pressure are lower, mood is improved (i.e. more alert, enthused and content) and there is more consideration of future safety consequences rather than immediate safety consequences (i.e. time allocated for pre-job inspection) in both samples (e.g. Designers or Operatives). From a practical perspective this may mean that if top management hold fewer safety-awareness events or invest less time in safety training, perceptions of production pressure might increase, or production pressure perceptions may decrease when more time is invested into safety related training by top management.
4.3. Nomological network: SSC and SSM in rail and consulting
Finally, the present study also examined the associations of nomological network variables with the two constructs identified as SSM and SSC in both samples. As can be seen in Table 2, the rail sample revealed comparable correlations between production pressure and both group level factors (-.38). This implies that regardless of perceptions of supervisor style (communicative or monitoring), production pressure attitudes are likely to remain the same and are perhaps more influenced at organizational level where the association is stronger (-.52). In comparison, findings shown in Table 1 revealed a marginally stronger association between production pressure and SSC, which might suggest that perceptions of supervisorsthat openly promote additional safety briefings and tasks, results in increased perceptions of production pressure from the consulting workforce. The differences between CFSC and each factor dimension in rail at group level reveal marginal differences (SSC; .37 and SSM; .39), an opposite pattern of results found in consulting (SSC; .39 and SSM; .37). This might suggest in rail there is greater consideration of future consequences when supervisors increase levels of monitoring and checking and in consulting there is greater consideration of future consequences when
safety communication strategies are based on promoting and encouraging safety, rail workers are likely to feel mood improvement, therefore more alert (-.36), more enthused (-.43) and more content (-.28). This suggests that a more communicative and proactive approach to supervisor level safety in rail is likely to improve levels of mood from the workforce as opposed to supervisor safety monitoring and checking. In comparison, in the consulting sample, equal associations were found between SSM and SSC and tired-alert axis (-.28), suggesting both supervisor strategies have similar associations with tiredness and alertness. Somewhat similar to rail, consulting employees are likely to feel more enthused with perceived supervisor
communicative safety strategy (-.39) than monitoring strategies (-.36). Finally, a marginal difference is associated with safety monitoring practices in contentment (-.27) than safety communication (-.26) in the consulting sample.
5. Conclusion
The aim of the present paper was to further validate the multilevel safety climate scale by Zohar & Luria (2005) in a safety critical organization. Results differ from the original authors, who describe a two factor model (Zohar & Luria, 2005), our findings identified a three factor model; one single construct at the organizational level called Organisational Safety Climate (OSC) and two distinct factors at group level called supervisor safety communication and supervisor safety monitoring (i.e. a three-factor model). In addition to this, these factors were correlated with relevant constructs; production pressure, consideration of future safety consequences and mood and highlights the similarities and differences between each of the multilevel factors within two samples of rail and consulting design engineer employees.
6. Acknowledgements
The authors wish to thank the participants who volunteered to take part in the questionnaire and Malcolm McPhail for assisting with data collection.
References
Beus, J.M., Payne, S.C., Bergman, M.E., Arthur, W., 2010. Safety climate and injuries: an examination of theoretical and empirical relationships. Journal of Applied Psychology.95 (4), 713–727.
Byrne, B. M. (2001). Structural equation modeling with AMOS: Basic concepts, applications, and programming. Mahwah, NJ: Lawrence Erlbaum Associates.
Clarke, S. (2006). The relationship between safety climate and safety performance: A meta- analytic review. Journal of Occupational Health Psychology, 11(4), 315−327.
Cooper, D., & Phillips, R. A. (2004). Exploratory analysis of the safety climate and safety behavior relationship. Journal of Safety Research, 35(5), 497-512.
Curcuruto, M. & Griffin, M. A. (2017). Safety Proactivity in The Workplace: The Initiative to Improve Individual, Team, and Organizational Safety. In S. Parker & U. Bindl (Eds.),
Routledge
Curcuruto, M., Morgan, J. I., Kandola, R., & Griffin, M. A. (under review). Multilevel Safety Climate in the UK Rail Industry: A Cross Validation of the Zohar and Luria MSC Scale
Fido, A., & Ghali, A. (2008). Detrimental effects of variable work shifts on quality of sleep, general health and work performance. Medical Principles and Practice, 17, 453–457. doi:10.1159/000151566
Gambatese, J.A., Behm, M., Hinze, J.W. (2005). Viability of designing for construction worker safety. Journal of Construction and Engineering Management: ASCE 131 (9), 1029– 1036.
Griffin, M. A., & Curcuruto, M. (2016). Safety climate in organizations. Annual Review of Organizational Psychology and Organizational Behavior, 3, 191–212.
Griffin, M.A., & Neal, A. (2000). Perceptions of safety at work: a framework for linking safety climate to safety performance, knowledge, and motivation. Journal of occupational health psychology, 5, 347–358. doi:10.1037/1076-8998.5.3.347
Guldenmund, F.W. (2000), The nature of safety culture: a review of theory and research, Safety Science,34, pp. 215-257.
Hale, A. (2000). Special issue on safety culture and climate. Safety Science,34, 1–3.
Hofmann, D. A., & Stetzer, A. (1996). A cross-level investigation of factors influencing unsafe behaviors and accidents. Personnel Psychology, 49, 307−339.
HSE (2016) Workplace injuries - all industries [Online], Health and Safety Executive. Available from: <http://www.hse.gov.uk/statistics/overall/hssh1516.pdf?pdf=hssh1516> [Accessed 13 July 2017]
Huang, Y.H., Lee, J., Chen, Z., Perry, M., Cheung, J.H. & Wang, M. (2017). An item-response theory approach to safety climate measurement: The Liberty Mutual Safety Climate Short Scales, Accident Analysis and Prevention, 103, 96-104.
Huang, Y.H., Zohar, D., Robertson, M. M., Garabet, A., Lee, J., & Murphy, L. A. (2013a). Development and validation of safety climate scales for lone workers using truck drivers as exemplar. Transportation Research Part F, 17, 5-19
Huang, Y.H., Zohar, D., Robertson, M.M., Garabet, A., Murphy, L.A., Lee, J., (2013b). Development and validation of safety climate scales for mobile remote workers using utility/electrical workers as exemplar. Accident and Analysis Prevention, 59, 76–86.
Johnson, S. E. (2007). The predictive validity of safety climate. Journal of Safety Research, 38(5), 511–521.
Barnes-Farrell, J.L. (2010). Relationships between psychological safety climate facets and safety behavior in the rail industry: A dominance analysis. Accident Analysis and
Prevention,42, pp. 1460-1467.
Nahrgang, J.D., Morgeson F.P. & Hofmann D.A. (2011). Safety at work: a meta-analytic investigation of the link between job demands, job resources, burnout, engagement, and safety outcomes. Journal of Applied Psychology, 96(1), pp. 71– 94.
Neal, A., Griffin, M.A. & Hart, P.M. (2000). The impact of organizational climate on safety climate and individual behavior, Safety Science, 34, pp.99-109
Probst, T.M. and Estrada, A.X. (2010). Accident under-reporting among employees: testing the moderating influence of safety climate and supervisor enforcement of safety practices.
Accident Analysis and Prevention, 42, pp. 1438-1444.
Probst, T.M. & Graso, M. (2013). Pressure to produce = pressure to reduce accident reporting?
Accident Analysis and Prevention, 59, pp. 580-587.
Probst, T.M., Graso, M., Estrada, A.X. & Greer, S. (2013). Consideration of future safety
consequences: A new predictor of employee safety. Accident Analysis and Prevention, 55, pp. 124-134.
RSSB (2017) Annual Safety Performance Report [Online], Rail Safety and Standards Board ltd. Available from: <
https://www.rssb.co.uk/Library/risk-analysis-and-safety-reporting/2017-07-report-annual-safety-performance-report.pdf> [Accessed 13 July 2017]
Warr, P. B. (1990). The measurement of well-being and other aspects of mental health. Journal of Occupational Psychology, 63, pp. 193-210
Zohar, D. & Luria, G. (2005). A Multilevel Model of Safety Climate: Cross-Level Relationships Between Organization and Group-Level Climates. Journal of Applied Psychology, 90(4),
pp. 616-628.
Zohar, D. (2010). Thirty years of safety climate research: Reflections and future directions.
Accident Analysis & Prevention. 42, 1517–1522.