© Associated Asia Research Foundation (AARF)
A Monthly Double-Blind Peer Reviewed Refereed Open Access International e-Journal - Included in the International Serial Directories.
Page | 1
A STUDY ON EMPLOYEES’ JOB SATISFACTION TOWARDS SRI
VARSHINI KNIT FASHIONS, TIRUPUR.
Dr. P. PARIMALA DEVI Associate Professor Department of E-Commerce
Vellalar College For Women (Autonomous) Erode
ABSTRACT
Employees are spending more and more time at work place. A qualitative and quantitative review of the relationship between job satisfaction and job performance is prevailing. The relationship between job satisfaction and turnover is also significant and consistent. There is a correlation between, value, emotion, and appraisal, and the employees job satisfaction. This study is synergize the job satisfaction of employees working in Sri Varshini Knit Fashions by
using percentage, chi-square and weighted average statistical tools.
Key Words: Satisfaction, relationship, performance INTRODUCTION
The study is to analyze the job satisfaction of the employees’ working in SRI VARSHINI KNIT
FASHION, TIRUPUR District in TAMIL NADU. It analyzes the working conditions in the
company and the employee’s job satisfaction in their respective field of functioning. It provides a
good opportunity to compare theoretical aspect about the job satisfaction with experience in the
real day – to – day functioning
International Research Journal of Human Resources and Social Sciences ISSN(O): (2349-4085) ISSN(P): (2394-4218) Impact Factor- 5.414, Volume 5, Issue 08, August 2018 Website- www.aarf.asia, Email : editor@aarf.asia , editoraarf@gmail.com
© Associated Asia Research Foundation (AARF)
A Monthly Double-Blind Peer Reviewed Refereed Open Access International e-Journal - Included in the International Serial Directories.
Page | 2 STATEMENT OF THE PROBLEM
The relationship between the job satisfaction and job performance of an individual is a positive
relationship. This is because these two are caused by quite different factors. Job satisfaction is
closely affected by the amount of rewards that an individual derives from his job, while his level
of performance is closely attested by the basic for attainment of rewards. An individual is
satisfied with his job to the extent that his job provides him with what he desires, and this
performs effectively in his job to the extent that effective performance leads to the attainment of
what he desires.
Is the communication and guidance are proper available in the company? What are the facilities available to the employee’s?
Is the company providing more promotional opportunity to workers?
SCOPE OF THE STUDY
This project was under taken to study the employee’s job satisfaction towards their job in Sri Varshini knit fashion .perception of employees’ towards work environment , welfare
facilities , co-workers co-operations , promotion opportunities , supervision and their pay
are considered as the factor of job satisfaction .
The job satisfaction is an individual’s general attitude towards his or her job. Job
satisfaction requires interaction with co-workers and bosses, following organisation rules
and policies , meeting performance standards, living with working condition , that are
often less than ideal and the like.
OBJECTIVE OF THE STUDY Main Objective:
To find out the employees’ job satisfaction level towards Sri Varshini knit fashion,
Tirupur.
© Associated Asia Research Foundation (AARF)
A Monthly Double-Blind Peer Reviewed Refereed Open Access International e-Journal - Included in the International Serial Directories.
Page | 3 To study the attitude of the employees’ towards the work environment in the
company
To find out the problems faced by the employees’ in the job.
To bring out the key findings of the study and to offer suitable suggestions
RESEARCH METHODOLOGY:
Research is an art of scientific investigation. Meaning of research as “A careful investigation or
enquiry especially through search for new facts in any branch of knowledge”
The human research researcher has to decide about the data collection data collection method
and sampling for the research work.
It includes
DATA COLLECTION PRIMARY DATA
The primary data is collected from questionnaire and interview schedule method.
SECONDARY DATA
The secondary data is collected from the company website
SAMPLING DESIGN
Sampling Area : The sampling area is only with in Sri Varshini knit fashion, Tirupur.
Sampling Size : The researcher use convenience sampling method by which 150 sampling were
selected for the study.
TOOLS OF ANALYSIS
The information is collected using questionnaires method. The purpose of the research is
clearly explained to the respondents whenever the respondents, have a doubt. In the project we
© Associated Asia Research Foundation (AARF)
A Monthly Double-Blind Peer Reviewed Refereed Open Access International e-Journal - Included in the International Serial Directories.
Page | 4 Simple percentage analysis
Weighted score analysis ranking method. Chi-Square Analysis
LIMITATIONS OF THE STUDY
The sample is selected from the employees’ of Sri Varshini knit fashion. The satisfaction level of the employees’ in the organization may differ from those of others. So the following are
some of the some of the important limitations of Sri Varshini knit fashion.
The study is restricted only to Sri Varshini knit Fashion, in Tirupur, so the result may not
be applicable to other companies.
The workers were not ready to give correct facts because of their fear towards their top
management.
Only 150 respondents were selected for the study, so the result may vary if sample size
differs are included.
The finding of the study depends on the responses given by sample respondents.
PROFILE OF THE RESPONDENTS
An attempt has been made to outline the profile of the respondents who has been
interviewed, for the study of customer the job satisfaction. To analyse the Profile of the
sample respondents it divided into two parts,
Section – A. Percentage Analysis
Section - B. Weighted average
A. Percentage Analysis
Percentage analysis restores to special kind of ratio and in which percentage is used in
making comparison between two or more series of data. Percentage is used to describe the
relationship. Since the percentage reduce everything to a common base and their by allow
© Associated Asia Research Foundation (AARF)
A Monthly Double-Blind Peer Reviewed Refereed Open Access International e-Journal - Included in the International Serial Directories.
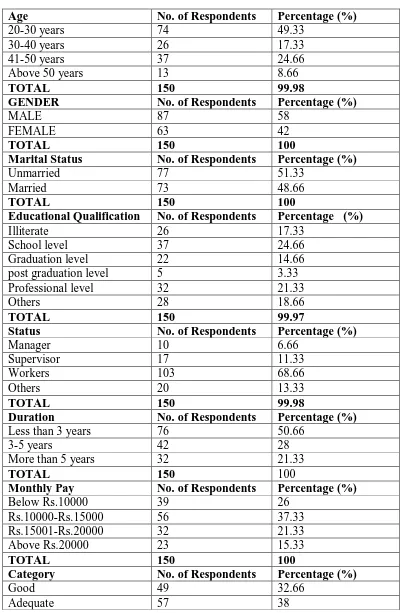
[image:5.612.105.519.58.671.2]Page | 5 TABLE 1
Age No. of Respondents Percentage (%)
20-30 years 74 49.33
30-40 years 26 17.33
41-50 years 37 24.66
Above 50 years 13 8.66
TOTAL 150 99.98
GENDER No. of Respondents Percentage (%)
MALE 87 58
FEMALE 63 42
TOTAL 150 100
Marital Status No. of Respondents Percentage (%)
Unmarried 77 51.33
Married 73 48.66
TOTAL 150 100
Educational Qualification No. of Respondents Percentage (%)
Illiterate 26 17.33
School level 37 24.66
Graduation level 22 14.66
post graduation level 5 3.33
Professional level 32 21.33
Others 28 18.66
TOTAL 150 99.97
Status No. of Respondents Percentage (%)
Manager 10 6.66
Supervisor 17 11.33
Workers 103 68.66
Others 20 13.33
TOTAL 150 99.98
Duration No. of Respondents Percentage (%)
Less than 3 years 76 50.66
3-5 years 42 28
More than 5 years 32 21.33
TOTAL 150 100
Monthly Pay No. of Respondents Percentage (%)
Below Rs.10000 39 26
Rs.10000-Rs.15000 56 37.33
Rs.15001-Rs.20000 32 21.33
Above Rs.20000 23 15.33
TOTAL 150 100
Category No. of Respondents Percentage (%)
Good 49 32.66
© Associated Asia Research Foundation (AARF)
A Monthly Double-Blind Peer Reviewed Refereed Open Access International e-Journal - Included in the International Serial Directories.
Page | 6
In Adequate 44 29.33
TOTAL 150 100
Category No. of Respondents Percentage (%)
Highly satisfied 36 24
Satisfied 58 38.66
Dis-satisfied 56 37.33
TOTAL 150 99.99
Satisfaction level No. of Respondents Percentage (%)
Very good 33 22
Good 53 35.33
Average 46 30.66
Poor 18 12
TOTAL 150 99.99
Satisfaction level No. of Respondents Percentage (%)
Yes 84 56
No 66 44
TOTAL 150 100
Category No. of Respondents Percentage (%)
Agree 42 28
Moderate 76 50.66
Dis-agree 32 21.33
TOTAL 150 99.99
Category No. of Respondents Percentage (%)
Highly satisfied 62 41.33
Satisfied 59 37.33
Dis-satisfied 29 19.33
TOTAL 150 97.99
Satisfaction level No. of Respondents Percentage (%)
Yes 88 58.66
No 62 41.33
TOTAL 150 99.99
PERCENTAGE ANALYSIS
The majority (49.33%) of the respondents belongs to the age group of below 20 - 30
years.
The majority (58%) of the respondents are male.
The majority (51.33%) of the respondents are unmarried.
© Associated Asia Research Foundation (AARF)
A Monthly Double-Blind Peer Reviewed Refereed Open Access International e-Journal - Included in the International Serial Directories.
Page | 7 The majority (50.66%) of the respondents having less than 3 years of working experience
in this company.
The majority (37.33%) of the respondent’s monthly pay is Rs.10000 to 15000. The majority (38.66%) of the respondents are satisfied with bonus and incentives. The majority (35.33%) of the respondents says that the working environment is good. The majority (56%) of the respondents are satisfied with regards to promotional methods
of the company.
The majority (50.66%) of the respondents are moderate with the feedback system provided by the management that helps the employees’ to achieve the target.
The majority (41.33%) of the respondents are highly satisfied with the reward system. The majority (58.66%) of the respondents are satisfied with the accident compensation
policies.
WEIGHTED AVERAGE SCORE RANKING METHOD
Under this method, the respondents are asked to rank their given problems. To secure a
ranking of all items involved, the researcher simply totals the weights which are given to
each item. The highest weighted score is ranking first and then the corresponding rank is
assigned.
FORMULA:
Weighted Average = Sum of Weighted Terms
___________________
Total Number of Terms
To find the weighted term, multiply each term by its weighting factor, which is the
© Associated Asia Research Foundation (AARF)
A Monthly Double-Blind Peer Reviewed Refereed Open Access International e-Journal - Included in the International Serial Directories.
[image:8.612.66.549.95.444.2]Page | 8 TABLE 2
WEIGHTED SCORE ANALYSIS RANKING METHOD Weighted Average
Score(W)
5 4 3 2 1 Total
Score
Weighted average
Rank Rank
Problems
I II III IV V
Inadequate S
Salary
X 23 28 25 24 45
WX 115 112 75 48 45 395 26.33 5
Inadequate Medical Facility
X 29 42 35 20 25
WX 145 168 105 40 25 483 32.2 2
Unsecured Job
X 20 29 24 43 33
WX 100 116 72 86 33 407 27.13 4
No career Development
X 30 31 39 32 22
WX 150 124 117 64 22 477 31.8 3
Communication Problem
X 48 20 27 31 25
WX 240 80 81 62 25 488 32.53 1
Total 150 150 150 150 150
WEIGHTED AVERAGE ANALYSIS
It is concluded from the analysis that the “communication” is the major problem faced by the
respondents in their job.
OPINION LEVEL OF THE RESPONDENTS ABOUT EMPLOYEES’ JOB SATISFACTION TOWARDS SRI VARSHINI KNIT FASHION,
Opinion Level of The Respondents About Employees’ Job Satisfaction Towards Sri Varshini
© Associated Asia Research Foundation (AARF)
A Monthly Double-Blind Peer Reviewed Refereed Open Access International e-Journal - Included in the International Serial Directories.
Page | 9 Factors Degrees of
freedom
Calculated Value
Table Value Hypothesis Accepted / Rejected
Age 6 4.104 12.592 Accepted
Gender 2 0.639 5.991 Accepted
Designation 6 5.959 12.592 Accepted
Working period
2 3.247 5.991 Accepted
Monthly Income
6 4.648 12.592 Accepted
CHI-SQUARE ANALYSIS RESULTS HAVE SHOWS THAT
The study reveals that there is no significant relationship between Age, gender,
designation, working period, monthly income and satisfaction level of the
respondents.
SUGGESTIONS
Based on the above findings the concrete and fractional suggestions are recommended to SRI
VARSHINI KNIT FASHION.
It is suggested that the society might try to find out various causes for the workers
dissatisfaction and try to undertake remedial measures, so that they can develop job satisfaction
among the workers, which is indispensable for productivity and higher standard of living.
© Associated Asia Research Foundation (AARF)
A Monthly Double-Blind Peer Reviewed Refereed Open Access International e-Journal - Included in the International Serial Directories.
Page | 10 The company should provide more promotional opportunity to workers.
Employee’s grievance system, performance appraisal can be done by human resource
department in SRI VARSHINI KNIT FASHION regularly. Medical policy should be improved
5.3 CONCLUSION
Job satisfaction has a direct bearing with the mental and physical feeling of the
employees’. When the job satisfaction in the organization is in higher level, it will increase the
production of the company where the job satisfaction is low it will adversely affect the
production of the company.
The study on employee’s job satisfaction revealed that employees’ are satisfied on the
majority of the factors. Suitable suggestions are provided to reduce their problems. This study
helps us to increase the level of satisfactions of the employees’ and motivate them in such a way
to raise the efficiency and skill..
BIBLIOGRAPHY REFERENCE BOOK
C.B. Mamoria, Personal Management, Himalaya Publishing House, Eleventh Edition,
New Delhi
JOURNALS
Arthur, “Effects of human resource systems on manufacturing performance and turnover”, Academy of Management Journal, Volume-2, Issue-3, and June 2005.
Biswas.S.N, “Indian Journal Of Individuals”, Institute of Management, Volume-5, Issue-2, and February 1994.
Neeraj Kumari,” Job Satisfaction of the Employees at the Workplace”, European Journal
of Business and Management, Vol 3, No.4, 2011.
© Associated Asia Research Foundation (AARF)
A Monthly Double-Blind Peer Reviewed Refereed Open Access International e-Journal - Included in the International Serial Directories.
Page | 11 WEBSITES
Info@carona.in
www.acadimea.in
www.employeeretention.org
www.garmentindustry.com