THE SITE SELECTION AND OPTIMIZATION OF
TANGSHAN PASSENGER WEST STATION
1MI XUE YUE, 2JIANG JUN NA
1
College of Civil and Architectural Engineering, Hebei United University, Tangshan, 063009
2 Collage of science, Hebei United University, Tangshan, 063009
E-mail: [email protected], [email protected]
ABSTRACT
In recent years, the proportion of Tangshan high-speed direct passenger in passenger transport is
increasing. The existing bus terminal is still mainly dominated by ordinary road passenger. Bus terminal bit
unreasonable station level is low, can not meet the requirements of the development of future high-speed
passenger. The papers using principal component analysis to analyze the factors that affect passenger
traffic, to determine the district's high-speed passenger traffic. Quantitative calculation and qualitative
analysis method can produce a number of alternative sites. Finally, the establishment of maximum
economic efficiency model, Compare the combined costs of various options, select the minimum cost
solutions as the optimal site.
Keywords: Express Bus Terminal, Site, Passenger Traffic, Optimization Model
1. INTRODUCTION
Tangshan is a centuries-old coastal city of
heavy industry. Tangshan transportation
connections. Densely developed, a total mileage
of 288 km highway, highway density reaches the
level of developed countries, and countries as the
main hub of the city, one of the National
Highway 45.West Passenger Station existing
operator class lines, high off P off duty line ratio
is about 1:2[1]. West Passenger Station in
Tangshan situation and future development of
high-speed passenger point of view, the West Bus
Station Reconstruction will become an inevitable
trend. The current station location can not meet
the future land needs of the development of the
bus terminal alterations[2]. Therefore, the next
bus terminal development is the key pointto solve
the passenger terminal siting. The second part of
the model introduced; The third part is the basis
of data; fourth part is the steps Tangshan Bus
Terminal site; final validation model is feasible.
2. RESEARCH METHOD
Consider the following uncertain discrete
singular system Largest integrated economic
efficiency model to calculate the current cost of
the station site and the two alternative sites for
the minimum integrated, lowest cost target, to
select the optimal site.
Objective function[3-11]:
Constraints: Di∈
{ }
LDwhere ji ip
j
a
=
a
∑
ip ip ji j
ji i a S a S F=
∑
+i
F - Station Location comprehensive cost in
point I;
ji
a
-J to the average annual daily from
departure passenger volume of passenger station
i, passengers / day;
ip
a
-The amount of average annual daily
travelers entering the highway from the bus
terminal i p through toll stations, passengers /
day;
ji
S - The distance from to j to the bus terminal i
;
i
D - The geographical location of the
alternative bus terminal site i;
{ }LD-The overall city layout planning optional
set of land in the passenger terminal buildin.
3. HIGH-SPEED PPASSENGER VOLUME
DETERMINED
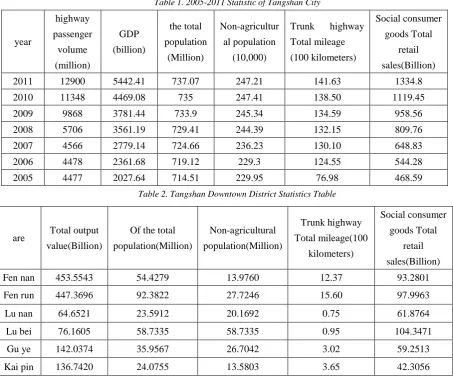
(1) The statistics of Tangshan City, 2005-2011,
as shown in Table 1.
Table data input SPSS software, its main
component analysis, can eventually be each index
in the share of passenger traffic weight
[image:2.612.81.535.334.710.2]coefficient: 1.254,1.634,7.994,0.675, 3..
Table 1. 2005-2011 Statistic of Tangshan City
year
highway
passenger
volume
(million)
GDP
(billion)
the total
population
(Million)
Non-agricultur
al population
(10,000)
Trunk highway
Total mileage
(100 kilometers)
Social consumer
goods Total
retail
sales(Billion)
2011 12900 5442.41 737.07 247.21 141.63 1334.8
2010 11348 4469.08 735 247.41 138.50 1119.45
2009 9868 3781.44 733.9 245.34 134.59 958.56
2008 5706 3561.19 729.41 244.39 132.15 809.76
2007 4566 2779.14 724.66 236.23 130.10 648.83
2006 4478 2361.68 719.12 229.3 124.55 544.28
2005 4477 2027.64 714.51 229.95 76.98 468.59
Table 2. Tangshan Downtown District Statistics Ttable
are Total output value(Billion)
Of the total
population(Million)
Non-agricultural
population(Million)
Trunk highway
Total mileage(100
kilometers)
Social consumer
goods Total
retail
sales(Billion)
Fen nan 453.5543 54.4279 13.9760 12.37 93.2801
Fen run 447.3696 92.3822 27.7246 15.60 97.9963
Lu nan 64.6521 23.5912 20.1692 0.75 61.8764
Lu bei 76.1605 58.7335 58.7335 0.95 104.3471
Gu ye 142.0374 35.9567 26.7042 3.02 59.2513
Table 3. The Tangshan City Ddistrict Aaverage Ddaily Aamount of Rroad Ppassenger and Hhigh-speed Ppassenger
Ttraffic
Area Average daily the highway
passenger traffic (person / day)
The average daily
amountof high-speed
passenger (person / day
Fennan 3289 1096
Fenrun 3851 1283
Lunan 1452 484
Lubei 3031 1010
Gguye 1960 653
Kaipin 1396 465
(2) The 2010 Tangshan downtown district
passenger traffic impact factor statistics in Table
2 [1] shows. Corresponding multiplying weight
coefficients in Table3 above indicators in the
share of passenger traffic, passenger traffic on
each partition can get. Calculate the ratio of the
total passenger traffic in each partition passenger
traffic Tangshan,:
0.164,0.193,0.073,0.152,0.098,0.070.
(3) The district's average daily high-speed
passenger traffic results, as shown in Table 3.
4. THE CONTROLLER
DETERMINATION OF THE SITE
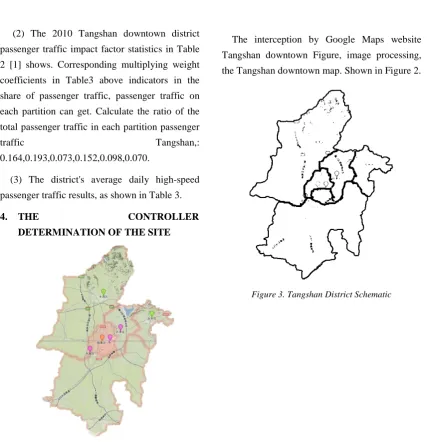
The interception by Google Maps website
Tangshan downtown Figure, image processing,
[image:3.612.90.518.275.718.2]the Tangshan downtown map. Shown in Figure 2.
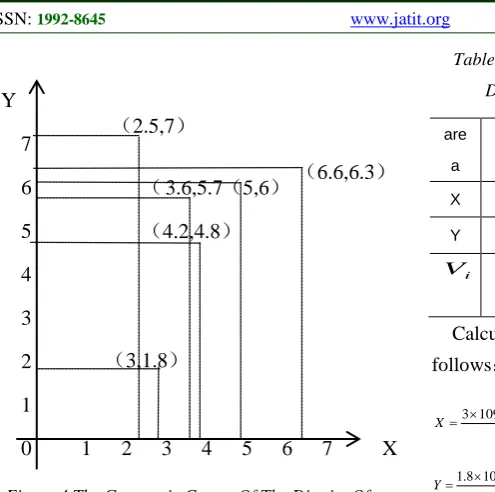
[image:3.612.334.487.365.556.2]Figure 4.The Geometric Center Of The District Of
Tangshan Downtown
Image processing, District of Tangshan
diagram is shown in Figure3.
Image perspective of the relative position of
the geometric center of the District of Tangshan
downtown is shown in Figure 4.
Center of gravity method Terminal site model
is as follows:
Where:
(
X Yi, i)
-Known supply point and demandpoint coordinates, the coordinates of the center of
the District
(
X Y
,
)
- Be the coordinates of the location inthe passenger terminal
Center of gravity method, each partition of the
data, as shown in Table 4.
Table 4. The Partition Coordinate And The Average
Daily Amount Of High-Speed Passenger
are
a fennan fenru n luna n lube i guy e kaipi n
X 3 2.5 4.2 3.6 6.6 5
Y 1.8 7 4.8 5.7 6.3 6
i
V
1096 1283 484 101 0
465 653
Calculation Terminal coordinates (X, Y) are as
follows: 7 . 3 465 653 1010 484 1283 1096 465 6 . 6 653 5 1010 6 . 3 484 2 . 4 1283 5 . 2 1096 3 = + + + + + × + × + × + × + × + × = X 2 . 5 465 653 1010 484 1283 1096 465 3 . 6 653 6 1010 7 . 5 484 8 . 4 1283 7 1096 8 . 1 = + + + + + × + × + × + × + × + × = Y
Corresponds to the actual location, Changning
Road and Dali Road intersection near the bus
terminal about. That position belongs to the
critical areas of urban and suburban, city traffic
will not cause interference, and ample land
resources, will not have a huge amount of
demolition. In this position, however, far from
the existing bus terminus and railway station in
Tangshan City, and relatively few bus lines is not
very convenient for passengers to reach the
station Transferring.
5. VERIFY
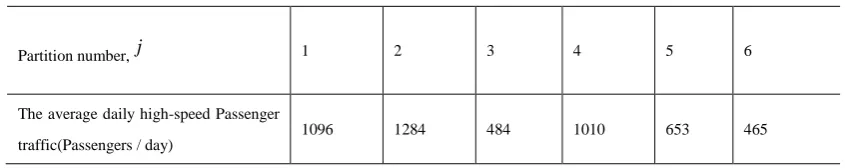
District average daily high-speed passenger
traffic data as shown in Table 5-1.
From j to the bus terminal i distance data as
shown in Table 6.
Table 6 From The Bus Terminal Distance Table
ji
S
1 2 3 4 5 61 23.3 20.0 6.9 3.9 29.0 14.6
2 27.2 17.2 8.5 2.5 25.7 11.1
3 23.4 19.7 7.1 3.7 28.9 14.4
∑
∑
= i i i V X V X∑
∑
= i i i V Y V Y i 0 1 2 3 4 5 6 71 2 3 4 5 6 7 (4.2,4.8) (5,6) (3,1.8)
(3.6,5.7 (6.6,6.3) (2.5,7)
The calculation process is as follows:
if i=1
1 1 1069 23.3 1284 20.0 484 6.9
1010 3.9 653 29.0 465 14.6 84238.54
j j
a S = × + × + ×
+ × + × + × =
∑
ifi=2
2 2 1069 27.2 1284 17.2 484 8.5
1010 2.5 653 25.7 465 11.1 80496.47
j j
a S = × + × + ×
+ × + × + × =
∑
ifi=3
3 3 1069 23.4 1284 19.7 484 7.1
1010 3.7 653 28.9 465 14.4 83699.47 j j
a S = × + × + ×
+ × + × + × =
∑
Bus terminal i to the highway at the entrance
[image:5.612.97.293.368.461.2]to the distance data as shown in Table 7.
Table 7 Bus Terminal To The Distance Of The
Highway At The Entrance
1 2 3
1 12.6 24.1 12.2
2 20.7 17.4 20.3
The calculation process is as follows:
4993 465 653 1010 484 1284
1069+ + + + + =
= ip a
If i=1
(
12.6 20.7)
166266.9 49931
1 = × + =
∑
apSpIf i=2
(
24
.
1
17
.
4
)
2072095
4993
2
2
=
×
+
=
∑
a
pS
pIf i=3
(
12.2 20.3)
162272.5 49933
3 = × + =
∑
apSpCalculated for each site, calculated as follows
from the above datas.-
4 . 250505 9
. 166266 54
. 84238
1 1 1 1
1=
∑
j + p p = + =j
jS a S a
F
287706 5
. 207209 47
. 80496
2 2 2 2
2 =
∑
j + p p = + =j
j S a S
a F
245972 5
. 162272 47
. 83699
3 3 3 3
3=
∑
j + p p = + =j
j S a S a
F
Compare available
{
,
,
}
245972
min
min
F
i=
F
1F
2F
3=
The above calculation concluded for the use of
[image:5.612.94.517.554.638.2]the method to determine the sites for optimal site.
Table 5District average daily high-speed passenger Scale
Partition number, j 1 2 3 4 5 6
The average daily high-speed Passenger
traffic(Passengers / day) 1096 1284 484 1010 653 465
6. CONCLUSION
In comparison with the existing bus terminal
address, the new site from the bus terminus in the
city of Tangshan City train station a little far, but
transfer and arrive convenience to have a huge
impact. The new site is located in the northern
section of two-way in front of the station at
ten-lane road capacity is greatly enhanced, and
here the traffic flow has been reduced a lot. i
ip S
Therefore, even if the new station site and
existing passenger West Station and the distance
of the high-speed inlet and does not vary a lot,
but it brings the effect is significant. Avoided
Station Road, a narrow four-lane sections, away
from the city's high-density traffic, passenger
vehicles pulled out of the new station to enter the
high-speed driving. Rough calculation, if the
passenger vehicles outbound route at the entrance
from the bus terminal to Jinghagaosu Tangshan
assume that sailed out of the new station's speed
up to 60km/h, by the new station into the high
speed of only 20.3 minutes, the same time, the
existing bus terminal vehicle just traveling to
Chen Chuang near the bus station. From the point
of view of land use, compared with the existing
stations, new site development land is relatively
abundant, and due to the deviation from the
center, the smaller amount of demolition, land
prices low, the bus terminal Jianzhan costs
relatively low cost.
ACKNOWLEDGEMENT
The work is supported by the Youth fund of
Hebei United University (Z201102), Natural
Scientific Fund Project in Hebei Province
(No.F2010000976).
REFERENCES
[1] Tang S. Municipal Bureau of Statistics.
Tangshan Statistical Yearbook (2011). Hebei:
China Bureau of Statistics Press. 2011.
Page:18-23.
[2] Comprehensive Planning Department of the
Ministry of Transport of the People's
Republic of China. Transportation Twelfth
Five-Year Development Planning. 2011, 6:
AC planning Fa [2011] No. 191.
[3] Chen T, C,. A fuzzy approach to select the
location of the distribution center. Fuzzy Sets
and Systems 2001. Vol.118, page: 65-73.
[4] Wang, L. The Research of the Planning
Method about the Highway Passenger Hub
Outward the City. Xian: Xian University of
Architecture and Technology, 2010:22-25.
[5] Hao H., Shao C., F., Yue H. Location of
Road Passenger Transportation Hub Based on
Multi-Objective Optimization [J]. Joumal of
Transportation Systems Engineering and
lnformation Technology. 2009. Vol.5. Page:
91-93.
[6] Sanjay M., Mark S.D. An integrated model of
facility location and transportation network
design. Transportation Research Part A. 2001.
Vol.35. page: 515-53.
[7] GAO H., Study on the Distribution and
Layout of Passenger Stations along an
Expressway, Journal of Xihua University
Natural Science Edition. 2008. Vol. 27,
Issues 2 .page:67-69.
[8] Huang Z., Rong C., Study on the Distribution
and Layout of Passenger Stations along an
Expressway, Journal of Transportation
Systems Engineering and Information
Technology. 2007. Vol.7, Issues 2, and page
13-15.
[9] Zhang Y. S., Present situation and
development of domestic and international
highway, Communications Science and
Technology Heilongjiang, 2010.
[10]Sun Y, reflection on the development of
highway passenger transport Journal of
Liaoning Administration College, 2008.
Vol.10, Issues 10, and page 94-95.
[11]Zhou L, the Study on Layout Method of
Urban Highway Passenger Transport Hub.