Cross listing waves
Sarkissian, Sergei and Schill, Michael
McGill University, University of Virginia
2010
Online at
https://mpra.ub.uni-muenchen.de/27545/
Cross-Listing Waves*
Sergei Sarkissian
Michael J. Schill
McGill University University of Virginia
First draft: June 30, 2008 This version: August 9, 2010
___________________
1
Cross Listing Waves
ABSTRACT
Using a 57-year global panel of listings on foreign stock exchanges, we identify waves in foreign listing activity at the host market, home market, and industry levels. We observe that the waves in the host market are often due to cross-listing waves in home markets or industries that share a particular affiliation with the respective host market. We then find that cross-listing waves in a given host country or from a given home country largely coincide with the outperformance of that country’s economy and financial markets relative to other competing markets. We also show that firms that list their shares during waves are associated with a temporary value premium. Our results provide novel evidence of non-monotonic market development across countries and over time.
JEL classification: G15; G32
2
1. Introduction
From the 1950s to the 2000s, the home and host market and industry profile for overseas
listings has changed considerably.1 In the 1950s, the hosting of foreign equity by stock exchanges
was largely a European phenomenon. The dominant host markets of the day were the Belgian,
British, Dutch, and French exchanges. The leading source of these listings was American and
South African stocks. The mining industry was the primary cross-listing industry. By the 1980s,
Tokyo became a dominant destination for foreign listings, followed by a strong reversal of
foreign listings from Tokyo in the 1990s. By the 2000s, Canadian and Indian firms were the
primary source of cross listings, and the United States became the dominant host markets
attracting more than 50% of all new foreign placed shares, followed by Luxembourg and the
United Kingdom. Industry representation was much broader, but the electronics industry was the
leading provider of foreign listed equity. Hence, it seems natural to investigate these ebbs and
flows in the dynamics of overseas listings to understand the reasons for changes in the geography
of listings, as well as to examine the firm valuation impact from cross-listing in markets during
their most popular listing time periods.
There is some existing literature that explores various time-series patterns of cross
listings. Pagano, et al. (2001) and Pagano, et al. (2002) examine several snapshots in foreign
listings across European and U.S. exchanges over the 1986 to 1997 period. Edison and Warnock
(2008) examine time-series patterns in listings of emerging markets country firms on U.S.
exchanges. Fernandes and Giannetti (2008) examine listing patterns between 1980 and 2006. A
series of recent research focuses on the time-series of U.S.-hosted foreign listings (see Berger, et
al., 2005; Litvak, 2007; Zingales, 2008; Chaplinsky and Ramchand, 2008; Doidge, et al., 2009,
2010).
1
3
This paper provides a comprehensive analysis of a hand-collected global sample of 3,592
cross-border exchange-traded only listings focusing specifically on the time-series characteristics
of listing decisions and the valuation gains to listing abroad. The sample contains listings on 33
foreign stock exchanges from 73 home markets over the period from 1950 to 2006. With a global
long-term view of foreign listing activity, we observe that relative surges and contractions in
listing across markets are not new.
First, we show that listing on foreign exchanges has ebbed and flowed for some time in a
series of cross-listing waves. Belgium was the dominate host market in the 1950s, France in the
1960s, the United Kingdom in the 1970s, Japan and the United States in the 1980s, and the
United States continued to dominate the host market listings in the 1990s and 2000s. We observe
similar time-series variation for the frequency of overseas listing across home markets and
industries. We observe that the waves in the host market are often due to cross-listing waves in
home markets or industries that share a particular affiliation with the respective host market. For
example, the popularity of the United Kingdom as a host market in the 1950s was largely due to
an increase in listings from South Africa that tended to commonly list in the United Kingdom.
Controlling for these effects is important in understanding the time-series and cross-sectional
preferences of the host market choice.
Second, we find that cross-listing waves in a given host country (or from a given home
country) frequently coincide with the outperformance of that country’s economy and financial
markets relative to other competing markets. We show a clear positive linkage between foreign
listing activity across host countries in a given year and their respective lagged real GDP growth
rates and stock market returns. This relation is remains intact after accounting for other
macroeconomic and financial variables, such as inflation, real return on short-term bills, and term
premium. The observation that cross-listing “waves” occur in markets when the market does
relatively well is consistent with the recent literature. Dittmar and Dittmar (2008) show that
waves in U.S. financing decisions, such as stock repurchases, equity issuance, and mergers, are
4
foreign firms to its exchanges highlights its overall financial market activity, we interpret our
finding as providing novel evidence for the uneven development of capital markets across
countries and over time, as documented in Rajan and Zingales (2003).
Finally, we postulate that surges in listings on host markets correlate with periods of
particular gain for firms listing in that market. For example, the evidence of a wave of listings in
Tokyo in the 1980s suggests by revealed preference that the gains to listing in Tokyo in the 1980s
must have been relatively strong. In similar manner, we postulate that waves in listings from a
particular home market suggest periods of particular gains to foreign listing for firms from that
market. In addition, waves in listings from particular industries are likely to be associated with
periods of increased listing gains for firms from that industry. The surge of South African mining
stocks listing in London in the 1950s, for example, suggests that the generic gains to cross listing
in London must have been particularly acute for this sample of firms at this point of time. A large
literature reports valuation gains to cross listing (e.g., see Miller, 1999; Foerster and Karolyi,
1999; Errunza and Miller, 2000; Lang, et al., 2003; Doidge, et al., 2009).2 Other work, such as
Gozzi, et al. (2008), and Sarkissian and Schill (2009, 2010), question the magnitude of the
valuation gains.
We search across the periods of most popular listing activity for host markets, home
markets, and industries over a 22 year sample period (1985-2006).3 We find that such periods are
generally associated with particularly strong temporary valuation gains but observe no evidence
of durable valuation gains. More specifically, we find that the listing year gains in valuation
observed in literally every cross-listing study (e.g., Foerster and Karolyi, 1999; Errunza and
Miller, 2000; Sarkissian and Schill, 2009) is present only among “hot” host markets irrespective
of the particular set of control variables. We suspect that the temporary gains associated with
2
The literature advocates a variety of reasons for valuation gains to listing overseas, such as overcoming cross-border barriers (Black, 1974; Solnik, 1974; Stulz, 1981; Errunza and Losq, 1985); increasing information flow (Merton, 1987; Foerster and Karolyi, 1999), achieving better liquidity (Tinic and West, 1974; Domowitz, et al., 1998; Werner and Kleidon, 1996); conforming to more stringent disclosure rules (Biddle and Suadagaran, 1992; Huddart, et al., 1999), as well as improving minority shareholder protection (Benos and Weisbach, 2004; Coffee, 1999, 2002; Doidge, 2004; Doidge, et al., 2004, 2007, 2009; Reese and Weisbach, 2002; Stulz, 1999).
3
5
listings in highly visible host markets may constitute an important feature that attracts firms to
cross list on their exchanges. Such temporary gains are consistent in any cost of capital gains to
foreign listing as subsequent investment would be expected to eliminate the value premium (see
Gozzi, et al., 2008). In addition, our results show that permanent systematic valuation gains to
overseas listing is a very rare event. Overseas firms listed in the “hot” host markets experience
significantly lower long-term valuations not only relative to their domestically listed counterparts
but also those cross-listed firms that are placed on foreign exchanges outside their most attractive
time periods.
Thus, the relative foreign market outperformance does not provide sufficient conditions
for a firm to directly benefit from it by shifting some of its trading away from its lesser developed
domestic market. This result can be viewed as a reflection of country-level findings reported in
Rajan, et al. (2007) at the firm level. It appears that just like those countries that rely on capital in
more developed countries do not grow faster than those that do not, firms that rely on capital in
foreign markets that are more developed than their domestic market do not achieve better
valuation than those that do not.
The rest of the paper is organized as follows. Section 2 describes the chronology of
overseas listings from 1950 to 2006 and documents wave effects in the frequency of home, host,
and industries. Section 3 links the changes in the relative attractiveness of each of the top eight
host markets to the changes in their relative economic and financial market performance. Section
4 presents the results of firm valuation tests around the time of foreign listing placement that
control for the foreign listing intensity in the host market. Section 5 concludes.
2. The Chronology of Overseas Listings
6
The sample of foreign listings is constructed based on three surveys of world stock
exchanges completed by the authors at the end of 1998, 2003, and 2006. Surveys were completed
of all country exchanges indicated as having foreign listings by the World Federation of
Exchanges except for corporate tax haven markets, such as the Cayman Islands, Bermuda, Jersey,
and exchanges outside main boards of country stock exchanges. In each survey we asked the
exchange research department for a summary of all foreign companies, excluding investment
funds and trusts, listed on their exchange. In the 2003 and 2006 surveys we also asked for a
history of all previous foreign companies that had since delisted their shares. For some exchanges
(e.g., Tokyo) the requested data was available through the exchange website. Listings of foreign
shares were received for all exchanges, although there was variation in the quality of the lists of
delisted shares. In some cases full delisted share histories were received in other cases the lists
were only partial (e.g., delists over the past 10 years) or unavailable.4 For the U.S. firms,
approximately one-third of the sample listings had subsequently been delisted prior to 2006. The
resulting sample includes 3592 listings from 73 home countries in 33 host markets.
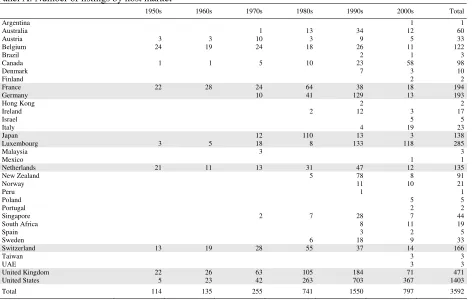
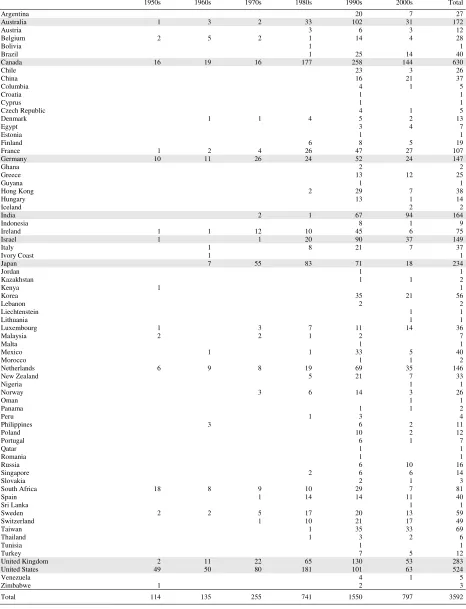
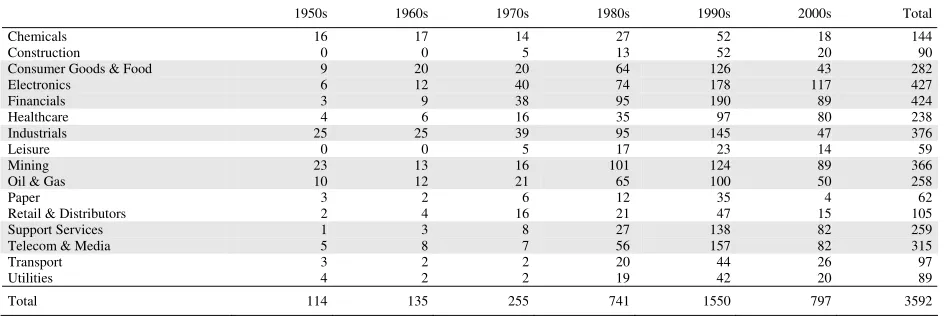
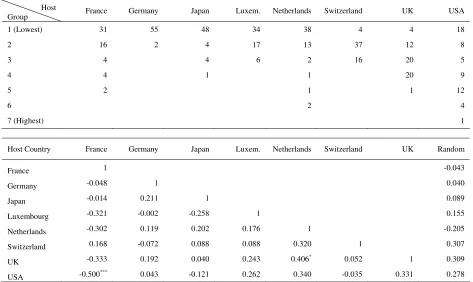
Table 1 shows the distribution of overseas listings by calendar decade from the 1950s
through the 2000s for each host market (Panel A), home market (Panel B), and industry group
(Panel C). Since the 1950s, the scope of host markets attracting foreign listings has grown
dramatically. The 2000s witnessed the largest single-time expansion of the geography of host
markets for overseas listings, with many smaller developed and emerging markets joining the
club, e.g., Argentina, Finland, Israel, Mexico, Poland, Portugal, Taiwan, and the United Arab
Emirates (UAE). The table reports the total number of listings from each home country, host
market, and industry. The eight largest host markets are France (194), Germnay (193), Japan
(138), Luxembourg (285), Netherlands (135), Switzerland (166), the United Kingdom (471), and
the United States (1403). The eight largest suppliers of listings are Australia (172), Canada (630),
Germany (147), India (164), Israel (149), Japan (234), the United Kingdom (283), and the United
4
7
States (524). The data is consistent with strong bilateral home-host market pairs, e.g., 88% of
Canadian listings are to the United States, 74% of Indian listings are to Luxembourg, and 51% of
Australian listings are to New Zealand.
It is also apparent from this panel that over the sample period the popularity of various
host markets has waxed and waned. Belgium, France, Netherlands, and the U.K. were the
dominant host markets in the 1950s, France in the 1960s, and then back to the United Kingdom in
the 1970s. By the 1980s, overseas listing frequency began to broaden across host markets with
the United States and Japan hosting a surge of listings. The United States also dominated foreign
listings in the 1990s and 2000s while listing waves materialized in Germany and Luxembourg.
Similar patterns can be observed in the other panels for cross listings organized by home market
and industry group. Prominent home market waves include the Japanese wave in the 1980s and
the South African wave in the 1940s and 1950s which also corresponds with the Mining wave of
the same time frame.
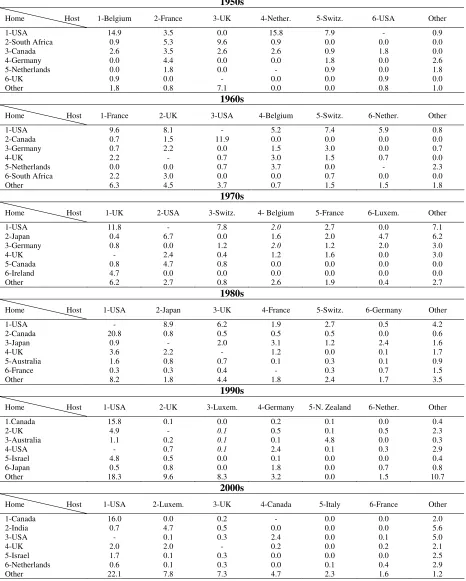
2.2. Dominant Home and Host Markets by Decade
Although we observe waves across the three specified dimensions, that is, host market,
home market, and industry, we are unable to determine how such waves interact across the
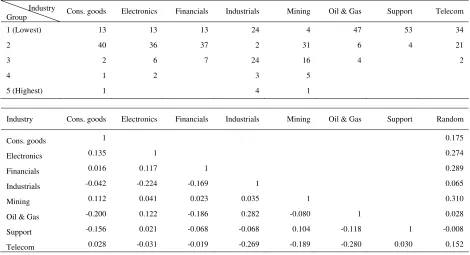
various dimensions. To shed some light on this issue, Table 2 reports the listing share of each
home and host market pair for the largest six host and home markets in each decade from the
1950s to the first half of the 2000s.
We can see a number of characteristics of overseas listing behavior in Table 2. First, there
is wide variation in the ranking of the top host and home markets. This observation suggests that
cross-listing waves exist. Second, the cross-listing market tends to be concentrated across
markets. For the most part, although the composition of the top host markets changes, these
markets attract between 78% and 94% of all overseas listings placed during each of the five
decades. There is less concentration among the home markets that drops from nearly 90% early in
8
Third, the listing activity is concentrated in the intersection of the six home and host
markets which comprise between to 89% to 99% of all cross listings (i.e., the “Other Host
Market” and “Other Home Market” cell in the bottom right corner of each panel maintains a
small proportion of listings). The waves of activities originate and are hosted in a select few
markets. Fourth, popular host markets often do not emerge as universally popular but rather as
uniquely bilaterally popular. In the 1950s, Belgium was the most popular host market for foreign
listings. It is clear, however, that Belgium was not universally popular. Almost all of the foreign
listings in Belgium originated from the United States and Canada. Without listings from these
two home markets, Belgium’s share of cross listings would have dropped from 21.1% to 3.6%.
For the United Kingdom, most of its listings originated from South Africa. Without the 11 South
African listings in London, the U.K.’s share would have dropped from 19.3% to 9.7%. Despite
Belgium’s popularity among U.S. firms, there was not a single U.S. firm that was listed in the
United Kingdom in the 1950s. U.S. firms also were attracted to the Netherlands and Switzerland.
Without the United States listings, neither of these host markets would have been among the top
six host markets. In that decade, France is the only market that appears to have had broad appeal
as it attracts large overseas listing of firms from South Africa, Germany, the United States,
Canada, and the Netherlands. For the most part, the popularity of a host market is determined by
firms from unique sets of home markets that tend to bilaterally prefer that particular host market.
To some extent, host markets frequently become popular not because of any general
characteristic of that market but rather because firms from a particular home market decide to
cross-list and that the paired host market is their preferred bilateral choice.
We observe similar bilateral effects in other decades. In the 1960s, France’s popularity
becomes more restricted to the United States (as well as Belgian) firms; the U.K.’s popularity is
linked to U.S. and South African firms; the U.S.’s popularity is tied with Canadian firms. In the
1970s, the U.K.’s popularity is linked to listings by U.S. and Irish firms, the U.S.’s popularity is
linked to listings by Japanese and Canadian firms, and Switzerland’s popularity is linked to U.S.
9
firms; and Japanese popularity is linked to listings by U.S. and U.K. firms. In the 1990s, the
U.S.’s popularity is tied to Canadian and broad listing from firms from many emerging market
countries; popularity of the U.K. and Luxembourg markets were also linked to firms from
emerging markets; whereas Germany was linked to U.S. firms and New Zealand was linked to
Australian firms. Similar patterns exist in the 2000s. Many of the bilateral pairs appear to fit with
the proximity patterns observed by Sarkissian and Schill (2004) with firms sharing common
geography, history, industrial structure, or language. It may be that the popularity of the host
market sometimes has much less to do with time-varying changes in the host market and much
more to with time-varying changes in the home markets.
We see drastic changes in the ranking of the top listing markets, both home and host, in
different historical periods. For instance, over the course of more than 50 years, the United States
has changed its position in global equity markets from the biggest provider to the biggest
recipient of foreign shares. Canada has been the major supplier of foreign listings in the 1990s
and 2000s but most of them were only in the United States. This table shows that the emergence
of a particular host market as a preferred place for foreign listing placement is often related to
time-series cross-listing effects in a very limited set of home markets.
2.3. The Time-series Trends in the Top Eight Markets
To further explore the evidence of cross-listing waves, we examine the time series of
foreign listing decisions across the top eight host markets, top eight home markets, and top eight
industries over the 1950 to 2006 period. The cut off at eight is motivated by the tradeoff of
covering as many markets or industries as possible while avoiding instances of excessively thin
listing activity. Note that only two countries (Italy and New Zealand) that are in the top six host
markets group in Table 2 at least during one of the calendar decades over our sample period are
excluded from consideration. By symmetry, we also consider the eight largest home markets.
These are Australia, Canada, Germany, India, Israel, Japan, the United Kingdom, and the United
10
goods, electrical and electronics equipment, financials, diversified industrials, mining, oil and
gas, business support, and telecommunication and media.
Figure 1 depicts the annual five-year moving-year proportion of new foreign listing
placement across the top eight host markets (Plot A), eight home markets (Plot B), and industries
(C) in each year in 1950-2006. The figures illustrate our observation from Tables 1 and 2
regarding the existence of overseas listing waves across host and home markets and industries.
For instance, we can see that while Japan was the second most attractive host market in the
1980s, the peak in its attractiveness occurred during the very late 1980s, coinciding with the
highest valuation of their equity market in 1989. However, the peak in the Japanese firms’ listings
overseas occurred about a decade earlier, at the end of the 1970s and beginning of the 1980s. The
United States as a host market experienced a number of waves in its attractiveness for foreign
stocks, including a period in the early 1970s and then again during the mid 1980s, as well as the
wave in the late 1990s and early 2000s.
By home countries, the listing abroad of Canadian firms is concentrated in the 1950s and
1980s, German firms is concentrated in the 1960s and late 1970s and early 1980s, Indian firms in
the late 1990s and 2000s, Japanese firms in the 1970s, and U.S. firms in the 1950s and 1970s.
Interesting patterns exist in industries as well. For instance, electronics experienced the first
run-up in the share of the total number of foreign listings in the late-1950s to mid-1960s. This period
coincided with the beginning of wide commercial use of transistors and first computers. It is also
not surprising to see that Telecom industry achieved its largest proportion in foreign listing
placements in the late 1990s. Mining firms were the largest providers of foreign listings in 1950s
and they, in fact, reached the highest absolute proportion of any single industry share in overseas
listing market during the entire sample period. Clearly, there is large country and
cross-industry variation in when firms choose to list abroad.
11
In Table 3, we present statistical evidence for the existence of foreign share placement
clusters in various host and home markets and industries. Panel A shows the clustering intensity
in each of the eight host markets. The intensity is the proportion of foreign listings per year in a
given host market relative to the total number of foreign listings in that year. The clusters are
defined based on the average Euclidean distance using the cut-off value of 0.075, i.e., in 7.5%
increments of cross-listing intensity. This implies that the first cluster (lowest ranking)
corresponds to the instances of complete absence of foreign listing activity in a given host market
or when this activity in that market is less than 7.5% a year. Consistent with Table 1, some
markets such as the Netherlands, the United Kingdom, and the United States have gone through
various levels of relative attractiveness over time (between five and seven clusters), while others,
such as Germany, Luxembourg, or Switzerland have only two or three cluster groups.
To determine whether the waves in foreign listings activity are statistically significant and
occur at different times from each other, we use correlation analysis. More specifically, we
compare the foreign listing intensity in each of the eight markets with the uniform distribution.
The bottom panel of Table 3 reports cross-correlations and their statistical significance between
the clusters of foreign listing intensity among the top eight host and home markets, as well as
industries and uniformly distributed random variable. The correlation coefficients with the
random variable are based on the average from 5,000 Monte Carlo Simulations. We use the
Dunn-Sidak adjustment to correct for standard errors. The panel offers two important
observations. First, the correlation between foreign listing intensity in each of top eight host
markets and the random variable is insignificant, implying that the waves of cross-listings are
indeed statistically different from a uniform distribution. Second, the only highly significant
correlation of listing intensity among our eight host markets is between France and the United
States, but it is negative, implying that generally waves of listings occur in different countries at
different times. The only positive but significant only at the 10% level correlation is found
12
countries had somewhat similar time-series dynamics in their relative attractiveness as markets
for overseas listing destination (also see Figure 1, Plot A).
Panels B and C of Table 3 show clustering intensity and correlation tests in each of the
eight most represented home markets and industries that contribute overseas listings, respectively.
Among the top home markets, the United States has seen the widest range of overseas listing
placement intensity (eight clusters). Note that Israel, although having numerous listings in the
1990s and 2000s, did not contribute any substantial volume to the total number of foreign listing
during those two decades. Across industries, the overall range of listing intensity is lower than for
the home or host markets. The industry panel shows that consumer goods, industrials and mining
all had time of very significant contribution to the overall count of foreign listings – these three
industries have five clusters, while support industry has only two. The correlation tests again
confirm that the dynamics of changes in the proportion of overseas listings across individual
home markets and industries is different from the uniform distribution.
2.5. Correlation Analysis
To provide a more rigorous analysis of the time series dimensions of the listing decisions
and the aggregate series, we perform the following analysis. We construct a variable N(i,j,k,t)
which measures the number of foreign listings from home market i and industry j in host market k
in year t. We use this variable for the top eight home markets, host markets, and industries over
the 1950 to 2006 period. We run the following regression
(
i,j,k,t)
bN( )
i,t b N( )
j,t bN( )
k,t b N( )
i,j bN( )
j,k b N( ) (
i,k ei,j,k,t)
N = 1 + 2 + 3 + 3 + 3 + 3 + (1)
where the independent variables are the aggregate number of listings across the specified
dimensions. N(i, t), N(k, t), and N(j, t) represents the total number of listings from the respective
home market, host market or industry, respectively, in the respective year. N(i, j), N(j, k), and
13
bilateral pair of specified characteristics. N(i, j) captures the global home-industry tendency. N(j,
k) captures the global industry-host tendency. N(i, k) captures the global home-host tendency. To
facilitate comparison of the regression coefficients across markets, the variables are transformed
by subtracting the sample mean and dividing by the sample standard deviation for the variable.
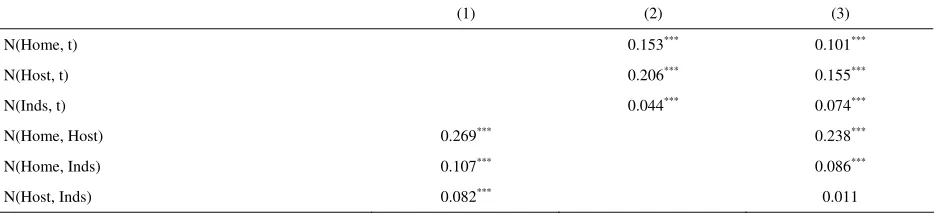
The results are reported in Table 4. The first specification contains only the bilateral pairs
variables N(i,j), N(j, k), and N(i, k). These variables control for the overall tendency for listings
to follow a particular bilateral profile such as that observed in Sarkissian and Schill (2004). The
coefficient on N(i, k) maintains the largest value at 0.269 suggesting that a unit standard deviation
increase in the tendency of firms to list across a bilateral pair of markets is associated with a
0.269 standard deviation increase in listing across the home-host market pair. Since the regression
represents regressing components of the distribution of listings on various dimensions of
aggregations of the distribution the residuals from the regression are not independent of the
regressors. This correlation biases the standard errors. Although we acknowledge this bias we
report the approximate statistical significance of the coefficients in the table for reference only.
Because the variables have been standardized, we can fairly compare the coefficient values across
variables. In specifications 2 and 3 we add the time-series aggregates to the regression, N(Home,
t), N(Host, t), and N(Inds, t). We observe that all of the aggregation dimensions seem to matter.
Listings tend to cluster by home market, host market, and industry group. However, the host
market effect seems to be the dominate one and the industry effect is the least important.
In Panels B, C, and D of Table 4 we report regression coefficient values by various
subsamples of host market, home market, and industry. Across these 24 regressions, the host
market time-series volume provides the dominate time series effect in 18 of the regression.
Exceptions include the regressions with the sum samples of only U.S. host market listings,
listings from Australia, Germany, India, and Japanese markets, and listings by financial firms.
For listings from Australia, India, and Japan it is the home market wave that appears to matter
more. For Germany, the industry wave is important. For listings in the United States, the waves
14
particularly cross list with other financial firms in addition to home and host market effects.
Mining firms tend to be particularly clustered by home market.
Thus, the time-series patterns of the cross-listing experience shown in Tables 1 through 4
as well as Figure 1 provide evidence that overseas listings tend to cluster in different foreign
markets in waves. The question is then what are the primary reason(s) which drive some host
markets to prominence during certain time periods. In the following sections, we explore the
answers to this question.
3. Foreign Listings and Host Country Performance
Having observed the clustering of foreign listings across the top eight host markets both in
economic and statistical terms, we now move to relating this evidence to their country-level
performance over time. Indeed, based even on casual observation from Figure 1 it appears that
many countries become major market for overseas listed securities during good economic times
and strong market performance.
We consider two main economic and financial market indicators – real GDP growth and
real equity market return in U.S. dollars. Besides, we use three other variables that are available
from 1950s for our main host markets for foreign listings. These are inflation, short-term bill
return in US dollars, and bond maturity premium (term spread), which is the difference in yields
between long-term bonds and short-term bills.
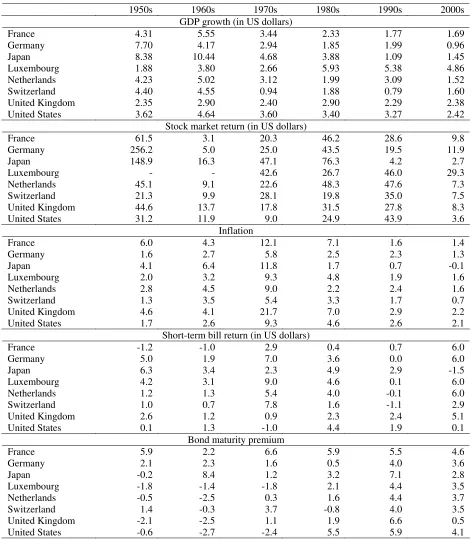
Table 5 shows the summary of these variables across the top eight host markets. The real
GDP values come from the historical statistics for the world economy by Angus Maddison.5 The
other four variables are provided by the Morningstar Dimson, Marsh, & Staunton global returns
database. All variables are reported in percent per year. We can see that often high GDP growth
rates and/or stock market return coincide with period of particularly strong foreign listing hosting
5
15
activity. For example, in the 2000s, the GDP growth rate was the highest in Luxembourg, the
United Kingdom, and the United States, and these three markets are the main destinations for
foreign shares in the same time period. Alternatively, GDP growth rate and market return were
very high in Japan in 1970s and 1980s, and we already from previous tables that Japan was a
major market for foreign firms specifically during those decades. However, when we look at
average numbers across calendar decades for the other three variables we are unable to detect any
consistent patterns. For example, the U.S. exchanges were the most prominent place for overseas
firms in the 1990s, yet its inflation, short-term bill return, or bond maturity premium is neither the
smallest not the largest at that time.
To visualize the aforementioned patterns more generally, in Figures 2 and 3, we present
scatterplots showing a cross-sectional relation between foreign shares being listed in a given host
market in a given decade and changes in its main economic and financial indicators, GDP and
stock market performance, respectively. We select two extreme decades with all ten years being
available, the 1950s and 1990s. For each decade we transform the number of foreign listed firms
logarithmically.6 We observe in both figures an upward trend in the scatterplots. As expected,
from previous results, there is also a big change in the leading host markets for foreign listings
from the 1950 to the end of the 20th century.
Our next step is to relate foreign listing activity to changes in economic and financial
conditions of a country in statistical terms. While a positive relation between country’s ability to
host foreign listings and its attractiveness as proxied by changes in its GDP growth and equity
market performance is interesting, this relation may not be robust after considering other potential
variables. Therefore, we now proceed to regression tests, where the dependent variable is the
number of foreign listings and the independent variables, besides annual changes in the GDP and
market performance, are the other three variables from Table 6, namely, inflation, bill return, and
maturity premium.
6
16
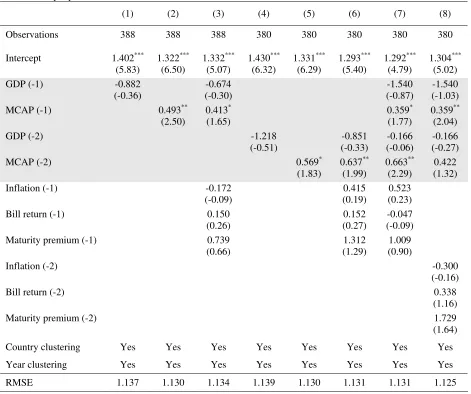
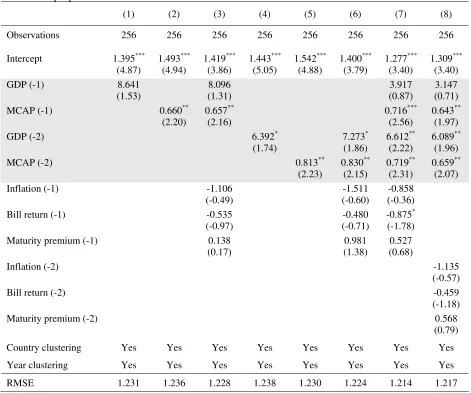
The test results are reported in Table 6 for the entire panel of foreign listings across the
top eight host markets and their respective economic and financial market performance measures.
Since it is likely that the decision about foreign listings in a particular host market is driven by the
observed performance of that market, we show the test results for either the first or the second
lags of changes in GDP and market performance. When the second lags of GDP growth and stock
market returns are used, for consistency, we use the first lags of the other three variables. In all
regressions, we double cluster standard errors by country and year as suggested by Petersen
(2009). The table reports the slope coefficients, their corresponding t-statistics, and the root mean
squared error for each regression specification. Panel A shows the tests results for the whole
sample, while Panel B focuses on the second sub-period, from 1975 till 2006. Across both panels,
Regressions 1 and 2 as well as 4 and 5 show simple bivariate tests between new listings in a
given year and lagged annual changes in the GDP or the equity market. Regressions 3 and 6
include all five independent variables. Finally, Regressions 7 and 8 include both lags of both
relative market development proxies with the first and the second lags of the other three
variables, respectively.
In both panels of Table 6, we observe a positive and consistently significant (most often at
the standard 5% level) coefficient on stock market performance, irrespective of the lag of this
measure. This confirms that domestic stock market outperformance in a country which is in the
pool of potential host markets for foreign listings, is drastically increases the chances of this
market to attract more foreign shares. We can make the same statement for the second lag of the
GDP growth, although it manifests itself only the latter part of the sample in Panel B.
Importantly, the three other variables effectively do not show significance in any of the samples
or test specifications (except one case in Panel B at the 10% level), confirming our earlier
observation that among the set of various economic and financial variables, such country
aggregates as GDP growth and stock market return seem to be the most important determinants of
17
To account for the changing competitiveness of the main markets for foreign stocks over
time, we now construct two measures of relative market performance for each of the top eight
home and host countries, namely:
(
)
∑
= − − ⎟ ⎟ ⎠ ⎞ ⎜ ⎜ ⎝ ⎛ − ⎟ ⎟ ⎠ ⎞ ⎜ ⎜ ⎝ ⎛ = 8 1i i,t 5
t i, 8 1 5 t i, t i, t i, GDP GDP GDP GDP GDP
R . (2)
and
(
)
∑
= − − ⎟ ⎟ ⎠ ⎞ ⎜ ⎜ ⎝ ⎛ − ⎟ ⎟ ⎠ ⎞ ⎜ ⎜ ⎝ ⎛ = 8 1i i,t 5
t i, 8 1 5 t i, t i, t i, MCAP MCAP MCAP MCAP MCAP
R , (3)
where GDPi,t and MCAPi,t are the GDP and stock market capitalization of country i in year t,
respectively, while R(GDPi,t) and R(MCAPi,t) denote the relative valuation of a country’s real
economy and financial market, respectively, vis-à-vis other countries. We standardize market
capitalization to unity in 1946 and compute subsequent values using available stock market return
index data.7
We highlight the important linkage between listing activity in a given host market and
county’s performance in the top eight host markets over the 1950-2006 period in Figures 4 and 5.
In Figure 4, we plot the dynamics of foreign listing placement (foreign listing intensity, FLI,
defined as the annual share in global foreign listings) together with relative host country GDP
growth using equation (2). In Figure 5, we plot foreign listing intensity together with relative host
market performance using equation (3). To facilitate the comparability between listing intensity
and relative market performance measures, all three variables are averaged over the preceding
five years including the current year. 8
7
To avoid the post World War Two impact on the economies of Germany and Japan, both their relative country performance measures start in 1965.
8
18
We observe many synchronous waves in the proportion of listings across host markets
and their relative GDPs and especially their relative market performances. For example, France
was attracting many foreign listings in the 1950 and 1960s and its relative market performance
was the highest over the whole sample during this time period. Germany exhibits a coherency in
the foreign listing intensity and relative GDP growth both of which had their troughs in the
mid-1980s and first peaks in the 1970s. Japan shows an amazing synchronicity between hosting
foreign listings and its relative market performance, so that the peaks in both these time-series
occur in the 1970s and 1980s. Luxembourg has a sizable upward trend in hosing of foreign
listings and relative GDP growth over the whole 57-year sample period, while its relative market
performance closely matches peaks in the listing activity towards the late 1970-s and after 1990s.
Such markets as the Netherlands and Switzerland seem to display a bit lower visible
correlation between their foreign listing attractiveness potential and their respective two relative
country-wide performance measures over the whole sample period. Yet, over significant
sub-periods the relation between those series is again quite substantial (e.g., a period between 1950s
and late-1980s for Switzerland). For the United Kingdom, we can observe that both performance
measures generally match the inverse U-shaped pattern of foreign listing activity between 1950s
and 1970s and 1980s, while the country’s relative GDP growth shows synchronous movements
with listings from the 1980s till the end of the sample period. One can also easily notice a strong
relation between the changes in foreign listing intensity and market performance in the United
States. The correlation is observed from 1970 until the end of the sample in 2006. Thus, Figures 4
and 5 confirm the link between a country’s financial and economic development and its increased
probability of becoming an attractive place for foreign listings.
In the Appendix, we list significant economic and financial market events in the seven
major host markets for foreign listings outside the United States that can be linked to the changes
in their relative foreign listing attractiveness and relative market performance over time. For
instance, the relative outperformance of France in the 1960s both in economic terms and as a host
19
example is Japan: the first wave of foreign listing in that market of the mid-1970s occurred right
after it opened its Foreign Stock Section on the Tokyo Stock Exchange in 1973, while the second
wave of the mid- to late-1980s followed after the beginning of large-scale privatization process
that started in 1984.9
In sum, we find strong evidence that foreign listing activity tends to cluster in certain
countries during certain time periods. These cross-listing waves may occur in a given host market
when it does relatively well (based on various performance measures) with respect to other
competing host markets for overseas listings. Listings also move to foreign markets where the
relative performance of home markets is strong. Since the ability of a country to attract foreign
shares can be viewed as some measure of the country’s overall financial market activity, our
findings are consistent Rajan and Zingales (2003) who document that the development of the
financial sector is not a monotonic process across countries and the time dimension.10
4. Valuation under Different Foreign Listing Intensity Periods
Given strong evidence of cross listing waves at the host and home market as well as
industry levels, our valuation tests are designed to look at the magnitude of valuation gains to
listing in the United States and elsewhere during specific periods of intense listing activity. Given
substantial time-series variations in foreign listings, we should expect that periods of intense
listing activity are associated with particularly strong short- and especially long-term valuation
benefits. For example, the evidence of a surge of listings in Tokyo in the 1980s suggests, by
9
Fernandes and Giannetti (2008) also find that time-series changes in exchange listing are correlated with equity market and real economy effects. In addition, they find that investor protection variables explain additional time-series effects in cross listings. We are cautious about their conclusions as many of these variables are static and therefore may be considered poor regressors in explaining large time-series variations in overseas listing activity. Also, the risk of spurious regression bias becomes problematic with highly autocorrelated variables (see Granger, Hyung, and Jeon, 2001).
10
20
revealed preference, that the gains to listing in Tokyo in the 1980s must have been relatively
strong. In a similar manner, we postulate that waves in listings from a particular home market or
industry suggest periods of particular gains to be realized to foreign listing for firms from that
market or industry.
All firm valuation ratios and characteristic controls for U.S. firms are from Compustat,
and from Worldscope for non-U.S. firms. Our initial dataset contains the full panel of world firms
(whether cross listed or not). To establish the appropriate control firms we omit firms from those
countries that do not have any stock traded overseas based on our cross-listing sample (e.g.,
Pakistan). We also allocate firms into fifteen industry groups based on the detailed industry
definitions in Compustat (SIC codes) and Worldscope (industry descriptions). These industry
groups are Chemicals, Construction, Consumer Goods (automobiles, personal goods, and food),
Financials, Healthcare (pharmaceuticals, biotechnology, and medical equipment), Leisure,
Industrial Goods, Oil & Gas, Resources (industrial metals, mining, and forestry and paper),
Distributors (retail and wholesale), Support Services (including all business, engineering, legal,
and medical services), Technology (electronic and computer equipment, software),
Telecommunications (including media), Transportation, and Utilities.11 To construct our
valuation measure, Tobin’s Q, for each firm, we follow the established practice in the literature.
Specifically, we define Q as follows:
Value Asset Total
Equity of
Value Market Equity
of Value Book Value
Asset Total
Q= − + . (4)
The full sample is a panel of 228,060 firm-year observations across 55 countries and the 22-year
sample period. This is the same sample as in Sarkissian and Schill (2009). Following Doidge, et
al. (2009), we control for a firm sales growth, defined as the inflation-adjusted two-year
11
21
geometric average net sales growth, and a firm size, defined as the natural logarithm of a firm’s
net sales.
Table 7 shows mean and standard deviation of Tobin’s Q, net sales, and sales growth.
Panel A reports these statistics separately for firms with foreign listings and those without foreign
listings for the whole sample period as well as two equal eleven-year sub-periods, 1985-1995 and
1996-2006. The listing sub-sample has 15,957 observations, the non-listing – 212,103. The
average firm Q for both listed and non-listed firms in foreign markets is higher in the second
period. This pattern is not observed for other two firm characteristics. Also, we see that on
average Tobin’s Q of listed companies is no higher than that of companies with only domestic
presence. However, this could be the result of an impact of highly valued U.S. firms with no
presence on foreign exchanges. In addition, any valuation differences can be related to
differences in firm size that this panel does not control for.
Panel B of Table 7 shows firm characteristics over three periods around the foreign listing
event: pre-listing years, listing year, and post-listing years. Consistent with previous studies, we
see on firms are valued more in the year of listing than before or after the event. The average Q of
firms in the listing year is almost 1.9 versus close to 1.7 before or after the listing. The caveat
here though is to remember that firm’s Q may reach its maximum prior to the listing year (e.g.,
see Sarkissian and Schill, 2010) or, possibly, after, but our numbers show the averages over the
whole sample period before and after the listing. Interestingly, foreign listings do not seem to
enhance company’s growth opportunities – the average sales growth after the listing is smaller
than prior to the listing.
Our proxy for the foreign listing intensity (FLI) in a given host market, home market, or
industry is the proportion of global overseas listing in a particular year for that host market, home
market, or industry. We extend the test specifications in Doidge, et al. (2009) and Sarkissian and
Schill (2009) by adding interaction variables that link the series of dummy variables for foreign
22
( )
( )
( )
(
)
j,t t k k i,t 3 j,t 2 j,t 1 j , FLI j j i j,t ε Effects Year γ Effects Industry γ Q Firm γ Q Home γ Log(Sales) γ th Sales Grow γ , Market FLI FL δ FL δ FL δ α Q + + + + + + + + + × τ + τ + < + =∑
∑
+ = τ τ + = τ τ − 6 5 4 4 0 4 01 0 0
. (5)
In this regression model, Qj,t is the Tobin’s Q of firm j in year t of the listing firm. FL(τ)j denotes
an indicator variable that is equal to 1 in year τ before or after the foreign listing year for firm j,
and τ is between -4 and +4. To conserve space and improve the tractability of results, we
aggregate all pre-listing dummies into a single dummy variable, FL(< 0). Year +4 denotes all
years on or beyond the forth year after the listing.12 FLI(Market, 0) is the foreign listing intensity
of the host, home, or industry market in the listing year of firm j. Furthermore, given home
market performance’s impact on the valuation of cross-listed firms, we also account for the
annual home market Q (Home Q), firm pre-listing Q (Firm Q), as well as fixed industry and
calendar year effects. In all regressions, errors are clustered by firm. Since we are interested in the
after-listing performance, we interact FLI(Market, 0) only with post-listing indicators.
Table 8 presents the estimation results for all firms and listings and for the sub-sample
that excludes U.S. firms. It reports the number of observations, point estimates, and the
t-statistics. The first four columns give the estimation results for all firms and listings under four
foreign listing intensity control scenarios: none, host market, home market, and industry. We
observe in column one that without the interaction with listing intensity terms the valuation there
is a significant increase in the Q premium among cross-listed firms in the listing year, as shown
in many studies. The magnitude of the valuation premium diminishes in economic and statistical
terms over the four years after the listing. In this pooled test, the valuation premium drops in
magnitude to negative values starting from the second year after the listing. The next three
columns add the interactive coefficients between listing year dummies and three foreign listings
intensity variables: host, home, and industry. Importantly, the second column shows that firms
12
23
that list their shares in host markets that attract high proportion of the overall count of foreign
listings experience extraordinary bad performance in the long-run. The coefficient on the
extended interaction term, FL(≥+4)×FLI(Host, 0), is negative and significant at the 5% level. In
columns 3 and 4, we also observe rather negative valuation effects for foreign listings coming
from active home markets and industries, especially in the medium-term of three years after the
listing, although the long-run effect remains insignificant.
Columns five to eight of Table 8 repeat the earlier estimation but without U.S. firms.
Since U.S. firms constitute a large part of our firm and listing samples, their relative valuation can
impact the overall results. As before, for the first specification we observe a temporary positive
and highly significant valuation effect in the year of listing that quickly dissipates to below zero
values in subsequent years. In this case, the long-run valuation of cross-listed firms is
significantly more negative than that for the control group, consistent with Sarkissian and Schill
(2010). Interestingly, the second column shows that firm valuation is markedly higher in the
listing year in host markets that attract high proportion of the overall count of foreign listings.
The coefficient value on the interactive listing year variable is statistically significant at the 5%
level. This suggests that listing firms are associated with a certain level of valuation uplift when
they list in markets that attract a large proportion of foreign listings. The general uplift in
valuation, however, is extremely short lived. The abnormal Q ratio drops to a highly significant
negative levels by the year four after the listing and remains at that level thereafter. It appears that
non-U.S. firms that list during surges in host market activity are associated with worse long-term
valuation effects than those that list during a less intense period. In columns 7 and 8, we find no
important valuation patterns for listings off home or industry surges in listing activity, except for
the temporary valuation gain in the listing year that takes place on the industry wave.
Our results in Table 8 highlight a particular importance of the host market listing intensity
on long-term valuation dynamics of cross-listed firms. Therefore, we now estimate equation (5)
for each of the top eight host markets separately. Since our valuation sample coincides with the
24
the table is the changes in Tobin’s Q after the cross-listing for firms placed on U.S. exchanges.
The U.S. non-interactive cross listing indictors show no significance and no trends across the
entire event window. However, the interactive post-listing terms show a steady downtrend. While
the coefficient on FL(0)×FLI(Host, 0) is positive and marginally significant, the slopes on further
terms are quickly decreasing becoming strongly negative and significant after the fourth year
after the listing. This implies that firms do not tend to achieve any systematic valuation benefits
regardless of whether they place their overseas listings on U.S. exchanges during or outside of the
U.S. host market listing wave. There is very little pattern in valuation gains across the other host
countries and no evidence of sustained gains in the intense listing periods. There is a modestly
positive coefficient on the extended-term interactive Luxembourg variable, but the volatility in
the coefficients over the preceding years make the positive sign less tenable. Our conclusion is
that firms listing abroad do not appear to achieve any sustained valuation benefits even when the
listings occur during periods of intense listing activity.
Thus, consistent with Gozzi et al. (2008) and Sarkissian and Schill (2009, 2010), we show
that even when one looks at the periods of most intense foreign listing activity in the host or
home market or industry, there is no evidence of long-term valuation benefits to cross listing.
Yet, the temporary gains in valuation of cross-listed companies that are widely documented in the
literature tend to occur specifically in times when firms place their shares in those host markets
that exhibit an extraordinary high attractiveness for overseas listings.
5. Conclusion
This study makes three important contributions to the literature on overseas listings. First,
we document the extent of waves in cross-border listing at the host market, home market, and
industry level over a more than fifty-year year chronology. A substantial portion of host market
25
maintain some bilateral appeal over the sample period. Second, we find that the relative
performance of the equity market and the real economy provide explanatory power for the time
series of host market and home market listings. This relation is widely present across all major
host markets, and it is immune to other macroeconomic and financial variables. Third, we find
that foreign listing waves are associated with systematic value gains to those firms that list
abroad, and that such gains are transitory. Moreover, the long-term valuation of firms with
overseas listings placed in the most popular host markets is lower than that firms that are placed
on foreign exchanges outside their most attractive time periods.
Our findings are consistent with Rajan and Zingales (2003) in that we provide new
evidence that market development changes across countries and over time, since the changing
ability of a country to attract foreign shares can be viewed as a measure of the country’s overall
financial market activity. We also show the general irrelevance of the access to more developed
(highly valued) foreign capital markets at the firm level, similar to the country-level results in
Rajan, et al. (2007).
Appendix
Significant economic and financial events in major host markets for overseas listings outside the United States during the second half of the 20th century
France
Date Event
1956 Suez Canal crisis
1958 Payments related to current account transactions were liberalised. 1965-1967 Liberalization of the French financial markets.
1982 Nationalization of 36 deposit banks, increasing influence of the government. 1983 Second Marché for small and medium-sized enterprises is opened.
1983 Venture capital mutual investment funds were introduced. 1984-1986 Trade-related operations were gradually liberalised.
1986 The beginning of large-scale privatizations starting with the privatization of Saint Gobain. 1986 Currency hedging for foreign currency denominated imports was totally liberalised. 1986 French residents were allowed to freely buy shares listed on foreign markets.
26
1988 Elimination of lending restrictions and currency controls and removed many of the administrative barriers that had compartmentalised credit institutions’ business in Europe. 1989 Residents were allowed to freely open and keep foreign currency denominated accounts in
France and foreign currency and franc-denominated accounts abroad. 1989 Abolition all remaining foreign exchange controls.
1996 Creation of the Nouveau Marché
1997 Creation of the Banque du développement des PME for small and medium-sized firms. 1998 Law of 1998 created the new accounting standards’ setting body, the Comité de la
réglementation comptable – CRC.
1999 Creation of ParisBourse
2000 Creation of Euronext
Germany
Date Event
1959 Minor Reform of Stock Corporation Law to stimulate stock demand among working class people, including the restructuring of income statements, and allowing a company to purchase its own stocks in order to allocate shares to their employees.
1965 Major Reform of Stock Corporation Law (Law regarding the capital increase through a company’s own resources) including increase in incentives to strengthen stock holders’ rights within a business, provision of better and faster information for shareholders, limitation of membership in supervisory boards of public limited companies.
1969 Company Disclosure Law on the extension of company information requirements. 1970 Introduction of forward and futures trading.
1975 Amendment of the Stock Exchange Act, which included improvement of self-administration of exchanges, strengthening of exchange brokers’ status, obligation to establish official broker chambers, reorganization of penal provisions.
1976 Abolition of double taxation of stocks.
1989 Amendment of the Stock Exchange Act made legal prerequisites for electronic platform for exchange trading, forward and futures trading, and notation of securities in foreign currencies and units of account.
1990 Reunification of Germany.
1990 First Financial Markets Advancement Law that included the abolition of tax charges, broader business opportunities for investment companies, and the admission of restricted funds and fixed income funds.
1994 Second Financial Markets Advancement Law that included the implementation of the European Investment Services Directive and the Foundation of the Federal Securities Supervisory Office. 1998 Third Financial Markets Advancement Law on the adjustment of investment company law
including the facilitation of admission to the exchange for new issuers.
Japan
Date Event
1956 Bond market reopened.
1966 Japan becomes a member of the OECD and agrees to liberalize its capital markets.
1970 Tokyo Stock Exchange (TSE) joined FIBV, the International Federation of Stock Exchanges
1973 Foreign Stock Section opened.
1980 The new Foreign Exchange and Foreign Control Law is in effect that decontrol international capital flows.
27
banking business and thus the promotion of the healthy development of the national economy. 1982 Constitutional restrictions on the membership of foreign securities companies removed. 1984 The beginning of large-scale privatizations.
1986 The Tokyo exchange permits non-Japanese brokerage firms to become members. 1989 Tokyo International Financial Futures Exchange (TIFFE) established
1996 The Financial System Reform, “Japanese Big Bang” started. Under the three principles of “free, fair, and global,” aiming to rebuild the Japanese financial market into an international market comparable to the New York and London markets.
1998 Abolition of restriction on off-exchange trading for listed securities. 2000 Nasdaq Japan Market of the OSE established.
Luxembourg
Date Event
1959 Creation of the Luxembourg’s first “Fonds Commun de Placement” (FCP) (mutual funds). 1963 The first Eurobond, denominated in Eurodollars, is issued in Luxembourg because of low costs
involved and the favourable tax regime.
1969 The world’s first international foreign-currency bond was quoted in Luxembourg.
1970 Luxembourg becomes member of ICSID.
1983 Creation of the Luxembourg Monetary Institute (IML), which is responsible, in particular, for the supervision of the financial sector and for issuing currency.
1984 Adopted the European Union's Fourth Directive. Introduced special financial reporting regulations in Luxembourg.
1990 Grand-Ducal regulation which laid down current issuance and listing procedures.
1993 Law on the Financial Sector provided a solid foundation for the fight against money laundering and financing of terrorism.
1998 Creation of the BCL – Banque centrale du Luxembourg.
2001 Law on the circulation of securities and other financial instruments.
The Netherlands
Date Event
1961 Following the deutschemark, the guilder was devalued.
1985 Securities Trading Act which regulates the fight against undesirable developments that arise in the securities trade.
1990 The Acts on the Supervision of Collective Investment Schemes and Investment Institutes are passed for the promotion of adequate functioning of the financial and securities markets and protection of (potential) investors in these markets.
1996 Disclosure of Major Holdings in Listed Companies Act.
1997 The Amsterdam Stock Exchange and the European Option Exchange merged.
1998 The Bank Act is passed aimed at the implementation of monetary policy within the European Community (EC), and the supervision of banks, investment institutions, and exchange offices.
Switzerland
Date Event
28
1953 National Bank Law that designated the Swiss National Bank to carry out the tasks which the Confederation has assigned to it in the fields of payment transactions, coinage, administration of moneys and securities, investment of public funds, administration of the national debt and issue of bonds. It must advise the federal authorities in monetary matters.
1959 Switzerland became a member of the European Free Trade.
1979 Foreigners were first permitted to acquire Swiss Franc denominated assets.
1993 The settlement process was reformed and offered additional services such as value date monitoring and cash-planning. This change speeds the settlement process, making the market more liquid.
1995 Switzerland’s three stock exchanges in Geneva, Basle and Zurich are merged to form the SWX. 1996 Inauguration of the fully automated trading, clearing and settlement system, SegaInterSettle AG,
(SIS). It becomes the hub of Swiss securities trading, the central depository for all Swiss stocks and debt securities, and the central clearing organisation for all transactions in Swiss securities. In addition, SIS settles international transactions in Swiss securities through its SECOM system. 1998 Merger of the Swiss and German derivatives markets (SOFFEX and DTB) to form Eurex as the
first trans-national derivatives exchange.
1999 Inauguration of SWX Repo, the world’s first fully integrated, electronic repo trading platform. Admission of participants from France, Germany, and the United Kingdom. Start of the SWX New Market segment for growth companies.
2000 SWX Repo is integrated into Eurex. Launch of SNMI, the SWX New Market Index.
United Kingdom
Date Event
1951 Bank rate restored to control the monetary system in Britain.
1956 Suez Canal crisis.
1967 Pound is devalued against the dollar, from $2.80 to $2.40. 1971 Competition and Credit Control Act ended interest rate cartel.
1973 Eleven British and Irish regional exchanges amalgamate with the London Stock Exchange.
1973-1974 Secondary banking crisis.
1979 Abolishing all foreign exchange controls.
1979 The beginning of large-scale privatizations starting with the privatization of British Petroleum. 1982 The London International Financial Futures and Options Exchange established.
1986 London Stock Exchange's “Big Bang” changes which allowed the ownership of member firms by an outside corporation, abolished the minimum scales of commission, stripped individual members from having voting rights, allowed all firms become broker/dealers able to operate in a dual capacity, moved trading from being conducted face-to-face on a market floor to being performed via computer and telephone from separate dealing rooms, made the Exchange a private limited company.
1990 Britain joins the European Exchange Rate Mechanism, a decision motivated, at least in part, by Britain's repeated failure to meet its money supply targets.
1992 Britain leaves the European Exchange Rate Mechanism after massive international speculation. 1995 Establishment of the Alternative Investment Market (AIM) on the London Stock Exchange. 1997 The Chancellor of the Exchequer announced the reform of financial services regulation in the
United Kingdom and the creation of a new regulator, the Financial Services Authority (FSA). 1998 The first stage of reforms of financial services regulation included the transfer of responsibility
for banking supervision from the FSA to the Bank of England.
29
References:
Benos, E. and M.S. Weisbach, 2004, Private benefits and cross-listings in the United States,
Emerging Markets Review 5, 217-240.
Berger, P.G., F. Li, and M.H.F. Wong, 2005, The impact of Sarbanes-Oxley on cross-listed companies, Working paper, University of Chicago.
Biddle, G., and S. Saudagaran, 1992, Financial disclosure levels and foreign stock exchange
listing decisions, Journal of International Financial Management and Accounting 4, 106-148.
Black, F., 1974, International capital market equilibrium with investment barriers, Journal of
Financial Economics 1, 337-352.
Chaplinsky, S., L. Ramchand, 2008, From listing to delisting: Foreign firms’ entry and exit from the U.S., Working paper, Darden School.
Coffee, J., 1999, The future as history: the prospects for global convergence in corporate
governance and its implications, Northwestern Law Review 93, 641-708.
Coffee, J., 2002, Racing towards the top? The impact of cross-listings and stock market competition on international corporate governance, Working paper, Columbia University.
Dittmar, A., R. Dittmar, 2008, The timing of financing decisions: An examination of the
correlation in financing waves, Journal of Financial Economics 90, 59-83.
Doidge, C., 2004, U.S. cross-listings and the private benefits of control: Evidence from dual class
firms, Journal of Financial Economics, 72, 519-553.
Doidge, C., G.A. Karolyi, and R. Stulz, 2004, Why are foreign firms listed in the U.S. worth
more?, Journal of Financial Economics 71, 205-238.
Doidge, C., G.A. Karolyi, and R. Stulz, 2007, Why do countries matter so much for corporate
governance?, Journal of Financial Economics 86, 1-39.
Doidge, C., G.A. Karolyi, and R. Stulz, 2009, Why has New York become less competitive than
London in global markets? Evaluating foreign listing choices over time, Journal of Financial
Economics 91, 253-277.
Doidge, C., G.A. Karolyi, and R. Stulz, 2010, Why do foreign firms leave U.S. equity markets? Working paper, University of Toronto.
Domowitz, I., J. Glen, and A. Madhavan, 1998, International cross-listing and order flow
migration: Evidence from an emerging market, Journal of Finance 53, 2001-2027.
Errunza, V. and E. Losq, 1985, International asset pricing under mild segmentation: Theory and
tests, Journal of Finance 40, 105-124.
Errunza, V. and D. Miller, 2000, Market segmentation and the cost of capital in international
equity markets, Journal of Financial and Quantitative Analysis, 35, 577-600.