http://dx.doi.org/10.4236/nr.2013.48062
Does Climatic Variability Influence Agricultural Land
Prices under Differing Uses? The Texas High Plains Case
Rachna Tewari1, Jeff Johnson2, Darren Hudson2, Chenggang Wang2, Dennis Patterson3
1Department of Agriculture, Geosciences, and Natural Resources, The University of Tennessee at Martin, Martin, USA; 2Department
of Agricultural and Applied Economics, Texas Tech University, Lubbock, USA; 3Department of Political Science, Texas Tech
Uni-versity, Lubbock, USA. Email: [email protected]
Received October 7th,2013; revised November 9th, 2013; accepted November 30th, 2013
Copyright © 2013 Rachna Tewari etal. This is an open access article distributed under the Creative Commons Attribution License, which permits unrestricted use, distribution, and reproduction in any medium, provided the original work is properly cited. In accor- dance of the Creative Commons Attribution License all Copyrights © 2013 are reserved for SCIRP and the owner of the intellectual property Rachna Tewari etal. All Copyright © 2013 are guarded by law and by SCIRP as a guardian.
ABSTRACT
The Texas High Plains faces projections of increasing temperature and declining precipitation in the future on account of its semi-arid climate. This research evaluated the impact of climatic variability on agricultural land prices under dif- ferent land uses in the Texas High Plains, employing the Ricardian approach of land climate pricing over a study period of 1991-2011. The results indicate that climatic variability had a greater impact on irrigated land prices as compared to dryland and ranchland. This study could be instrumental in predictive market analyses of rural land values in semi-arid economies which are vulnerable to future climate change.
Keywords: Climatic Variability; Dryland; Irrigated Land; Land Prices; Ranchland; Texas High Plains
1. Introduction
The Texas Southern High Plains is a semi-arid region with a strong agricultural economy and is greatly im- pacted by changes in climatic factors which directly in- fluence the agricultural productivity in the long run. A sizeable proportion of the land in the region is main- tained for agricultural and rangeland uses [1]. The pro- ductivity of a particular land tract is reflected in land values, which can vary from one tract to another, depend- ing on the fertility, soil type, precipitation, and groundwa- ter availability for irrigation, which in turn affect land quality. In this manner, per unit land values clearly vary between irrigated cropland, dryland and rangeland. The 4th assessment report by the International Panel on Cli- mate Change [2] predicted significant impacts on the agricultural productivity of a transitional area like the Texas High Plains. With projections of increasing tem- perature and declining precipitation for the region, there will be a definitive impact on the agricultural productiv- ity and land values in the region. This impacts the real estate markets for agricultural land as irrigated land tends to become scarce in the future. The importance of agri- cultural land itself and changes in agricultural land val-
failures and diminished yields, which led to a decline in the inventory of good irrigated land in the North Panhan- dle and the South Plains of Texas. The report also indi-cates that there continues to be a strong demand throughout the region for most classes of irrigated cropland with even weak or marginal irrigation water. In this manner, any climatic change or abnormality, such as drought, strongly influences the land values in a region, as is evi- dent from the current scenario described above.
2. Background
The underlying theory of relating climate variables to the land value is derived from the Ricardian theory which argues that, ceteris paribus, the land with the most suit- able climate for the highest valued crop will generate the greatest net revenue (rent) in a region [4]. In this way, potential rents are proportional to the market value of a farm, and land uses are reflected by land value [5]. This clearly indicates that variations in climate will result in varying land use and production, which impacts the prof- itability and consequently the land values. The sustain- ability and viability of an agricultural economy, in areas such as the Texas High Plains, depend on the adaptive capabilities of producers in the region to tailor their management and production strategies to climatic and market shocks. As described above, this consequently affects the variations in land use and land values, which becomes all the more apparent given the predictions of bigger shocks in regional climates in the forthcoming time periods. Prior studies in the Texas High Plains that considered the assessment of these changes on land prices from the perspective of climatic variability are limited. Therefore, an economic analysis of the effect of these variations on agricultural land prices under differing uses provides a starting point to develop a framework for land-climate pricing models in the study region using a Ricardian approach. The objective of this study is the quantification of the potential impacts of change in cli- mate on agricultural land values in the Texas High Plains. This study adopts a Ricardian approach to evaluate the impact of climatic variables on the agricultural land val- ues based on land use; specifically irrigated cropland, dryland, and ranchland in the Northern and Southern High Plains of Texas. This is accomplished by develop- ing a seasonal land-climate pricing model to estimate the economic impact of climate and non-climate variables on the agricultural land prices in the Northern and Southern High Plains of Texas for the period 1991-2011, on a quarterly basis.
3. Prior Work
This literature review emphasizes the suitability of the Ricardian approach to assess the economic impact of
climatic factors on the agricultural land values. We re- view the available studies related to assessing the eco- nomic impact of climatic variability on agricultural land values to establish a foundation for developing the con- ceptual framework for the current study.
pable of observing changes that occur in the immediate affecting climate, and will adapt to the climatic changes in a cost-effective manner. However, several studies have concluded that producers adjust their estimate of the true climate at a much slower pace than assumed, resulting in a rather expensive adjustment [8]. In spite of the above limitations, the Ricardian model still provides a fair es- timation of the impacts of changes in climatic factors on agricultural land values, and can be applied to different regions. The Ricardian approach for estimating the eco- nomic effects of climate change on agriculture has been widely used across various countries and regions include- ing United States, Canada, South East Asia, Europe, and South America. The following section of this literature review provides a description of some important studies that will prove useful in developing an understanding of the approach and applying it to the current study.
In their widely acclaimed paper that employed a Ri- cardian approach for valuing economic impacts of cli- mate [4] set up a cross-sectional analysis which regresses per acre farm values for almost 3000 counties across the United States on different climatic, economic and geo- physical variables. The results suggested that higher tem- peratures in all seasons except autumn led to reduced average farm values, while more precipitation outside of autumn increased farm values. They discovered that a quadratic relationship exists between farm land value and climate variables (normal daily mean temperature and normal precipitation). In terms of monetary impacts, their results indicated that in the United States, farm value impacts range from a loss of $5.8 billion to a gain of $36.6 billion, depending on the type of model and global warming climate scenarios used. Following their initial approach as mentioned above [9] applied the above method to per acre aggregate farm values on a county basis. They concluded that climate change has a twofold impact which extends to both existing farm values and the like- lihood of farming the land or not. Further [7] extended the Ricardian method to incorporate inter-annual tem- perature and precipitation changes and concluded that the model showed a higher sensitivity to inter-annual tem- perature variations than the inter-annual precipitation changes. In another interesting study by [10], which was an extension to the previous study by [4], the impact of surface water withdrawal on farm value variations was evaluated. In addition, this study also evaluated the cli- mate sensitivity of agricultural production across the United States. This study concluded that although irri- gated cropland values increased with temperature, they were not sensitive to changes in precipitation. The study concluded that expansion of irrigated agriculture could prove beneficial for farmers as an adaptive measure for dealing with climatic changes.
Following the above studies by Mendelsohn and co-
authors, several other studies in the last decade studied the impact on climate change by incorporating irrigation changes and other factors on agricultural land values and agricultural profits in the U.S. [11] expanded the above mentioned Ricardian studies to correct for potential bias in the model for inadequate representation of irrigation treatments, and concluded that using more accurate meas- ures to represent climate variables will increase the ro- bustness of the model.The study resulted in concluding an annual loss in profits ranging from $5 to $5.3 billion for the U.S. counties. In a subsequent study [12] used individual farms data sets to assess the impact of climate and irrigation water availability on farm land value of California. The findings of the study indicate that heat- ing-degree days and irrigation water, both had a signifi- cant influence on agricultural land values in California. [13] analyzed the impacts of random variations in tem- perature and precipitation on U.S. agricultural profits on a year to year basis. The results of the study indicated a 4 percent increase in profitability on an annual basis (amounting to $1.3 billion in 2002 dollars), as attributed to climate change. The findings of [13] appear to dis- agree with the widespread view about the negative wel- fare impacts of climate change on the U.S. agricultural sector [6].
Cone region and the Andean region of South America. In order to predict climate change impacts for this century, they examined severe, less severe, and mild climate change scenarios as predicted by three Atmospheric Oceanic General Circulation Models. Under predictions for all the three scenarios, farmland values decrease with increasing levels of severity with increase in both temperature and rainfall with the exception of irrigated farms. The decline in farmland values becomes higher with increasing levels of severity. The study also concluded that small farms are more vulnerable to increasing temperatures, while large farms are more vulnerable to precipitation increase. [16] studied the impact of change in climate normals on the agricultural sector in Pakistan. They employed a cross sectional Ricardian model for eleven districts in Punjab region of Pakistan to assess the impacts of climate change on agricultural land values by including two major sea- sonal variables, namely Kharif (rainy season) and Rabi (winter season). These two variables are crucial to the agricultural sector in the study region, as they represent seasons in the context of sowing and harvesting time periods. The results of the study inferred that mean pre- cipitation and mean minimum Kharif temperatures show a significant positive relationship with land prices, while mean maximum Kharif temperature showed no statistical significance with land prices. On the other hand, precipi- tation and mean minimum temperature in Rabi season showed a significant negative relationship with land prices, while mean maximum Rabi temperature showed a sig- nificant positive relationship with land prices. Further, [6] has suggested that the land climate price model can be used to estimate the impact of climatic, socio-economic, and geographical variables in valuing agricultural land which allows measuring of the marginal contribution of the attributes in order to capitalize the land value.
4. Data and Methods
This study specifically evaluates impacts of variations in weather and climate on agricultural land prices in two major agricultural production areas of the Texas High Plains: 1) Northern High Plains, and 2) Southern High Plains. The study area is presented in Figure 1.
Most studies measuring the economic impact of cli- matic factors on agricultural sectors have used spatial price models across different locations that relate to a single year, as the availability of time series data on sales or rental prices for different types of agricultural lands is limited. However, this study uses continuous time series data available on a quarterly basis for different land uses in the Texas High Plains, which is an addition to existing literature pertaining to land climate economic analyses in the study area. The land values under differing land uses are procured for the 1st and 2nd districts from the Agri- cultural Survey data of the Eleventh Federal Reserve
Figure1. Study area-Northern and Southern High Plains Districts from the Agricultural Survey of Federal Reserve bank of Dallas [19].
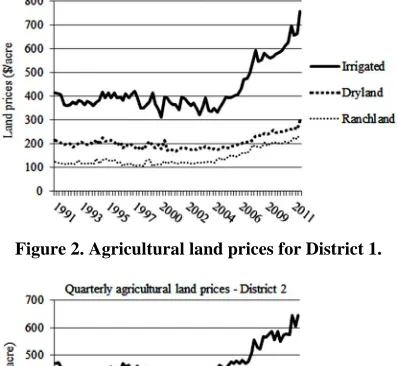
District, which represent the Northern and Southern High Plains of Texas, respectively (Figures 2 and 3).
The independent variables are categorized into two groups of climate and non-climate variables. The depend- ent variable in the study is the quarterly average sale price per acre ($/acre) of agricultural land in a particular district, which is deemed to be consistent with the Ricar- dian approach based on land climate pricing. Climate variables used in the study are daily observations aver- aged to form quarterly mean observations from 1991 to 2011 in order to create homogeneity in the analysis with the dependent variables time series distribution and also to avoid losing degrees of freedom. Means of minimum and maximum temperature are measured in degree Cel- sius (˚C), while mean of precipitation is measured in mil- limeters. The source of this data is the GHCN daily data (Global Historical Climatology Network) for individual weather stations from the National Climate Data Center of the National Oceanic and Atmospheric Administration [17]. These data are obtained for 2 - 3 weather stations in each district and observations are averaged to represent the local climate for each district. For non-climate vari-ables, population density (persons per square mile) [18], total personal income per capita [18], and the Texas Business Cycle Index are used. The Texas Business Cy-cle Index is an economic statistic to assess the current state of the economy in the State of Texas (1987 = 100), and is constructed using payroll employment, gross state product, and the unemployment rate [19]. All nominal variables in the model are deflated by the Consumer Price Index for Texas (1982-84 = 100). The source of data and notations for the dependent and independent variables in the study are defined in Table 1.
Econometric Model
Figure 2. Agricultural land prices for District 1.
[image:5.595.55.289.412.602.2]Figure 3. Agricultural land prices for District 2.
Table 1. Description and sources of variables employed to estimate the model.
Variable Notation Source of Data
DEPENDENT VARIABLES
Irrigated Land Price IRRLP*
Dryland Price DRLP*
Ranchland Price RANLP*
*Quarterly Ag. Survey
[19]
INDEPENDENT VARIABLES Non Climate Variables
Population Density (per sq. mile) POPDEN [18]
Total Personal Income (per capita) PIC [18]
Texas Business Cycle Index Bindex [19]
Climate Variables
Maximum Temperature (˚C) TMAX [17]
Minimum Temperature (˚C) TMIN [17]
Precipitation (mm) PRCP [17]
by:
2
0 2 3
it it it it
Y C C it Z e (1) In this specification, Yit = per acre agricultural land
price in ith district over time period t; α
0 = constant; Cit=
vector of climate variables in ith district for time period t;
Zit = vector of non-climate variables in ith district for time
period t; eit = stochastic error term.
Feasible Generalized Least Square (FGLS) technique is used to estimate the regression model. The economet- ric model specification involves regressing per acre farm-
land value against climate variables and socioeconomic variables (considered exogenous). The significance level of each explanatory variable in the Feasible GLS model is determined by the coefficient t-statistics. Individual explanatory variable’s direction of influence on the de- pendent variable is also checked. Based upon the meth- odology, the land climate pricing model estimates the economic impact of climate normals for 2 districts in Texas over a 21-year period (1991-2011) for three spe- cific land uses: irrigated land, dryland, and ranchland. The data observations are gathered on a quarterly basis and a total of 84 observations over time are available for each variable for each district.
5. Results
Throughout the period of study, quarterly prices of irri- gated land stayed the highest, followed by dryland and ranchland respectively, among the three land use types in District 1 (Figure 2). The dryland and ranchland prices
showed an almost stable trend until the late 1990s and early 2000s, with a slight upward trend following year 2005 onwards. On the other hand, irrigated land prices showed a higher degree of fluctuation when compared to the other twoland use prices, with a very strong upward trend from year 2005 onwards.
A similar trend in agricultural land prices was ob- served during the study period for District 2. Quarterly prices of irrigated land continuously stayed the highest, followed by dryland and ranchland respectively, as was the case in District 1. The starting gap between the dry- land and ranchland prices, which was much higher dur- ing the early 90’s, narrowed over time in District 2 (Fig-
ure 3). Again, the year 2005 saw a similar upward trend
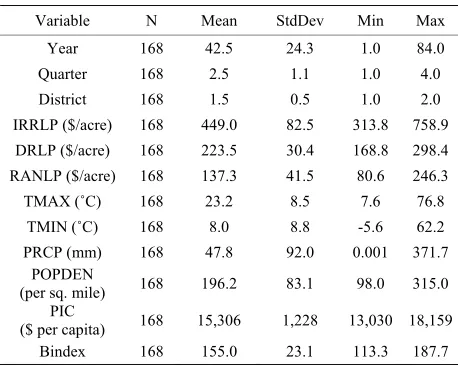
Table 2. Descriptive statistics of variables employed.
Variable N Mean StdDev Min Max
Year 168 42.5 24.3 1.0 84.0
Quarter 168 2.5 1.1 1.0 4.0
District 168 1.5 0.5 1.0 2.0
IRRLP ($/acre) 168 449.0 82.5 313.8 758.9
DRLP ($/acre) 168 223.5 30.4 168.8 298.4
RANLP ($/acre) 168 137.3 41.5 80.6 246.3
TMAX (˚C) 168 23.2 8.5 7.6 76.8
TMIN (˚C) 168 8.0 8.8 -5.6 62.2
PRCP (mm) 168 47.8 92.0 0.001 371.7
POPDEN
(per sq. mile) 168 196.2 83.1 98.0 315.0
PIC
($ per capita) 168 15,306 1,228 13,030 18,159
Bindex 168 155.0 23.1 113.3 187.7
the descriptive statistics of variables employed to esti- mate the model.
There were a total of 168 observations for each vari- able, with each observation indicating a value for a rep- resentative quarter in each year. Given that the data set included time series observations on a quarterly basis, the model data were first checked for the presence of auto- correlation among residuals using the Durbin Watson (DW) statistic. The regression model for the three land use prices (irrigated, dryland, and ranchland), showed statistically significant results for the DW test, and there- fore the data were transformed to first difference values using the first difference estimator, and were again sub- ject to the DW test to further check for the presence of autocorrelation. The DW statistics now showed no auto- correlation, and indicated the suitability of the trans- formed values for further analysis. Including a lag term for the dependent variable in the model also showed sig- nificant autocorrelation using the Durbin h test, and there- fore the lag terms were not included in the model.
This study further evaluated the data using the FGLS approach for seemingly unrelated regression, and some interesting patterns are noticed. For each land use type, an individual equation is used allowing for a seemingly unrelated regression procedure. The lag prices of the de- pendent variable are not included on account of signifi- cant autocorrelation, as indicated earlier. The results of this set of equations showed varied results for different land use types. As suggested in the land climate pricing model, the quadratic terms for the climate variables were also included in the model. The system weighted R2 ob-
tained for this model was 0.3437, and the results for the regressions for irrigated land, dryland, and ranchland are provided in Tables 3-5 respectively.
[image:6.595.308.539.100.258.2]For the irrigated land prices, all the climatic variables except precipitation showed statistically significant re- sults. The estimates for the maximum and minimum av-
Table 3. Results of Feasible GLS for irrigated land prices.
Irrigated land prices
Variable Parameter t Value Pr > |t|
Intercept −0.1364 −0.04 0.9679
TMAX −2.3787 −1.83 0.0694***
(TMAX)2 0.0210 0.34 0.7361
TMIN 2.2122 1.71 0.0895***
(TMIN)2 −0.0203 −0.35 0.7245
PRCP −0.0181 −0.97 0.3336
(PRCP)2 0.0000 0.48 0.6326
PIC 0.0051 1.41 0.1606
POPDEN −0.3760 −0.36 0.7179
Bindex 3.2331 2.06 0.0413**
Table 4. Results of Feasible GLS for dryland prices.
Dryland prices
Variable Parameter t Value Pr > |t|
Intercept −1.0624 −0.62 0.5356
TMAX 0.1084 0.16 0.8694
(TMAX)2 0.0252 0.80 0.4243
TMIN −0.2311 −0.35 0.7247
(TMIN)2 −0.0205 −0.70 0.4830
PRCP 0.0050 0.54 0.5929
(PRCP)2 0.0000 1.15 0.2538
PIC 0.0031 1.68 0.0950***
POPDEN 0.0439 0.08 0.9335
[image:6.595.307.539.284.442.2]Bindex 0.1934 0.24 0.8082
Table 5. Results of Feasible GLS for dryland prices.
Ranchland prices
Variable Parameter T Value Pr > |t|
Intercept 1.73186 1.01 0.3122
TMAX −0.64533 −0.98 0.3275
(TMAX)2 0.02634 0.84 0.4028
TMIN 0.43984 0.67 0.5021
(TMIN)2 −0.02626 −0.90 0.3680
PRCP 0.01713 1.82 0.0703***
(PRCP)2 0.00001 0.27 0.7889
PIC 0.00013 0.07 0.9424
POPDEN −0.82555 −1.57 0.1177
Bindex 0.44500 0.56 0.5759 *denotes 1%, **5%, and ***10% level of significance respectively.
[image:6.595.308.538.467.628.2]the irrigated land prices on a quarterly basis.
Evaluating the results for the dryland prices, it was found that while none of the climatic variables showed any statistical significance, the per capita income showed a positive significant relation with the dryland prices at the 10% level. An interesting result was noted for the ranchland prices, which showed a positive significant relation only with the average seasonal precipitation (at the 10% level) among all climate and non-climate vari- ables, indicating an increase in ranchland prices which could be accounted for by enhanced productivity due to higher precipitation.
6. Discussion and Conclusions
This study evaluated the impact of climatic and socio- economic variables on quarterly agricultural land prices under different land uses in the Northern and Southern High Plains of Texas, basing itself on the Ricardian ap- proach of land climate pricing. This analysis brings to light the influence of climatic factors on differing land use prices, which stems from the fact that agricultural practices and land use patterns are correlated with the weather and climatic variables, and the agricultural pro- duction of a particular commodity that represents the optimal use of land impacts the observed market rent on the land. In this manner, the economic impacts of cli- matic changes in an area are captured by changes in land values across different conditions, which are the focal point of this research. The results indicated that irrigated land prices showed significance with a larger number of explanatory variables, specifically climatic, when com- pared to dryland and ranchland with the latter showing significance only with regard to precipitation. This indi- cates a stronger impact of climatic factors on the produc- tivity of irrigated land thereby strongly impacting the land prices, when compared to dryland and ranchland. Further, the irrigated land prices showed significance with regard to the business index, while dryland prices showed significance with regard to per capita income among the different socioeconomic variables. Ranchland prices did not show any significant effects for any socio- economic variables.
This study faced certain limitations especially with regard to data availability for socioeconomic factors on a quarterly basis and it will be useful to include other so- cio-economic characteristics of the region as well, and a higher number of cross-sectional units to enhance the performance and fit of the land climate model used. The latter will also allow for including a one-way panel fixed effects model with a higher number of spatial units. The results of the study provide an initial insight into the ap- plication of climatic data for understanding changes in agricultural land prices under varying land uses. For a semi-arid region with a strong agricultural economy like
the Texas High Plains, prices for varying land uses as impacted by future climate could exert significant im- pacts on land management policies in the region. This study could provide a framework for developing predic- tive market analyses of rural land values in the region, which faces projections of increasing temperature and declining precipitation thereby influencing agricultural production in the future on account of its semi-arid cli- mate.
7. Acknowledgements
This research was supported in part by the Ogallala Aq- uifer Program, a consortium between the USDA Agri- cultural Research Service, Kansas State University, Texas AgriLife Research, Texas AgriLife Extension Service, Texas Tech University, and West Texas A & M Univer- sity. The authors would also like to thank the Federal Reserve Bank of Dallas for their contribution to the data sources.
REFERENCES
[1] Texas A & M Institute of Renewable Natural Resources, “Texas Land Trends,” 2012.
http://texaslandtrends.org/Briefings/Landuse.aspx. [2] IPCC (Intergovernmental Panel on Climate Change), “Cli-
mate Change 2007: Synthesis Report”, 2007.
http://www.ipcc.ch/publications_and_data/ar4/syr/en/spm s3.html
[3] Real Estate Center at Texas A & M University, “Texas Rural Value Trends,” 2012.
http://recenter.tamu.edu/data/rland/trends/ASFMRA_201 1.pdf.
[4] R. Mendelsohn, W. D. Nordhaus and D. Shaw, “The Im- pact of Global Warming on Agriculture: A Ricardian Analysis,” American Economic Review, Vol. 84, No. 4, 1994, pp.753-771.
[5] J. Currie, “The Economic Theory of Agricultural Land Tenure,” Cambridge University Press, Cambridge, 1981. [6] A. Amiraslany, “The Impact of Climate Change on Cana-
dian Agriculture: A Ricardian Approach,” Unpublished Thesis, University of Saskatchewan, Saskatoon, 2010. http://library2.usask.ca/theses/available/etd-05252010-10 2012/
[7] R. Mendelsohn and W. D. Nordhaus, “The Impact of Global Warming on Agriculture: A Ricardian Analysis: Reply,” American Economic Review, Vol. 89, No. 4, 1999, pp. 1049-1052.
http://dx.doi.org/10.1257/aer.89.4.1049
[8] J. Quiggin and J. K. Horowitz, “The Impact of Global Warming on Agriculture: A Ricardian Analysis: Com- ment,” American Economic Review, Vol. 89, No. 4, 1999, pp. 1044-1045. http://dx.doi.org/10.1257/aer.89.4.1044 [9] R. Mendelsohn, W. D. Nordhaus and D. Shaw, “Climate
ogy, Vol. 80, 1996. pp. 55-66.
http://dx.doi.org/10.1016/0168-1923(95)02316-X [10] Mendelsohn, R. and A. Dinar, “Climate, water, and
agri-culture,” Land Economics, Vol. 79, No. 3, 2003, pp. 328- 341. http://dx.doi.org/10.2307/3147020
[11] W. Schlenker, W. Hanemann and A. Fisher, “Will U.S. Agriculture Really Benefit from Global Warming? Ac-counting for Irrigation in the Hedonic Approach,” The American Economic Review, Vol. 95, No. 1, 2005, pp. 395-406.http://dx.doi.org/10.1257/0002828053828455 [12] W. Schlenker, W. Hanemann and A. Fisher, “Water Avai-
lability, Degree Days, and the Potential Impact of Climate Change on Irrigated Agriculture in California,” Climatic Change, Vol. 81, No. 1, 2007, pp. 19-38.
http://dx.doi.org/10.1007/s10584-005-9008-z
[13] O. Deschens and M. Greenstone, “The Economic Impacts of Climate Change: Evidence from Agricultural Profits and Random Fluctuations in Weather,” American Eco-nomic Review, Vol. 97, No.1, 2007, pp. 354-385. http://dx.doi.org/10.1257/aer.97.1.354
[14] D. Maddison, “A Hedonic Analysis of Agricultural Land Prices in England and Wales,” European Review of Agri-
cultural Economics, Vol. 27, No. 4, 2000, pp. 519-532. [15] S. N. Seo and R. Mendelsohn, “An Analysis of Crop
Choice: Adapting to Climate Change in South American Farms,” Ecological Economics, Vol. 67, No. 1, 2008, pp. 109-116.
http://dx.doi.org/10.1016/j.ecolecon.2007.12.007 [16] U. Hanif, S. H. Syed, R. Ahmad and K. M. Malik,
“Eco-nomic Impact of Climate Change on the Agricultural Sector of Punjab,” The Pakistan Development Review, Vol. 49. No. 4, 2010, pp. 771-798.
[17] National Oceanic and Atmospheric Administration, “Na-tional Climatic Data Center,” 2012.
[18] U.S. Census Bureau, 2012. http://www.census.gov/. [19] Federal Reserve Bank of Dallas, “Agricultural Survey,”
2012.
http://www.dallasfed.org/research/agsurvey/index.cfm. [20] Real Estate Center at Texas A&M University, 2005.