Effect of Medical Advice for Diet on Diabetes
Self-Management and Glycemic Control for Haitian and
African Americans with Type 2 Diabetes
Fatma G. Huffman, Joel C. Exebio, Joan A. Vaccaro, Gustavo G. Zarini, Zisca Dixon
Department of Dietetics and Nutrition, Florida International University, Miami, USA. Email: huffmanf@fiu.edu
Received July 22nd, 2013; revised August 22nd, 2013; accepted August 30th, 2013
Copyright © 2013 Fatma G. Huffman et al. This is an open access article distributed under the Creative Commons Attribution
Li-cense, which permits unrestricted use, distribution, and reproduction in any medium, provided the original work is properly cited.
ABSTRACT
Adequate care of type 2 diabetes is reflected by the individual’s adherence to dietary guidance; yet, few patients are engaged in diabetes self-care at the recommended level, regardless of race/ethnicity. Few studies on the effect of dietary medical advice on diabetes self-management (DSM) and glycemic control have been conducted on Haitian and African American adults with type 2 diabetes. These relationships were assessed in total of 254 Blacks with type 2 diabetes (Haitian Americans = 129; African Americans = 125) recruited from Miami-Dade and Broward Counties, Florida by community outreach methods. Although dietary advice received was not significantly different between the two Black ethnicities, given advice “to follow a diet” as a predictor of “using food groups” was significant for Haitian Americans, but not for African Americans. Haitian Americans who were advised to follow a diet were approximately 3 times more likely to sometimes or often use food groups (or exchange lists) in planning meals. Less than optimal glycemic control (A1C > 7.2) was inversely related to DSM for African Americans; but the relationship was not significant for Haitian Americans. A one unit increase in DSM score decreased the odds ratio point estimate of having less than optimal gly- cemic control (A1C > 7.2%) by a factor of 0.94 in African Americans. These results suggest that medical advice for diet plans may not be communicated effectively for DSM for some races/ethnicities. Research aimed at uncovering the en- ablers and barriers of diet management specific to Black ethnicities with type 2 diabetes is recommended.
Keywords: Dietary Medical Advice; Diabetes Self-Management; African American; Haitian American; Type 2 Diabetes; Glycemic Control
1. Introduction
Type 2 diabetes, the most common form (90% - 95% of all cases) has increased among the general population [1] and disproportionately among minorities (particularly African-Americans and Hispanics) [2]. Due to the many health consequences of diabetes and the nature of the disease, diabetes care is vital to quality of life and sur- vival. It is essential for persons with diabetes to acquire and practice adequate diabetes self-management (DSM) skills in order to reduce the risk factors that lead to mor- bidity and mortality associated with diabetes-related complications [3]. DSM includes achieving adequate gly- cemic control, blood lipids and blood pressure as well as weight management through diet and exercise [3,4]. Nwasuruba, Khan and Egede [5] reported few patients are engaged in diabetes self-care at the recommended
diabetes-related complications. According to the Stan- dard of Care for diabetes by the American Diabetes As- sociation, dietary modification, weight management and incorporation of physical activity into the lifestyle of persons with diabetes are essential components of DSM [3]. Coping with diabetes has been widely associated with diagnosed depression [8] (and references therein). Depressive symptoms were associated with higher gly- cated hemoglobin (A1C) for African Americans (AA) with diabetes [9]. A recent study found Haitian Ameri- cans (HA) were more likely to have A1C > 9% as com- pared to AA, even when adjusting for socio-demogra- phics [10]. The association of medical advice with DSM and glycemic control may be confounded by depression and perceived stress. Moreover, DSM may be a conse- quence of access to quality medical care and medical advice received and may differ between these Black eth- nicities. There have been few studies on the effect of dietary advice on DSM and glycemic control for Haitian and African American adults (HA and AA) with type 2 diabetes. Therefore, the purpose of this study was to as- sess these relationships while adjusting for socio-demo- graphic factors and coping abilities measured by depress- sive symptoms and perceived stress. It is hypothesized for both HA and AA that 1) medical advice for following a meal plan will be associated currently following the advice; and, 2) high overall diabetes self-management will be associated with adequate glycemic control (lower A1C). For details of hypothesis variable construction and measurements, refer to the Measures section of Methods.
2. Methods
2.1. Participants
The study participants were recruited by community out- reach methods from a larger study of HA and AA with and without diabetes, 2007-2010. Recruitment of the participants was from Miami-Dade and Broward Coun- ties, Florida by community outreach methods. Letters of invitation outlining the study were mailed to diabetes educators and health professionals, requesting their co- operation in recruiting individuals with type 2 diabetes. Invitational flyers were distributed to all Florida Interna- tional University (FIU) faculty, staff and students ex- plaining the research protocol and requesting their assis- tance in the study. Advertisements were placed in local AA and HA newspapers and principal gathering places along with radio ads on local Creole and African Ameri- can stations. In addition to community outreach, African Americans were mailed invitational flyers from a pur- chased mailing list from Knowledge Base Marketing, Inc., Richardson, TX, US. Inclusion criteria consisted of: male and female HA and AA adults with self-reported
type 2 diabetes, age 35 years, not taking insulin, not pregnant or lactating, no thyroid disorders, no coronary heart disease, not undergoing chemo or radiation therapy, not diagnosed with cancer, HIV, or AIDS, and no major psychiatric disorders. Respondents with diabetes were asked for the age they were diagnosed and their initial treatment modalities (with or without insulin). Inquiry of ethnicity included questions of cultural identification and place of birth. Diabetes status (diagnosed with type 2 diabetes or not) was determined by reported year of di- agnosis and then confirmed by laboratory reports. Indi- viduals with fasted blood glucose ≥ 126 mg/dL were classified as having diabetes. Eligibility was determined by interviewers’ screening, and respondents’ self-report. Those participants undiagnosed, but considered having diabetes based on their laboratory reports, were not in- cluded in this study; however, they were given their laboratory reports and advised to contact their physician. A total of 254 participants with type 2 diabetes were in- cluded in this study (HA = 129; AA = 125). The study was approved by the Institutional Review Board of Flor- ida International University. All participants read, under- stood and signed an informed consent form in either English or Creole.
2.2. Measures
Main study variables: Medical advice given to follow a
meal plan or diet, level of reporting following a diet, and
the diabetes self-management (DSM) composite score
was collected as part of the Michigan Diabetes Ques- tionnaire [11]. Dietary advice for individuals with type 2 diabetes suggests using exchange lists or food groups in meal planning [12]. This strategy is referred to as the “diabetes diet” and includes an individually tailored pre- scription to either use the exchange list for macronutri- ents, counting carbohydrates or use the glycemic index for meal plans [12].
Hypothesis 1, independent variable: The following
question from the section on Educational/Advice Re- ceived was used: “Has your health care provider or nurse ever told you to follow a meal plan or diet?” The possible responses were yes, no, or not sure. Since all participants answered yes or no, the variable was measured as binary.
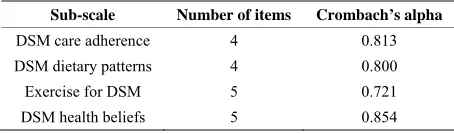
Hypothesis 2, independent variable: The diabetes self- management (DSM) score was constructed as composite scales based on the major subscales from the Michigan Diabetes Research and Training Center (MDRTC) Dia- betes Care Profile questionnaire [11]. This questionnaire has been widely used and was validated and tested for reliability for Caucasians and African Americans by sev- eral studies conducted by Fitzgerald and colleagues [11]. The composite score for DSM was constructed from the Likert sub-scale variables. Variables where higher scores indicated clinically appropriate DSM were added directly to the composite score. Exercise barriers were reverse- coded so that rarely having trouble getting exercise res- ponses reflected a higher DSM. The following subscales were combined to form the DSM composite score: 1) DSM care adherence (I keep my blood sugar in good control; I keep my glycated hemoglobin (A1C) in good control; I keep my weight under control; I do the things I need to do for my diabetes (diet, medicine, exercise, etc.); 2) dietary patterns (following a meal plan; scheduling meals and snacks; weighing or measuring food; meal planning (by you or the person who cooks) such as ex- change list or food groups); 3) exercise barrier scale: How often do you have trouble getting enough exercise because: it takes too much effort? You don’t believe it is useful? You don’t like to do it? You have a health problem? It makes diabetes more difficult to control? and, 4) health beliefs: Taking the best possible care of dia- betes will delay or prevent: 1. eye problems; 2. kidney problems; 3. foot problems; 4. hardening of the arteries; 5. heart disease. The DSM composite scale score fol- lowed a normal distribution. Reliability was measured for the sub-scales using Cronbach’s alpha. Cronbach’s alpha value of 0.70 to 0.79 is considered to be acceptable, 0.80 to 0.89 to be very good and 0.90 and higher to be excellent [13]. All items fell in the “very good” range except the DSM-exercise subscale, which was considered marginal (alpha = 0.721); removing an item did not raise the value (Table 1).
[image:3.595.58.285.658.725.2]Hypothesis 2, dependent variable: Sub-optimal glyce- mic control was considered A1C > 7.2. This cutoff was applied using the median and in consideration of the American Diabetes Association’s guideline [3] for set- ting goals for glycemic control as A1C either below 7 or
Table 1. Reliability of the Diabetes self-management com-posite scale.
Sub-scale Number of items Crombach’s alpha
DSM care adherence 4 0.813 DSM dietary patterns 4 0.800 Exercise for DSM 5 0.721 DSM health beliefs 5 0.854
Abbreviation: DSM = diabetes self-management.
8 percent depending on the characteristics of the patient. A1C was measured from a 20 ml sample of venous blood collected from each participant after an overnight fast (8 - 10 h) by a certified phlebotomist using standard labo- ratory techniques. Whole-blood samples for A1C were collected in a tube containing EDTA and A1C percent- ages were measured using Roche Tina Quant method by the Laboratory Corporation of America (LabCorp®, Mi-
ami, FL, USA).
2.3. Covariates
Sociodemographics: Age, gender, duration of residence in the USA, language preference, education, income, employment status, medication history, family history of diabetes and coronary heart disease were collected using a socio-demographic questionnaire.
Psychosocial variables: Perceived stress, self-rated health, and symptoms of depression were assessed, since they could be confounders of health behavior. To meas- ure perceived stress, the Perceived Stress Scale (PSS-10) [14,15] was administered with permission from the John E. and Catherine MacArthur Research Network on Socio- economic Status and Health and was scored and con- structed as a continuous variable based on the author’s guidelines. The sociodemographic questionnaire included self-rated health (SRH) which was measured in response to the question, “In general, would you say your health is: (Check one box).” Self-rated health was measured on a 5-point scale (excellent, very good, good, fair and poor). SRH was collapsed to a binary variable (fair/ poor versus good, very good, excellent) based on the distribution of participants.
Depressive symptoms: The questionnaire used was the Beck Depression Inventory (BDI). The BDI is a 21-item, self-reported questionnaire that measures the presence and severity of depressive symptoms using a self-rating scale from 0 to 3 (0 being least depressed and 3 being most depressed). The scale has been previously validated against Caucasians in Hispanic [16] and Black popula- tions [17]. Scores for each question were summed, cal- culating a final BDI score.
Anthropometrics: Participant’s height and weight were measured with the subject standing erect without shoes, and for weight, wearing light clothes using a SECA clinical scale (SECA Corp, Columbia, MD). Height and weight were measured to the nearest 0.5 cm and 0.1 kg, respectively. Body mass index (BMI) was calculated as weight (kg) divided by height (m) squared (kg/m2).
detail in the compendium of physical activity [19]. Physical activity was expressed as metabolic equivalents per hour per week (1 kcal·kg−1·h−1). One MET is the
equivalent of sitting quietly. The participants, with the help of a trained interviewer, estimated the number of months and frequency per month and duration of each activity. For occupational activity, participants reported all jobs held over the past year. The number of hours sitting at work and usual mode of transportation to work was recorded for each job. Total physical activity was calculated, summing all leisure and occupational activity hours per week. These values were then multiplied by their estimated metabolic cost.
2.4. Statistical Analysis
Demographic characteristics, medical advice and diabe- tes self management scores were compared among HA and AA using the Student t-test for continuous variables and Chi-Square test for categorical variables. Logistic regression models were used to test hypothesis 1, where “advised to follow a diet” (yes/no) was the major inde- pendent variable and “using exchange lists or food groups to plan meals” (never/seldom versus sometimes/ often/always) was the binary outcome. Since there was an interaction between ethnicity and medical advice for
diet, separate analyses were conducted for HA and AA. Both unadjusted and adjusted models were conducted. Two and three way interaction terms between told to follow a diet, gender and education level were tested. Covariates included in the model were diabetes medica- tion, stress score, age, gender, BMI, years with diabetes, self-rated health, health insurance, depression, A1C, marital status, education, smoking, and physical activity.
To test hypothesis 2, logistic regression models were used where diabetes self management score (continuous) was the main independent and a binary measure of suboptimal glycemic control (A1C > 7.2) was con- structed as the outcome, based on the sample distribution and the American Diabetes Association’s glycemic goals for adults [3]. Two and three way interaction terms be- tween diabetes self management score, race, gender and education level were tested. Statistical analysis was con- ducted using SPSS version 18.0 and significance was set at P < 0.05.
3. Results
[image:4.595.57.539.428.707.2]Characteristics of the study population are presented in Table 2. Although sociodemographic factors differed between HA and AA, the main study variables: advised to follow a diet, level of following a diet (using food
Table 2. General characteristics of the study population.
Variable Haitian-Americans (n = 129) African-Americans (n = 125) P-value
Age (years) 58.0 ± 9.9 54.2 ± 10.1 0.002
Gender (female) 55.8 (72) 52.0 (65) 0.615
BMI (kg/m2) 29.4 ± 5.3 35.6 ± 8.6 <0.001
Told to follow a diet (yes) 72.1 (93) 77.6 (97) 0.386
Using food groups (sometimes or often) 11.0 ± 7.8 9.7 ± 9.7 0.262
Poor glycemic control (A1C > 9%) 27.9 (36) 20.8 (26) 0.193
DSM 68.2 ± 9.3 63.4 ± 10.2 <0.001
Duration of diabetes (years) 9.4 ± 7.4 9.1 ± 8.7 0.721
Diabetes medication (yes) 89.9 (116) 76.8 (96) 0.006
SRH (fair or poor) 51.9 (67) 45.6 (57) 0.132
Health insurance (yes) 55.0 (71) 79.2 (99) 0.001
Physical activity (MET hours/week) 34.7 ± 60.1 39.1 ± 67.0 0.576
Marital status (married) 62.0 (80) 26.4 (33) <0.001
Education (high school or higher) 45.0 (58) 82.4 (103) <0.001
Currently smoking (yes) 6.9 (9) 34.4 (43) <0.001
BDI Depression score 55.8 (72) 47.2 (59) 0.211
Perceived Stress score 17.2 ± 7.3 15.7 ± 8.4 0.171
Abbreviations: BMI = body mass index; A1C= percent of glycated hemoglobin; BDI = beck depression inventory; DSM = diabetes self-management; SRH = self-rated health; MET= metabolic equivalents (per hour per week). MET= (1 kcal·kg−1·h−1). One MET is the equivalent of sitting quietly. Notes: Data are
groups to plan meals), and glycemic control were not significantly different between the Black ethnicities; al- beit DSM was higher for HA than AA (P < 0.001). A number of possible confounders of health behavior: du- ration of diabetes, SRH, depression symptoms, physical activity, and perceived stress were not significantly dif- ferent between HA and AA. Several risk factors were more prevalent in AA participants than HA: obesity, as measured by BMI, and smoking; whereas HA had a lower percent of health care insurance.
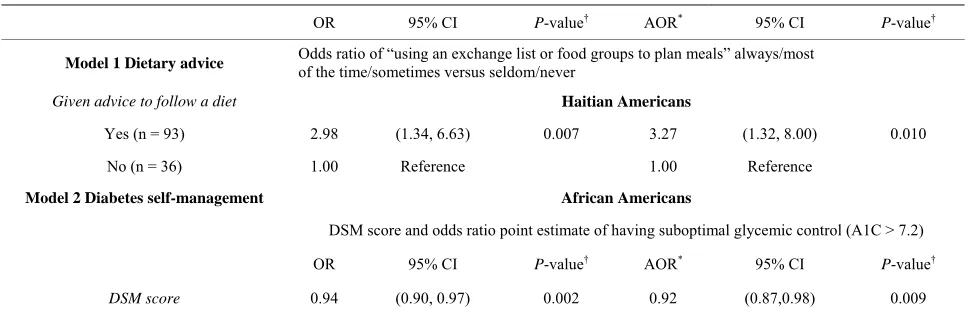
Hypothesis 1: Dietary advice and behavior was not in- dependent of race/ethnicity. The combined model race/ ethnicity by “given advice to follow a diet” was not sig- nificant, so separate logistic regression analyses were conducted for HA and AA. “Given advice to follow a diet” as a predictor of “using food groups” was signifi- cant for HA, but not for AA. HA who were advised to follow a diet were approximately 3 times more likely to sometimes or often use food groups (or exchange lists) in planning meals in both the unadjusted and adjusted mod- els (Table 3). Effects of the covariates: No covariates were significant for dietary advice and behavior.
Hypothesis 2: DSM and glycemic control were also
not independent of race/ethnicity. Suboptimal glycemic control (A1C > 7.2) was inversely related to DSM for AA in unadjusted and adjusted models; whereas this re- lationship was not significant for HA. A one unit in- crease in DSM score decreased the odds ratio point. Es- timate of having suboptimal glycemic control (A1C > 7.2) by a factor of 0.94 in AA (Table 3).
Effects of the covariates: Of the adjustment variables for DSM and glycemic control, only BMI (P = 0.026), years with diabetes (P = 0.004), and physical activity (P = 0.028) were significant.
4. Discussion
In the current study, dietary advice was associated with performing the behavior for HA, but not for AA; whereas, overall DSM skills, beliefs, and behaviors were associ- ated with glycemic control for AA, but not HA. This finding may be explained, in part, by the high percent of HA participants without health insurance (45%) as com- pared to AA (20%). Although diabetes care is largely the responsibility of the individual, healthcare providers play a vital role in the patient’s skill development. In fact, health care providers are the link between the patient and their disease self-management. The communication proc- ess between the provider and patient can determine whether or not the patient is informed, motivated and confident enough to make the behavioral changes neces- sary for diabetes care. Federal agencies and the literature concur that access to quality health care and education for diabetes self-management are essential to the preven- tion of diabetes complications. Quality health care can be assessed by the degree to which diabetes complications are prevented or reduced as a result of patient’s lifestyle behavioral changes. Medical advice associated with dia- betes self-management and clinical health outcomes can serve as measures of risk for diabetes complications for a cross-sectional sample. The association among provider support for diabetes self-management, patient self-care and health outcomes is presumed, yet understudied [20]. In this sample of AA, DSM may serve as a proxy meas- ure of glycemic control. A low DSM score may be used as a screening tool for tighter glycemic control confirmed later with A1C testing.
[image:5.595.56.540.547.703.2]Heisler, Cole, Weir, Kerr and Hayward [21] using two validated scales to access medical advice found that when providers communicated information and allowed
Table 3. Logistic regression models for the effect of dietary advice and diabetes self-management on dietary behavior and glycemic control.
OR 95% CI P-value† AOR* 95% CI P-value†
Model 1 Dietary advice Odds ratio of “using an exchange list or food groups to plan meals” always/most of the time/sometimes versus seldom/never
Given advice to follow a diet Haitian Americans
Yes (n = 93) 2.98 (1.34, 6.63) 0.007 3.27 (1.32, 8.00) 0.010
No (n = 36) 1.00 Reference 1.00 Reference
Model 2 Diabetes self-management African Americans
DSM score and odds ratio point estimate of having suboptimal glycemic control (A1C > 7.2)
OR 95% CI P-value† AOR* 95% CI P-value†
DSM score 0.94 (0.90, 0.97) 0.002 0.92 (0.87,0.98) 0.009
OR = Odds Ratio; AOR = adjusted Odds Ratio; DSM = diabetes self-management; A1C = percent of glycated hemoglobin. *Models 1 and 2 are adjusting for
diabetes medications, perceived stress score, age, gender, body mass index, years with diabetes, self-rated health, health insurance, depression, marital status, ducation, smoking, and physical activity. In addition, Model 1 is adjusted for A1C. †P < 0.05 is considered significant.
patients to be involved in decisions, diabetes self-man- agement practices (medication adherence, diet, exercise, blood glucose monitoring and foot care) and A1C values improved for a national cross-sectional survey of 1588 older adults (Blacks and Latinos were oversampled) with diabetes. Improvement in diet and A1C was associated with a continuity of care score (number of visits to health care providers and the number of providers seen) for a prospective study of 256 adults ages 18 and older with type 2 diabetes [22]. A longitudinal study of four age groups of urban African-Americans with type 2 diabetes at a primary health care clinic (N = 2539) reported a sig- nificant improvement of A1C for those treated with die- tary advice and diabetes medications in all age groups (P < 0.001); however, patients with less frequent visits were associated with higher A1C levels [23].
Medical advice received and understood may differ by race/ethnicity as a consequence of the patient-provider communication process; and, may affect diabetes self- management. AA were less-likely to perform a compos- ite of four diabetes self-management behaviors, including physical activity, diet, self-testing blood glucose and foot care, as compared to White non-Hispanics based on a nationally representative survey [5]. Similar racial/ethnic differences in diabetes self-management were found in a survey of persons with diabetes in a managed care setting: AA had lower odds of monitoring their diet and exercis- ing as compared to White non-Hispanics [24].
The interpretation of medical advice received may be further complicated by the patient’s health beliefs, which can serve as barriers to their self-care. Health beliefs, compliance and guidelines for spiritual assessment ad- dressed by The National Medical Association and the Joint Commission on Accreditation of Healthcare Or- ganizations are of particular importance for African- American patients [25]. Health beliefs that contribute to non-adherence may differ by culture. For example, Hai- tian-Americans’ high rate of noncompliance has been attributed, in part, to their health beliefs [26].Haitian- American beliefs about health and illness may be influ- enced by life in Haiti where limited access to health care and poor health conditions influenced a reliance on folk and/or spiritual explanations and treatments for illness [26]. Yet, Haitians have a strong set of protective factors that are conducive to health educational programs in- cluding a strong work ethic; entrepreneurial spirit, ex- tended family support system and increasing neighbor- hood-based social services [27].
Findings of health beliefs and compliance with Afri- can-Americans suggest multiple influences, including religion, spirituality and folklore [25]. African-Ameri- cans were found to be more than twice as likely to use home-remedies as Whites [28]. Several studies concur
that factors beyond knowledge and access to medical care such as noncompliance and lay beliefs inconsistent with medical practice are responsible for inadequate hy- pertensive control among this population [29-31]. Nwa- suruba, Khan, and Egede [5] found significant differ- ences among Blacks, Hispanics and White non-Hispanics in DSM behaviors, based on data from the 2003 Behav- ioral Risk Factor Surveillance survey (BRFSS); however, data did not specify different origins of persons classified as “Black.”
4.1. Limitations
Several limitations were present in this study. Medical advice and diabetes self-management behavior were self-reported. The study was cross-sectional and causal- ity of medical recommendations and following the ad- vice could not be established. The study represents a sin- gle time point and there are other environmental, social influences that combined with individual characteristics in determining behavior. For example, patient-provider communication and health beliefs were not measured. There is no absolute way of determining the level of medical advice that was actually given. For instance, medical advice may have been given and there could have been problems with communication or recall. In some cases, the medical advice was given and the pa- tient did not remember receiving it at the time of the survey (lack of recall). In other cases the patient received the advice but did not process it (ineffective communica- tion on the part of the physician or healthcare provider).
4.2. Conclusion
In the present study there were differences in medical advice for diet and following it for Blacks of two ethnici- ties. Healthcare providers should consider cultural back- ground, coping abilities, and sociodemographic factors when providing guidance and education for patients to develop strategies to manage their diabetes.
5. Acknowledgements
This grant was funded by the National Institutes of Health: NIH/NIDDK #1SC1DK083060-01 to the corre- sponding author.
REFERENCES
[1] National Institute of Diabetes and Digestive Kidney Dis- eases, “National Diabetes Statistics, 2011 Fact Sheet,” US Department of Health and Human Services, National In- stitutes of Health, Bethesda, 2011.
http://www.cdc.gov/diabetes/pubs/pdf/ndfs_2011.pdf [3] American Diabetes Association, “Standards of Medical
Care in Diabetes—2012,” Diabetes Care, Vol. 35, Suppl.
1, 2012, pp. S4-S63. http://dx.doi.org/10.2337/dc12-s004
[4] M. W. Stolar, B. J. Hoogwerf, S. M. Gorshow, P. J. Boyle and D. O. Wales, “Managing Type 2 Diabetes: Going beyond Glycemic Control,” Journal of Managed Care Pharmacy, Vol. 14, No. 5, 2008, pp. S2-S19.
[5] C. Nwasuruba, M. Khan and E. Egede, “Racial/Ethnic Differences in Multiple Self-Care Behaviors in Adults with Diabetes,” Journal of General Internal Medicine,
Vol. 22, 2007, pp. 115-120.
http://dx.doi.org/10.1007/s11606-007-0120-9
[6] Agency for Healthcare Research and Quality, “National Healthcare Quality Report, 2008. Chapter 2: Effective- ness, Diabetes,” AHRQ Publication No. 09-000, 2008. [7] American College of Physicians, American Society of
Internal Medicine, “No Health Insurance? It’s Enough to Make You Sick. Latino Community at Great Risk,” White Paper, Philadelphia, ACP-ASIM, 2000.
[8] G. A. Nichols and J. B. Brown, “Unadjusted and Ad- justed Prevalence of Diagnosed Depression in Type 2 Diabetes,” Diabetes Care, Vol. 26, No. 3, 2003, pp. 744-
749. http://dx.doi.org/10.2337/diacare.26.3.744
[9] J. A. Wagner, G. L. Abbott, A. Heapy and L. Yong, “De- pressive Symptoms and Diabetes Control in African Americans,” Journal of Immigrant Minority Health, Vol.
11, No. 1, 2009, pp. 66-70.
http://dx.doi.org/10.1007/s10903-008-9147-1
[10] V. G. Vimalananda, J. L. Rosenzweig, H. J. Cabral, M. M. David and K. E. Lasser, “Comparison of Diabetes Control among Haitians, African Americans, and Non-Hispanic Whites in an Urban Safety-Net Hospital,” Diabetes Care, Vol. 34, No. 1, 2011, pp. 58-60.
http://dx.doi.org/10.2337/dc10-1387
[11] Michigan Diabetes Research and Training Center, “Sur-vey Instruments for Health Professionals: Diabetes Care Profile,” 2012.
http://www.med.umich.edu/mdrtc/profs/survey.html#dcp [12] American Diabetes Association, “Using Exchange Lists:
Diabetes Meal Planning,” 2013.
http://www.americandiabetes.com/living-diabetes/diabete s-nutrition-articles/using-exchange-lists-diabetes-meal-pla nning
[13] J. Cohen, “Statistical Power Analysis for the Behavioral Sciences,” 2nd Edition, Lawrence Erlbaum Associates, Hillsdale, 1988, p. 535.
[14] S. Cohen, T. Kamarck and R. Mermelstein, “A Global Measure of Perceived Stress,” Journal of Health and So- cial Behavior, Vol. 24, No. 4, 1983, pp. 385-396.
http://dx.doi.org/10.2307/2136404
[15] S. Cohen and G. Williamson, “Perceived Stress in a Probability Sample of the U.S.,” In S. Spacapam and S. Oskamp, Eds., The Social Psychology of Health: Clare- mont Symposium on Applied Social Psychology, Sage,
Newbury Park, 1988, pp. 99-125.
[16] S. Contreras, S. Fernandez, V. L. Malcarne, R. E. Ingram
and V. R. Vaccarino, “Reliability and Validity of the Beck Depression and Anxiety Inventories in Caucasian Americans and Latinos,” Hispanic Journal of Behavioral Sciences, Vol. 26 No. 4, 2004, pp. 446-462.
http://dx.doi.org/10.1177/0739986304269164
[17] K. B. Grothe, G. R. Dutton, G. N. Jones, J. Bodenlos, M. Ancona and P. J. Brantley, “Validation of the Beck De- pression Inventory-II in a Low-Income African American Sample of Medical Outpatients,” Psychological Assess- ment, Vol. 17, No. 1, 2005, pp. 110-114.
http://dx.doi.org/10.1037/1040-3590.17.1.110
[18] A. M. Kriska, W. C. Knowler, R. E. LaPorte, et al., “De-
velopment of Questionnaire to Examine Relationship of Physical Activity and Diabetes in Pima Indians,” Diabe- tes Care, Vol. 13, No. 4, 1990, pp. 401-411.
http://dx.doi.org/10.2337/diacare.13.4.401
[19] B. E. Ainsworth, W. L. Haskell, S. D. Herrmann, et al.,
“Compendium of Physical Activities: A Second Update of Codes and MET Values,” Medicine and Science in Sports and Exercise, Vol. 43, No. 8, 2011, pp. 1575-1581.
http://dx.doi.org/10.1249/MSS.0b013e31821ece12
[20] J. Greene and M. J. Yedidia, “Provider Behaviors Con- tributing to Patient Self Management of Chronic Illness among Underserved Populations,” Journal of Health Care for the Poor and Underserved, Vol. 16, No. 4, 2005,
pp. 808-824. http://dx.doi.org/10.1353/hpu.2005.0097
[21] M. Heisler, I. Cole, D. Weir, E. A. Kerr and R. A. Hay- ward, “Does a Physician Communication Influence Older Patients’ Diabetes Self-Management and Glycemic Con- trol? Results from the Health and Retirement Study,”
Journal of Gerontology, Vol. 62A, No. 12, 2007, pp.
1435-1442.
[22] M. L. Parchman, J. A. Pugh, P. H. Noel and A. C. Larme, “Continuity of Care, Self-Management Behaviors, and Glucose Control in Patients with Type 2 Diabetes,” Medi- cal Care, Vol. 40, No. 2, 2002, pp. 137-144.
http://dx.doi.org/10.1097/00005650-200202000-00008
[23] I. M. El-Kebbi, C. B. Cook, D. C. Ziemer, C. D. Miller, D. L Gallina and L. S. Phillips, “Association of Younger Age with Poorer Glycemic Control and Obesity in Urban African Americans with Type 2 Diabetes,” Archives of Internal Medicine, Vol. 163, No. 1, 2003, pp. 69-75.
http://dx.doi.org/10.1001/archinte.163.1.69
[24] N. V. Oster, V. Welch, L. Schil, J. A. Gazmararian, K. Rask and C. Spettell, “Differences in Self-Management Behaviors and Use of Preventive Services among Diabe- tes Management Enrollees by Race and Ethnicity,” Dis- ease Management, Vol. 9, No. 3, 2006, pp. 167-175.
http://dx.doi.org/10.1089/dis.2006.9.167
[25] J. Levin, L. M. Chatters and R. J. Taylor, “Religion, Health and Medicine in African Americans: Implications for Physicians,” Journal of the National Medical Associa- tion, Vol. 97, No. 2, 2005, pp. 237-249.
[26] C. Kemp, “Haitians,” 2006.
https://bearspace.baylor.edu/Charles_Kemp/www/haitian _refugees.htm
tian/Haitian-American Community in Miami Dade Coun- ty,” Working paper Series: SL WPS 02, 2004.
[28] C. M. Brown and R. Segal, “The Effects of Health and Treatment Perceptions on the Use of Prescribed Medica- tion and Home Remedies among African American and White Hypertensives,” Social Science and Medicine, Vol.
43, No. 6, 1996, pp. 903-917.
http://dx.doi.org/10.1016/0277-9536(95)00434-3
[29] R. Wilson, “Lay Beliefs about High Blood Pressure in a Low- to Middle-Income Urban African-American Com- munity: An Opportunity for Improving Hypertension
Control,” American Journal of Medicine, Vol. 112, No. 1,
2002, pp. 26-30.
http://dx.doi.org/10.1016/S0002-9343(01)01049-X
[30] L. M. Lewis and G. Ogedegbe, “Understanding the Na- ture and Role of Spirituality in Relation to Medication Adherence: A Proposed Conceptual Model,” Holistic Nursing Practice, Vol. 22, No. 5, 2008, pp. 261-271.
[31] J. L. Middleton, “A Proposed New Model of Hyperten- sive Treatment Behavior in African Americans,” Journal of the National Medical Association, Vol. 101, No. 1,