Munich Personal RePEc Archive
Agglomeration economies and the
location of Taiwanese investment in
China
Chen, George Shih-Ku
Monash University
5 January 2009
Online at
https://mpra.ub.uni-muenchen.de/13896/
Agglomeration Economies and the Location of Taiwanese
Investment in China
George Shih-Ku Chen ∗
January 5, 2009
Abstract
We investigate the effect of agglomeration economies on Taiwanese greenfield investors’
location choice in China from 1996 to 2005. Using a nested logit model, we find that
Tai-wanese investors first select a region in China where he or she wants to invest, before selecting
the best province within that region. Furthermore, we find evidence that, since 2000, market
access, industrial linkages and monitoring costs have become important agglomeration forces
driving Taiwanese investors’ location choice in China. Finally, we discover that the nature
of agglomeration economies varies extensively for Taiwanese investors across different
indus-tries. Taken together, these findings suggest that the Chinese government must formulate
region-wide development strategies and industry-specific policies if it wants to attract more
Taiwanese investment in the near future.
Keywords: Agglomeration economies; China; Nested logit model; Taiwanese investment
∗I would like to thank Russell Smyth, Dietrich Fausten and Robert Rice for their helpful comments and
1
Introduction
New economic geography (NEG), pioneered by Krugman (1991a,b) in the 1990s, has reshaped
our understanding of the spatial distribution of economic activity. Unlike the neoclassical
approach to economic geography, which emphasises the role of comparative advantage, the NEG
literature identifies agglomeration economies as one of the driving forces for the concentration
of certain industries in particular locations (see e.g. Fujita et al., 1999; Baldwin et al., 2003).
Later, researchers extended that idea to the regional distribution of foreign direct investment
(FDI). A majority of empirical studies in this field focus on the United States. In general, these
studies find a positive relationship between agglomeration economies and the distribution of
FDI at the state level (see e.g. Coughlin et al., 1991; Coughlin and Segev, 2000; Shaver and
Flyer, 2000; Chung and Alcacer, 2002). Furthermore, Head et al. (1999) and Bobonis and Shatz
(2003) find that agglomeration economies affect foreign investors’ location choice in the United
States more than fiscal incentives and preferential treatment. They attribute this finding to the
fact that, unlike fiscal incentives and preferential treatment, which can be elusive in the long
run, agglomeration economies can lead to a prolonged improvement in productivity.
There is also strong evidence suggesting that agglomeration economies have a positive effect
on the distribution of FDI within the European Union (see e.g. Meyer, 1998; Resmini, 2000;
Kinoshita and Campos, 2002; Agiomirgiannakis et al., 2003; Head et al., 2004). At the country
level, Driffield (2000, 2002), Driffield and Munday (2001) and Girma (2002) find that foreign
investors in the United Kingdom prefer locations with strong agglomeration economies. In
Portugal, Guimaraes et al. (2000) discover that agglomeration economies help to reduce
trans-action costs for greenfield investors. Along a similar line of reasoning, Deichmann et al. (2003)
suggest that agglomeration economies facilitate flows of information among foreign investors in
Turkey. Bronzini (2004) argue that agglomeration economies inside industrial clusters is a key
attractor for FDI in Italy. Boudier-Bensebaa (2005) and Hilber and Voicu (2005) find that this
agglomeration economies effect also figures prominently in the distribution of FDI in Hungary
and Romania, respectively. Barrios et al. (2006) attribute the rise of Ireland’s high-technology
industry to agglomeration economies among foreign investors.
In another strand of studies, researchers focus on the impact of ‘nationality
nationality, on foreign investors’ location choice. For Japanese investors in the United States,
researchers find that this nationality agglomeration has a non-negligible effect on these investors’
location choice at the county and state levels (see e.g. Woodward, 1992; Smith and Florida, 1994;
Head et al., 1995; Chung and Song, 2004; Head et al., 2004). This nationality agglomeration
is also found to be prevalent among American, Swedish, and French multinationals when they
venture abroad (see e.g. Wheeler and Mody, 1992; Braunerhjelm and Svensson, 1996; Disdier
and Mayer, 2004; Mucchielli and Puech, 2004).
The rise to prominence of China as a destination for FDI has led to an ample empirical
literature investigating the effect of agglomeration economies on this development. Most studies
in this genre attribute the concentration of FDI in China’s coastal region to agglomeration
economies (see e.g. Chen, 1997; Wei et al., 1999; Wei and Liu, 2001; Zhang, 2001; Sun et
al., 2002). However, some researchers cast doubt over the generality of this result due to
the aggregated, provincial-level data used in these studies (see e.g. Cheng, 2007, 2008). This
aggregation of data can lead to loss of valuable information such as the impact of agglomeration
economies on foreign investors from different industries.
In light of the above-mentioned criticism, there has been a nascent literature investigating
the nexus of agglomeration economies and regional distribution of FDI in China using
disag-gregated data. Using firm-level data, Belderbos and Carree (2002) study Japanese electronics
firms’ location choice in China and find that agglomeration economies form an important input
forkeiretsu member firms and medium-sized firms. They attribute this finding to information spillovers associated with nationality agglomeration. Wakasugi (2005) extends Belderbos and
Carree’s study by examining Japanese investors’ location choice in China at the industry level.
He finds that Japanese investors’ location choice is heavily influenced by industry-specific
ag-glomeration economies. Unlike Belderbos and Carree, he finds that nationality agag-glomeration
only has a marginal impact. For Korean investors, Chang and Park (2005) discover that the
emergence of Korean clusters in the northeast of China can be attributed to both nationality
agglomeration and chaebol membership. It is worth noting that because their study excludes
wage rates, this can exaggerate the impact of agglomeration economies.
This positive agglomeration economies effect is not only confined at the firm level. Head and
the location of Japanese equity joint ventures at the city level. However, their finding cannot
be generalised as they exclude FDI by ethnic Chinese, which accounts for roughly two-thirds of
FDI stock in China. To date, with the exception of He (2003), who attributes the co-location
of Hong Kong investors in China to the benefit of nationality agglomeration, there have been
no systematic studies on the impact of agglomeration economies on ethnic Chinese investors’
location choice in China. Therefore, our first motivation for undertaking this study is to fill this
gap in the literature by studying Taiwanese greenfield investors’ location choice in China.
Our second motivation for undertaking this study is to make a methodological contribution
to the extant literature. Most empirical studies of foreign investors’ location choice is based
on conditional logit model (CLM) specifications (Guimaraes et al., 2003). However, for this
model to provide meaningful results, it must be the case that all industrial locations are equally
substitutable (McFadden, 1974). This assumption clearly contradicts the industrial location
literature that postulates no two locations are ever the same; for example, the Silicon Valley
would be a more attractive location choice for high-technology firms than Wall Street (see
e.g. Saxenian, 1994; Woodward et al., 2006). In econometric terms, the presence of industrial
clusters such as the Silicon Valley can lead to ‘overdispersion, or a situation where the data exhibit variances larger than those permitted by the multinomial model’, which casts doubts over the validity of the CLM estimates (Woodward et al., 2006, p.19). In order to control for
this overdispersion effect, most studies use regional dummy variables, on the basis that locations
within the same region share similar attributes (see e.g. Woodward, 1992; Coughlin and Segev,
2000; Cheng and Stough, 2006).
In another group of studies, the CLM model is either combined with Poisson distribution or
Dirichlet-Multinominal distribution to correct for violations of the ‘independence from irrelevant
alternatives’ (IIA) property, i.e. omitting any location alternative from the location choice set
should not change the investor’s decision (see e.g. Guimaraes et al., 2000; Woodward et al.,
2006).
In this paper, we approach this overdispersion problem by applying the nested logit model
(NLM) to Taiwanese greenfield investors’ location choice in China. This approach is also used
by Hansen (1987), Ondrich and Wasylenko (1993) and Cheng (2007) to investigate factors
choice of the NLM is based on the stylised fact that firms often make location choices based
on their prior knowledge of a location, rather than on a detailed evaluation of all possible
location alternatives (see e.g. North, 1974; Rees, 1974; Qu and Green, 1997). To capture this
limited search process, we assume that Taiwanese greenfield investors’ location choice in China
as essentially follows a ‘sequential selection process’ in which Taiwanese investors first select a
region that is familiar to them, before identifying the best location for undertaking investment
within that region.1
By grouping closely substitutable location alternatives into one subset, we
are able to minimise potential violations of the IIA property. Our study represents the first
attempt to apply the NLM specification to Taiwanese greenfield investors’ location choice in
China.
The rest of the paper is organised as follows. The next section provides the model and
presents the econometric methodology. In the third section we discuss the data set and
poten-tial agglomeration forces attracting Taiwanese greenfield investment. We discuss the empirical
results in the fourth section. The final section summarises the main findings of the paper.
2
The Model
2.1 The Nested Logit Model
In studying firm location choices, CLM is the most commonly adopted approach. It was first
developed by McFadden (1974) based on the random utility maximisation specification proposed
by Marschak (1960). Consistent with the neoclassical theory of utility maximisation, it assumes
that a decision-maker would choose an alternative if it yields the highest utility. As Carlton
(1983) shows, firm location choices can be seen as a variant of Marschak’s random utility
maximisation problem. Specifically, if firms are assumed to be profit maximisers, then they will
only establish plants in locations with the highest level of expected profit. Formally, firmi will establish a plant in location j, if and only if,
πij > πis∀j6=s (1)
1
The actual profit delivered by each location alternative to the firm is, however, not directly
observable. This is because there are two components to this unknown profit function; namely,
a ’deterministic’ and a ’stochastic’ component. Formally, this unknown profit function of firm
i in location j can be expressed as:
πij =Vij +ǫij =βijXij +ǫij (2)
where Xij are observable characteristics of a location alternative and ǫij is a stochastic factor
capturing any profit differences resulting from all unobservable factors. The existence of the
random component is equation (2) means that one cannot be absolutely certain about the
exact location choices made by firms. However, McFadden (1974) suggests that one can infer
the probability of a location being selected by a firm if ǫij are independently and identically
distributed (IID) according to an extreme-type-value 1 Weibull distribution. Mathematically,
the probability of firmi choosing location j can be expressed as:
P r(Yi=j) =
exp(Xijβi)
Pj
s=1exp(Xisβi)
(3)
The increasing popularity of CLM in the study of discrete choices can be attributed to its
computational convenience because the IID stochastic component allows a closed-form
probabil-ity solution as shown in equation (3). However, for equation (3) to hold, it requiresǫij to satisfy
the IIA property, or the probability ratio of any two location alternatives depends only on their
own attributes and is independent of other available location alternatives. This is because, in
any good specification of CLM, the independent variables should capture all observable
char-acteristics in which the stochastic component ǫij are not correlated (Ben-Akiva and Lerman,
1985). To put it differently, firms consider all location alternatives as equally substitutable and
omitting any of them from the location choice set should not have any material impact on firms’
location choice (Train, 2003).
Given the importance of the IIA property, Hausman and McFadden (1984) propose a
diag-nostic test by comparing estimated CLM coefficients of an ‘unrestricted’ model that is derived
from the whole choice set and a ‘restricted’ model in which some alternative choices are
choice set was truly irrelevant, then omitting it from the restricted model should not produce
any statistically significant different results than those provided by the unrestricted model. In
the industrial location literature, violations of the IIA property may not be problematic if
pos-sible location alternatives are geographically quite distant (Carlton, 1983). However, this may
not apply to the case of China, where possible location alternatives are not equally substitutable
due to geographic features and past economic policy (see e.g. Bao et al., 2002). For instance,
Beijing and Tianjin or Jiangsu and Zhejiang might be a closer substitute than Fujian and
Xizang.
As our earlier discussion suggests, the conventional approach for controlling potential
viola-tions of the IIA property is to use regional dummy variables, which capture similar unobservable
location characteristics within a region. However, the major shortcoming associated with this
approach is that it provides little information regarding firms’ location choice, particularly with
respect to our hypothesised sequential path of Taiwanese greenfield investors’ location choice in
China. By contrast, the NLM relaxes this IIA property by dividing the choice set into mutually
exclusive subsets, with this property continuing to hold within, but not across, these subsets
(Train, 2003). In other words, each subset in the NLM specification contains choices with similar
location attributes. This choice model can then be described by a sequential selection process,
where the firm first considers a choice between subsets (the upper nest) and then makes a choice
for one of the location alternatives in the chosen subset (the lower nest).
In order to construct a specification of NLM that reflects this sequential selection process
on Taiwanese greenfield investors’ location choice in China, we need two separate specification
of CLM. Formally, if we divide China into regions r = 1,2, . . . , R and denote provinces p =
1,2, . . . , P, each investor will choose the location alternative that maximises its profit stated in
equation (2). In addition, the function of observed characteristicsVrpdepends simultaneously on
characteristics of the nestYr (the region) and on location attributes that vary across provinces
Xrp. We obtainVrp=βXrp+αYr, whereαandβare vectors of the parameters to be estimated.
The probability of a Taiwanese greenfield investor choosing a region in China depends
si-multaneously on the investor’s own characteristics and on the location attributes of province
the nest, called ‘inclusive value’ (Ir):
Ir=log Pr X
i=1
exp(βXir) (4)
Consequently, the probability of a Taiwanese greenfield investori chooses a region r in China is:
P r(Yi =r) =
exp(σIr+αYr)
PR
j=1exp(σIj+αYj)
(5)
The probability that this investor i chooses a province p within region r in China can be expressed as P r(p|Yi=r) =P r(r|Yi=p)×P r(Yi =r) where
P r(p|Yi=r) =
exp(βXrp)
PCp
i=1(βXri)
(6)
That is to say:
P r(p|Yi =r) =
exp(βXir)×exp(σIr+αYr)
PR
j=1exp(σIj+αYj)×(Ir)
(7)
where the coefficient attached to Ir, or σ, is a measure of the degree of independence between
province alternatives within the same nest (or subset). In general, σ has a range between zero
and one, with a smaller σ indicating that the province alternatives within the nest are close
substitutes (Maddala, 1983). Mucchielli and Puech (2004) suggest that if σ equals zero, then
all province alternatives within that nest would be completely dependent, turning the NLM
specification into a standard CLM specification. Similarly, if σ equals one, then all province
alternatives would be completely independent and the NLM specification becomes superfluous.
In short, σ serves as an indicator for a nested structure of Taiwanese greenfield investors’
location choice in China, with 1−σ measuring the degree of similarity between regions (see e.g.
Cheng, 2007). To put it differently, this means that if σ were statistically significant and all
fell within the range between zero and one, then we may conclude that these investors’ location
choice follows a sequential selection process; that is, Taiwanese investors would first choose their
desired region and then select a specific province within that region in which to invest (see e.g.
2.2 Estimation Procedure
In order to test whether Taiwanese greenfield investors’ location choice in China follow a
se-quential selection process and the location attributes that give rise to such a process, we first
estimate three separate specifications of CLM. Specifically, the first CLM specification that we
estimate covers the sample period 1996-2005 and serves as our baseline model. The second and
third CLM specifications divide this period into two sub-sample periods; namely, 1996-2000
and 2001-2005. The rationale for this split is to examine whether there is a structural break
in Taiwanese investors’ location choices following the change in the policy governing Taiwanese
investment in China in 2000.
In terms of estimating these three CLM specifications, we employ the maximum likelihood
method. Consistent with convention, we examine the likelihood ratio,χ2
, with a higher value of
this ratio suggesting joint significance of independent variables in the model. We also examine
the overall goodness-of-fit of the model by referring to the likelihood ratio index, ρ2 . It is
worth noting that although there does not yet exist a preferred level ofρ2, the consensus in the
existing literature is that ifρ2 takes a value within the range 0.2 and 0.4, then the model can
be considered as having a reasonable level of goodness-of-fit (see e.g. Greene, 2000).
As our earlier discussion suggests, for CLM estimates to be robust, there must be no
viola-tions of the IIA property. To ascertain that this is the case, we test NLM specificaviola-tions. The logic
behind these specifications is that if Taiwanese greenfield investors’ location choice in China
fol-lows a sequential process, then the inclusive value coefficients within these specifications should
be statistically significant and fall within the range of zero and one. Following Cheng (2007),
we divide China according to the Open Door policy and traditional census regions, which may
have non-negligible effects on Taiwanese investors. Specifically, the first specification is based
on the Open Door policy in which the Eastern region was first opened to FDI, followed by the
Central and Western regions.2
This gradualist approach is expected to have a non-negligible
impact on Taiwanese investors’ location choice. Hence, our objective is to test the hypothesis
that Taiwanese investors would first choose their desired Open Door policy region and then
select a specific province within that region.
2
The second specification is based on the six traditional census regions in China; namely,
Huabei,Dongbei, Huadong, Huazhong,Xinan and Xibei.3
Our objective in selecting this
divi-sion is to test the hypothesis that Taiwanese investors first select their preferred census region
before choosing a province within that region. Analysis of the impact of these census regions
on Taiwanese investors’ location choice is important because provinces within the same census
region tend to share similar historical, cultural and ethnical ties. These characteristics imply
that, if the Chinese policymakers want to attract further inflow of FDI, then they need to
im-prove the investment environment of the entire census region, rather than focusing on individual
provinces.
Apart from dividing our sample size according to regions, we also split the entire sample
period into two sub-sample periods; namely, 1996-2000 and 2001-2005. This split is designed to
asseess the impact of policy changes in 2000 on Taiwanese investors’ location choice.
It is well-documented in the industrial location literature that the impact of location
at-tributes is industry-specific. In order to examine this hypothesis, we divide our sample firms
according to industry, and perform our baseline CLM specification on these sub-samples. It is
worth pointing out that because the dependent variable in this specification is the probability
of a Chinese province being selected by a Taiwanese greenfield investor, the resulting estimated
coefficients do not directly measure the marginal effect of location attributes on that investor’s
location choice. As such, we interpret the estimated coefficients by adopting the ’average
prob-ability elasticity’, or the sum of probprob-ability elasticity across all individual investors and location
alternatives (see e.g. Head et al., 1995; Wakasugi, 2005; Cheng, 2008). Formally, the average
probability elasticity of a Taiwanese greenfield investor i choosing a Chinese province p with location attributeXk can be calculated as follows:
Eipk = ∂P r(Yi=p) ∂Xk
Xk
P r(Yi =p)
=βk(1−P r(Yi =p)) (8)
This average probability elasticity of location attributeXkthen can be obtained by summing
3
all investors and provinces:
Ek=
N
X
i=1 24
X
p=1
Eipk =βk
P −1 P =βk
24−1
24 = 0.96βk (9)
whereP is the total number of provinces in China andβkis the estimated coefficient of location
attributeXk, its estimated marginal effect, is equal to 96 percent of βk.
3
Data and Variables
3.1 Identification of Taiwanese Greenfield Investors
This paper examines the Taiwanese greenfield investors’ location choice in China from 1996
to 2005. This selection of the unit of analysis is justified on the following grounds. First,
unlike merger and acquisition in which the location of investment is often pre-determined, these
investors are free to establish plants at any location in China. Second, given the substantial costs
involved in establishing foreign production units, these investors are more responsive to fiscal
incentives and preferential treatment at the regional level. We incorporate this by dividing China
into two subsets according to the Open Door policy and census regions. Third, and perhaps
more importantly, since plant relocation is costly, a better understanding of these investors’
location choices sheds light on their global investment strategies and mixed performance in
China.
We employ both CLM and NLM specifications to analyse Taiwanese greenfield investors’
location choice in China. The information related to this investment is obtained from Taiwan’s
Ministry of Economic Affairs (MOEA). According to MOEA, during the period from 1996 to
2005, there was a total of 2,131 greenfield investments in China made by Taiwan’s public listed
companies. We investigated the greenfield investment undertaken by these companies, on the
basis that they feature prominently in the economic exchanges between China and Taiwan.
We also omit greenfield investments that are not explicitly registered with MOEA. Finally, we
exclude those investors who re-invest in, or withdraw their involvement from, China. In other
words, our study focuses exclusively on these investors’ initial location choice, not on their
operational success or failure in subsequent periods.
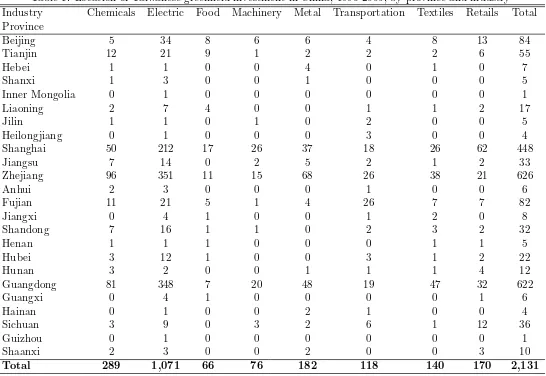
set to be chosen at least once (see e.g. Head et al., 1995; Belderbos and Carree, 2002). Table
1 shows that, during the period 1996–2005, Xinjiang, Tibet, Gansu, Yunnan, Qinghai and
Ningxia received no Taiwanese greenfield investment at all. As a consequence, we exclude these six provinces from the choice set. In order to maintain consistency and constrained by data
availability, we regard investment inChongqing as part of greenfield investment inSichuan. It is worth noting that, since provinces with no such investment are excluded from the sample, this
can generate potential sample selection bias. Therefore, we interpret the dependent variable in
our analysis as the probability of a province being chosen from the remaining 24 provinces by
Taiwanese investors.
[Insert Table 1]
3.2 Identification of Agglomeration Forces
3.2.1 Market Access
Economic liberalisation has resulted in China opening up its domestic market to foreign
in-vestors. This change has encouraged many Taiwanese investors to establish production
facili-ties in large Chinese provinces for two reasons. Firstly, it enhances the prospects of realising
economies of scale in production and transportation of final goods. Secondly, it increases the
likelihood of these investors reaching new customers. Therefore, all things being equal, the
probability of a Chinese province being selected by Taiwanese greenfield investors increases
with market access.
The most commonly used measurement of market access is the level of gross provincial
product (GPP), on the basis that a higher level of GPP implies a higher purchasing power of
residents in the province (see e.g. Belderbos and Carree, 2002; Zhou et al., 2002; Cheng and
Stough, 2006; Kang and Lee, 2007). In contrast, some studies have suggested that population
density may be a better indicator of market size as a higher population density suggests a higher
market potential (see e.g. Zhou et al., 2002; Chang and Park, 2005). In our study, we will use
3.2.2 Industrial Linkages
The extent of industrial linkages affects the willingness of Taiwanese investors to invest in a
province. This is because by locating in a province with a strong industrial base, it enhances
the ability of Taiwanese investors to source raw and intermediate inputs from local suppliers
and the likelihood of these investors to become intermediate input suppliers within that local
industrial network. Furthermore, it allows Taiwanese investors better access to specialised input
providers such as consultancy, banking and finance and other professional services. Therefore,
all things being equal, the probability of a province being selected by Taiwanese greenfield
investors increases with industrial linkages.
Three potential measures of local industrial linkages are widely investigated in the existing
literature. The first measure is based on the argument that the likelihood of a firm becoming a
supplier to other firms increases with the number of manufacturing firms in the province (see
e.g. Head and Ries, 1996; Zhou et al., 2002; Chang and Park, 2005; Wakasugi, 2005). The second
measure is based on the premise that provinces with a higher number of manufacturing workers
indicate a better availability of specialised services (see e.g. Head and Ries, 1996; Chang and
Park, 2005; Cheng, 2007). The third measure is based on the network effect, which suggests
that foreign investors from the same country tend to co-locate in the same provinces as they
simply extend industrial linkages established in the home countries to the host countries (see
e.g. Head and Ries, 1996; Chang and Park, 2005; Wakasugi, 2005; Cheng and Stough, 2006;
Cheng, 2007). We will investigate these potential measures for industrial linkages in this study
and expect a positive sign.
3.2.3 Labour-market pooling
Traditionally, the majority of Taiwanese investors in China have originated from export-oriented,
labour-intensive industries. For these investors, securing low-cost workers is critical to their
in-ternational competitiveness. In recent years, however, these investors belonging to the
capital-intensive and high-tech industries have increased their presence in China. By locating in
provinces with an ample supply of well-educated workers, these investors have a higher
proba-bility of finding specialised workers. Therefore, the probaproba-bility of a province being selected by
In measuring the impact of labour-market pooling, the average real wage rate is often used
in the existing literature (see e.g. Belderbos and Carree, 2002; Zhou et al., 2002; Wakasugi,
2005; Cheng and Stough, 2006; Kang and Lee, 2007). However, the average real wage rate
may not be a good indicator due to its high correlation with labour quality. This potential
endogeneity has led some studies to suggest measures of labour quality, such as the proportion
of people receiving secondary or higher education to total population (Cheng, 2007). Meanwhile,
other studies attempt to circumvent the problems associated with average wage rates by using
efficiency wage rates instead (see e.g. Head and Ries, 1996; Belderbos and Carree, 2002). Both
measures for the effect of labour-market pooling will be examined in this study and we expect
a negative sign.
3.2.4 Trade Costs
The level of trade costs is expected to feature prominently in the locational choices of Taiwanese
investors in China. This is because the trade costs associated with shipping intermediate inputs
in and out of production facilities, as well as distributing final goods to consumers, account for
a significant proportion of the operational expenses facing Taiwanese investors. Reductions in
trade costs, in effect, increase their profitability in China. Therefore, all things being equal, the
probability of a province being selected by Taiwanese greenfield investors increases with a low
level of trade costs.
In the existing literature, transportation density in a province is the most commonly used
measurement (see e.g. Zhou et al., 2002; Chang and Park, 2005; Wakasugi, 2005; Cheng and
Stough, 2006; Kang and Lee, 2007; Cheng, 2007). Given the importance of exports to the
Chinese economy, some studies have used the number of seaports and airports as alternative
measures of trade costs (see e.g. Head and Ries, 1996; Belderbos and Carree, 2002). We will
focus on the effect of provincial transportation densities, such as highways, railways, and the
combination of highways and railways, on Taiwanese greenfield investors’ location choice in
China. We expect a positive sign on these transportation densities.
3.2.5 Monitoring Costs
The extent of industrial linkages affects the willingness of Taiwanese investors to invest in a
of Taiwanese investors to source raw and intermediate inputs from local suppliers is enhanced,
as is the likelihood of becoming intermediate input suppliers within local industrial networks.
Furthermore, it allows Taiwanese investors better access to specialised input providers such as
consultancy, banking and finance and other professional services. Therefore, all things being
equal, the probability of a province being selected by Taiwanese greenfield investors decreases
with monitoring costs.
There are two commonly used measures for monitoring costs in the existing literature. The
first is provincial telephone density, on the basis that the share of local residents who have access
to telephone sets reduces monitoring costs (Head and Ries, 1996). And the second is based on
the provincial output of postal and telecommunication industries and the number of employees
in these industries (Wei and Liu, 2001). In general, higher provincial output of, and more
local employees in, postal and telecommunication industries suggest a better communication
infrastructure, which is necessary for reducing monitoring costs. We expect a positive sign on
these two measures.
3.3 Data
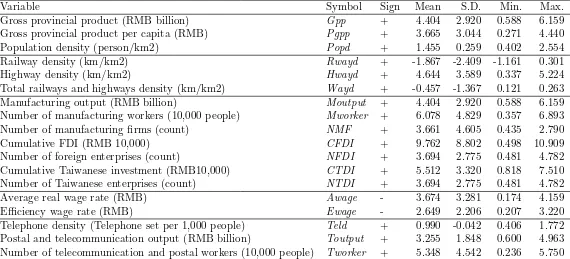
Table 2 provides summary statistics of 18 commonly proposed proxies for the agglomeration
forces identified in Section 3.2, with the data taken from various issues of China Statistical Yearbook and Statistics on Approved Indirect Mainland Investment by Year and Area. In con-structing that table, we convert GPP, GPP per capita and provincial outputs of manufacturing
and postal and telecommunication industries into 1990 prices using the gross domestic product
(GDP) deflator for the relevant province. Similarly, the consumer price index for the relevant
province is used to convert the provincial wage rates into 1990 prices. In order to obtain the
respective densities, we adjust the population size, the total length of railways and highways
and the number of telephone sets for landmass of the relevant province. In terms of the figures
for cumulative FDI and Taiwanese investment in each province, we make 1996 our reference
point and use the GDP deflator for the relevant province to deflate the stock of these investors
since 1996. Finally, the numbers of foreign-invested and Taiwanese enterprises in the province
are year-end figures.
The main problem in Table 2 is that these variables tend to overlap with one another,
which gives rise to potential multicollinearity. In order to avoid spurious results, it is important
to retain variables that are pertinent to the distribution of Taiwanese greenfield investment
across China. To achieve that end, we calculate the Pearson correlation coefficient matrix by
transforming these variables into their natural logarithm and stacking them across provinces.
Gujarati (1995) suggests that, as a rule of thumb, multicollinearity poses a serious problem if
the Pearson pair-wise correlation exceeds 0.6. A visual inspection examination of Table 3 reveals
that there is a high degree of correlation among the proposed variables for agglomeration forces
(as highlighted in bold).
[Insert Table 3]
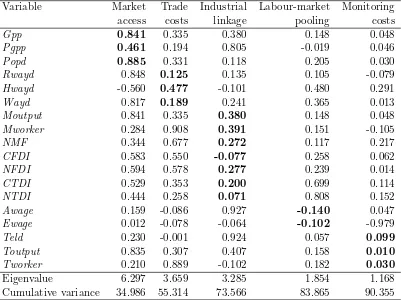
In order to select the best proxies for the agglomeration forces affecting the annual inflow
of Taiwanese investment across China, we perform factor analysis. As pointed out by Cramer
(2003), factor analysis is the simplest and most widely used approach in data reduction.4
How-ever, before we perform factor analysis, it is useful to standardise the variables for two reasons.
Firstly, standardisation controls for substantial inter-provincial differences in location attributes,
such as population and landmass, by removing the unit of measurement from the variables.
Sec-ondly, the standardised variables can be expressed exactly as a linear combination of common
factor scores of the principal components.
Factor analysis using Varimax with Kaiser Normalisation is conducted on the data matrix
of the 18 variables listed in Table 1 from 1996 to 2005.5
After seven iterations, we removed
items that are highly loaded on more than one factor and ended up with the five factors shown
in Table 4. In this solution, factor retention is based on scree plots and eigenvalues. These
five factors account for approximately 90 percent of the variance in the 18 variables identified.
Specifically, market access indicates the market potential in a province via GPP (Gpp), GPP per capita (Pgpp), and population density (Popd). The length of railways (Rwayd), highways (Hwayd), and the combined length of railways and highways (Wayd) adjusted for the landmass indicate transportation network coverage in a province, hence the label trade costs. Industrial
4
This is also the approach adopted by Zhou et al. (2002) in their study of Japanese investors’ location choice in China.
5
linkages comprise manufacturing output (Moutput), the number of manufacturing firms (NMF), the number of manufacturing workers (Mworker), the cumulative stocks of FDI (CFDI) and Taiwanese investment (CTDI), and the number of registered projects affiliated with foreign capital (NFDI) and Taiwanese capital (NTDI). Average wage rate (Awage) and efficiency wage rate (Ewage) are variables measuring the impact of labour-market pooling. Telephone density (Teld) and the output of postal and telecommunication industries (Toutput), and number of postal and telecommunication employees (Tworker) are potential proxies for monitoring costs.
[Insert Table 4]
As Table 4 shows, Popd is the best proxy for market access. Trade costs are best captured by Hwayd. Mworker explains most of the variations in industrial linkages. We select Ewage
and Teld to measure the impacts of labour-market pooling and monitoring costs, respectively. These results are consistent with the discussion in Section 3.2; namely, the probability of a
Chinese province being selected by Taiwanese investors increases with Popd, Hwayd,Mworker
and Teld, while it decreases with Ewage. In order to ensure that there is no multicollinearity between these variables, we reconstruct the Pearson pair-wise correlation coefficient matrix. As
expected, Table 5 indicates that there is no significant degree of correlation among the five
selected proxies for agglomeration forces.
[Insert Table 5]
4
Empirical Results
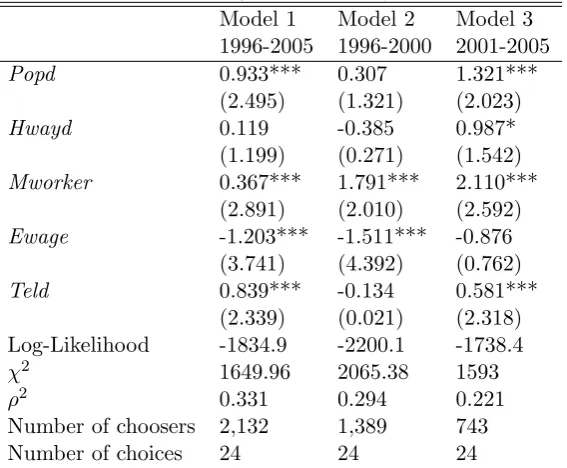
4.1 Conditional Logit Estimates
In this section, we discuss the CLM estimates of the response of Taiwanese investors in China
to different types of agglomeration force for the full and sub-sample periods. The estimation
results are presented in Table 6. For the full sample period 1996-2005 (Model 1), provincial
population density (Popd), provincial number of manufacturing workers (Mworker) and provin-cial telephone density (Teld) have significantly positive effects on the probability of a province being selected by Taiwanese investors. In contrast, the level of provincial efficiency wage rate
provinces with strong effects of market access, industrial linkages and labour-market pooling,
while they avoid provinces with a strong effect of monitoring costs.
[Insert Table 6]
We also make year 2000 our reference point and use it to divide the full sample period into
two sub-sample periods; namely, 1996-2000 and 2001-2005. Comparing the results of Models 2
and 3 in Table 6 show that the change in cross-Strait policy in 2000 have had a non-negligible
impact on Taiwanese investors’ location choice in China. For the period 1996-2000 (Model 2),
the probability of a province being selected by Taiwanese investors increases withMworker and it decreases withEwage. In contrast, for the period 2001-2005 (Model 3), whileMworker is still an important agglomeration force attracting Taiwanese investors, the impacts of Popd,Hwayd
andTeld have all increased in importance. These results suggest that, since 2000, the effects of market access, trade costs and monitoring costs have become important agglomeration forces.
The different results obtained for the two sub-sample period analyses suggest that there is
a possible structural break in Taiwanese investors’ location choice in China during the period
1996-2005. Potential sources of this structural break range from a series of economic reforms
in China in the late 1990s in preparation for joining the World Trade Organisation (WTO)
to major changes in cross-Strait policy after 2000. For instance, the increase in importance
of Popd could be attributed to China allowing Taiwanese investors greater domestic market access after its accession to the WTO after 2000. In addition, the larger coefficient onMworker
during the period 2001-2005 could indicate a greater proportion of Taiwanese investors engaged
in local procurement of raw and intermediate inputs, with the availability of these inputs
de-pending on the extent of local industrial linkages. The statistical significance of the coefficient
on Teld during the period 2001-2005 may arise from the emerging pattern of cross-Strait divi-sion of labour in which Taiwanese headquarters mainly undertake sales and R&D activities and
their Chinese subsidiaries undertake most of the production activity. With these arguments, a
sound telecommunication infrastructure is indispensable to the smooth running of cross-border
operations, which in turn reduces monitoring costs.
Perhaps the most important result stemming from the sub-sample period analysis is that,
during the period 2001-2005, the level of Ewage had no material effect on Taiwanese investors’
lifting of restrictions on the investment activities of high-tech and capital-intensive industries
by the Taiwanese government after 2000. For these investors, it is labour quality, rather than
the level of the wage rate, that ultimately determines their competitiveness, both at the local
and international levels.
It is also worth noting that although both the likelihood ratio χ2
and the likelihood ratio
index ρ2
are satisfactory for all three models, Table 6 suggests that our CLM specification
seems to explain Taiwanese greenfield investors’ location choice in China better for the period
1996-2000. In part, these differences in the goodness-of-fit across models could be attributed
to the changing nature of Taiwanese investors. For example, during 1996-2000, the majority of
Taiwanese investors originated from traditional, labour-intensive industries which tended to be
attracted by the same set of agglomeration forces. In contrast, since 2000, Taiwanese investors
have originated from a wide array of industries, with each industry sharing a distinctively
different ideal set of agglomeration forces. In other words, the widening and deepening of
Taiwanese investment in China in recent years may be the main reason for the diminishing
explanatory power of the CLM specification.
4.2 Nested Logit Estimates
One of the main criticisms of the CLM specification is that its estimated coefficients and
robust-ness are sensitive to violations of the IIA property. In order to ensure that our CLM estimates
are free from any such violation, we apply NLM specifications to the sample. The basic idea
here is that if CLM is truly independent of any violation of the IIA property, then inclusive
value (IV) coefficients should be statistically insignificant and fall outside the range of zero and
one.6
Consistent with Section 4.1, we present the NLM estimates for the entire sample, as well
as for the two sub-sample periods. In addition, we divide China according to the three Open
Door policy regions (3R) and the six traditional census regions (6R) as a means of capturing
the sequential selection process of Taiwanese greenfield investors’ location choice in China.
[Insert Table 7]
6
Table 7 presents the results using the NLM specifications. We find that inclusive value
coefficients in all three NLM specifications for 3R (Models 1-3) are both statistically significant
and fall within the range between zero and one. This finding suggests that the Taiwanese
investors’ location choice in China does, indeed, follow a sequential selection process, or these
investors first choose an Open Door policy region and then select a specific province within
that region. In contrast, we find that traditional census regions have no impact on Taiwanese
investors, as evidence in the associated IV coefficients in all three NLM specifications for 6R
(Models 4-6) are not statistically significant and fall outside the range between zero and one.
Finally, recall that IV coefficients indicate the degree of choice substitutability, and that these
coefficients for all three NLM (3R) specifications belong to the unit interval (0,1). This suggests
that nested provinces within each Open Door policy region are relevant, with the coefficient
1−σ providing the degree of similarity across province alternatives. From Table 7, we can see
that any pair of provinces belonging to the same Open Door policy region is quite different, as
the value of IV coefficients ranges between 0.63 and 0.69.
Furthermore, nesting provinces within Open Door policy regions seems to be a good
speci-fication for Taiwanese greenfield investors’ location choice in China according to the likelihood
ratio χ2
and likelihood ratio index ρ2
for Models 1-3 in Table 7. It is also worth noting that
all significant variables are consistent with a priori expectations. These results are also
qual-itatively the same as those obtained under CLM specifications in Section 4.1. That is to say,
the probability of a province being selected by these investors increases with the effects of
mar-ket access, industrial linkages and labour-marmar-ket pooling, while it decreases with the effect of
monitoring costs.
In summary, in our NLM estimations, the significance of IV coefficients demonstrates that
independently modelling Taiwanese greenfield investors’ location choice in China, such as using
CLM specifications, constitutes an inappropriate approach. Instead the correct econometric
method should be the NLM specifications, with the Open Door policy regions composing the
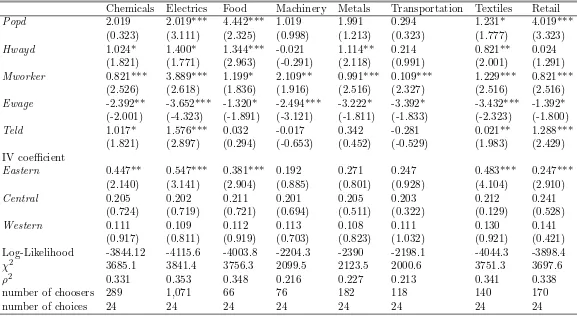
4.3 Location Choice at the Industry Level
Locational determinants are expected to vary according to the nature of the industry. As such,
we divide the sample according to industry group; namely, Chemicals, Electrics and Electronics,
Food Processing, Machinery, Metals, Transportation, Textiles and Retails and Services. We then
re-apply the NLM specification for three Open Door policy regions (Model 1 in Table 7) to each
industry group.
Table 8 shows that estimated results vary extensively across these eight industries.
Specifi-cally, the effect of provincial population density (Popd) is not common across industries, as it only positively affects Taiwanese investors in Electrics and Electronics, Food Processing and
Re-tails and Services. This finding is consistent with the view that many investors in these industries
are attracted to China’s mass market (see e.g. Belderbos and Carree, 2002; Zhu, 2005; Cheng,
2007). In addition, we find that provincial highway density (Hwayd) positively affects Taiwanese investors in Chemicals, Electrics and Electronics, Food Processing, Metals and Textile. This
finding is to be expected as an extensive transportation network facilitates ’Just-in-Time’ supply
chain management in these industries (see e.g. Tung, 2004; Zhu, 2005). Provincial telephone
Density (Teld) positively affects Taiwanese investors in Chemicals, Electrics and Electronics, Textiles and Retails and Services. This finding is consistent with the view that a high level of
monitoring costs can be a deterrent for FDI (see e.g. Robert-Nicoud, 2002; Lin and Png, 2003).
Both the provincial number of manufacturing workers (Mworker) and provincial efficiency wage rate (Ewage) affects Taiwanese investors across all industries. These findings reflect the fact that worsening production conditions in Taiwan forced many of these investors to move their
production facilities to China (see e.g. Chu, 1993; Chen Chiu, 1995; Cheng, 2001). Finally,
fis-cal incentives and preferential treatment given to foreign investors in the Eastern region under
the Open Door policy has a positive effect on Taiwanese investors in Chemicals, Electrics and
Electronics, Food Processing, Textiles and Retails and Services.
[Insert Table 8]
In summary, Table 8 suggests that industrial linkages and labour-market pooling, coupled
with the Open Door policy, explains a large proportion of the uneven distribution of Taiwanese
and Electronics, Food Processing, Textiles and Retails and Services follow a sequential selection
process when making location decisions.
It is worth noting that estimated coefficients of almost all the variables for industries such
as Machinery, Metal and Transportation are statistically insignificant. Specifically, the
Log-Likelihood ratioρ2
of these industries fall outside of the range of 0.2 and 0.4, indicating that our
model specification may not be an appropriate choice for analysing Taiwanese investors’ location
choice in China. To state it differently, these investors may face industry-specific factors that
differ from those in other industries, perhaps in terms of input production technology.
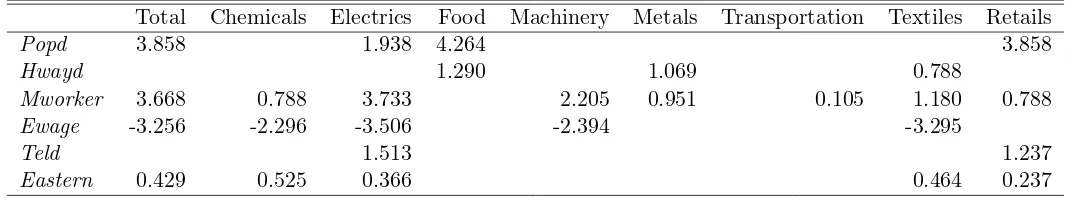
We conclude this section by presenting the average elasticity of probability for the eight
industries. Table 9 shows that a 1% increases in Popd, it raises the probability of a province being chosen by Taiwanese investors in China by 3.86%. Similarly, a 1% increases inMworker
increases the probability of a province being chosen by Taiwanese investors by 3.67%. Finally,
a 1% increases in Ewage decrease the probability of a province being chosen by Taiwanese investors by 3.26%. These results suggest that the effects of market access, industrial linkages
and labour-market pooling may explain a large extent of the distribution of Taiwanese greenfield
investment in China.
[Insert Table 9]
A closer inspection of Table 9 indicates that the impact of market access is found to affect
Taiwanese investors in Food Processing and Retail and Services more than other industries. The
impact of labour-market pooling is found to affect Taiwanese investors in Chemicals, Electrics
and Electronics, Machinery and Textiles more than other industries. For Taiwanese investors
in Electrics and Electronics and Machinery, the extent of industrial linkages is considered an
important location attribute. Finally, the Open Door policy has a significant positive impact
on Chemicals, Electrics and Electronics, Textiles and Retails and Services.
5
Conclusion
The aim of this paper was to explore the nature of agglomeration forces attracting Taiwanese
investors in China during the period 1996-2005. In particular, we test the hypothesis that
applying the NLM specification to firm-level data, we find that Taiwanese investors first select
the desired Open Door policy region, before selecting a province within that region. Given
the fact that the Eastern region has a better investment environment as a result of its long
history in hosting FDI, this finding suggests that if the objective of Chinese policymakers is
to attract FDI into the Central and Western regions, they would need to improve the general
investment environment in these areas, not just focusing on the investment environment of
individual provinces.
Secondly, we find that there is a structural break in Taiwanese investors’ location choice
in China. Specifically, we find that the impact of labour-market pooling, as measured by
provincial efficiency wage rate, has diminished since 2000. In contrast, the impacts of market
access, industrial linkages and monitoring costs all have grown in importance since 2000. These
findings suggest that while low labour cost remains one of the main sources attracting these
investors, Chinese policymakers must design policies that open up domestic market to foreign
investors, strengthen local industrial bases and improve telecommunication infrastructure if
they are going to attract further Taiwanese investment.
Last, but not least, we find that although agglomeration forces such as market access,
industrial linkages and labour-market pooling affect Taiwanese investors’ location choice in
China, their impact varies extensively across industries. This result suggests that there may be
References
Agiomirgiannakis, George, Dimitrios Asterious, and Kalliroi Papathoma, “The
de-terminants of foreign direct investment: A panel data study for the OECD countries,” 2003.
Baldwin, Richard E., Rikard Forslid, Philippe H. Martin, Gianmarco Ottaviano,
and Frederic Robert-Nicoud,Economic Geography and Public Policy, Princeton: Prince-ton University Press, 2003.
Bao, Shuming, Gene Hsin Chang, Jeffrey D. Sachs, and Wing Thye Woo, “Geographic
factors and China’s regional development under market reforms, 1978-1998,”China Economic Review, 2002, 13(1), 89–111.
Barrios, Salvador, Eric Strobl, and Holger Gorg, “Multinationals’ location choice,
ag-glomeration economies and public incentives,” International Regional Science Review, 2006,
29 (1), 89–107.
Belderbos, Rene and Martin Carree, “The location of Japanese investment in China:
Ag-glomeration effects, keiretsu, and firm heterogeneity,”Journal of Japanese and International Economies, 2002,16 (2), 194–211.
Ben-Akiva, Moshe and Steven R. Lerman,Discrete Choice Analysis: Theory and Appli-cation, Cambridge, MA: MIT Press, 1985.
Bobonis, Gustavo J. and Howard J. Shatz, “Agglomeration economies, investment
pro-motion and the location of foreign direct investment in the United States,” 2003.
Boudier-Bensebaa, Fabienne, “Agglomeration economies and location choice: Foreign direct
investment in Hungary,” Economics of Transition, 2005, 13(4), 605–628.
Braunerhjelm, Pontus and Roger Svensson, “Host country characteristics and
agglomer-ation in foreign direct investment,”Applied Economics, 1996,28 (7), 833–840.
Bronzini, Raffaello, “Foreign direct investment and agglomeration: evidence from Italy,”
Carlton, Dennis W., “The location and employment choices of new firms: An econometric
model with discrete and continuous endogenous variables,” Review of Economics and Statis-tics, 1983, 65(3), 440–449.
Chang, Sea-Jin and Sekeun Park, “Types of firms generating network externalities and
MNCs’ co-location decisions,” Strategic Management Journal, 2005,26 (7), 595–615.
Chen, Chunlai, “Provincial characteristics and foreign direct investment location decision
within China,” 1997.
Cheng, Shaoming, “Structure of firm location choices: An examination of Japanese greenfield
investment in China,” Asian Economic Journal, 2007, 21(1), 47–73.
, “How can western China attract FDI? A case of Japanese investment,”Annuals of Regional Science, 2008, 42, 357–374.
and Roger R. Stough, “Location decisions of Japanese new manufacturing plants in China:
A discrete-choice analysis,” Annuals of Regional Science, 2006, 40(2), 369–387.
Cheng, T.-J., “The economic significance of Taiwan’s democratization,” in Zhaocheng Mai
and Jiansheng Shi, eds., Taiwan’s Economic Success Since 1980, Cheltenham, UK: Edward Elgar, 2001.
Chiu, Lee-In Chen, “The pattern and impact of Taiwan’s investment in mainland China,”
in Sumner J. La Croix, Michael G. Plummer, and Keun Lee, eds.,Emerging Patterns of East Asian Investment in China: from Korea, Taiwan and Hong Kong, Armonk: M.E. Sharpe, 1995.
Chu, J. J., The Political Economy of Post-1980s Taiwanese Foreign Investment, Murdoch, WA: Asia Research Centre, Murdoch University, 1993.
Chung, Wilbur and Jaeyong Song, “Sequential investment, firm motives, and
agglomera-tion of Japanese electronics firms in the United States,” Journal of Economics and Manage-ment Strategy, 2004, 13(3), 539–560.
and Juan Alcacer, “Knowledge seeking and location choice of foreign direct investment in
Coughlin, Cletus C. and Eran Segev, “Location determinants of new foreign-owned
man-ufacturing plants,”Journal of Regional Science, 2000, 40(2), 323–351.
, Joseph V. Terza, and Vachira Arromdee, “State characteristics and the location of
foreign direct investment,”Review of Economics and Statistics, 1991, 73(4), 35–68.
Cramer, Duncan,Advanced Quantitative Data Analysis, Maidenhead, UK: Open University Press, 2003.
Deichmann, Joel, Socrates Karidis, and Selin Sayek, “Foreign direct investment in
Turkey: Regional determinants,” Applied Economics, 2003,35(16), 1767–1778.
Disdier, Anne-Celia and Thierry Mayer, “How different is Eastern Europe? Structure and
determinants of location choices by French firms in Eastern and Western Europe,” Journal of Comparative Economics, 2004, 32(2), 280–296.
Driffield, Nigel, “Industrial performance, agglomeration and foreign manufacturing
invest-ment in the UK,” Journal of International Business Studies, 2000, 31(1), 21–37.
, “Determinants of inward investment in the UK: A panel analysis,”Applied Economics, 2002,
34 (5), 555–560.
and Max Munday, “Foreign manufacturing, regional agglomeration and technical efficiency
in UK Industries: A stochastic production frontier approach,” Regional Studies, 2001,35(5), 391–399.
Fujita, Masahisa, Paul Krugman, and Anthony J. Venables, The Spatial Economy: Cities, Regions, and International Trade, Cambridge, MA: MIT Press, 1999.
Girma, S., “The process of European integration and the determinants of entry by non-EU
multinationals in UK manufacturing,” Manchester School, 2002, 70, 315.
Greene, William H., Econometric Analysis, 4 ed., Upper Saddle River, NJ: Prentice Hall, 2000.
Guimaraes, Paulo, Octavio Figueiredo, and Douglas P. Woodward, “Agglomeration
and the location of foreign direct investment in Portugal,”Journal of Urban Economics, 2000,
, , and , “A tractable approach to the firm location decision problem,” Review of Economics and Statistics, 2003, 85(1), 201–204.
Hansen, E. R., “Industrial location choice in San Paulo, Brazil: A nested logit model,”
Regional Science and Urban Economics, 1987, 17, 89–108.
Hausman, Jerry and Daniel McFadden, “Specification tests for the multinominal logit
model,” Econometrica, 1984,52 (5), 1219–1240.
He, Canfei, “Location of foreign manufacturers in China: Agglomeration economies and
coun-try of origin effects,” Papers in Regional Science, 2003,82 (3), 351–372.
Head, Keith and John Ries, “Inter-city competition for foreign investment: Static and
dynamic effects of China’s incentive areas,” Journal of Urban Economics, 1996, 40 (1), 38– 60.
, , and Deborah Swenson, “Agglomeration benefits and location choice: Evidence from
Japanese manufacturing investments in the United States,” Journal of International Eco-nomics, 1995,38(3), 223–247.
, , and , “Attracting foreign manufacturing: Investment promotion and agglomeration,”
Regional Science and Urban Economics, 1999, 29(2), 197–219.
, Thierry Mayer, and John Ries, “Market size and agglomeration,” in Jean-Louis
Muc-chielli and Thierry Mayer, eds., Multinational Firms’ Location and the New Economic Geog-raphy, Cheltenham, UK: Edward Elgar, 2004.
Hensher, David A. and Lester W. Johnson,Applied Discrete Choice Modelling, New York: Halsted Press, 1981.
Hilber, Christian A. L. and Ioan Voicu, “Agglomeration economies and the location
of foreign direct investment: empirical evidence from Romania,” in “51st Annual North
American Meeting of the Regional Science Association International” 2005.
Kang, Sung Jin and Hong Shik Lee, “The determinants of location choice of South Korean
Kinoshita, Yuko and Nauro F. Campos, “The location determinants of foreign direct
investment in transition economies,” 2002.
Krugman, Paul, “Increasing returns and economic geography,”Journal of Political Economy, 1991, 99(3), 483–499.
,Increasing Returns and Economic Geography, MIT Press, 1991.
Lin, Chu-Chia S. and Ivan Png, “Monitoring costs and the mode of international
invest-ment,”Journal of Economic Geography, 2003, 3(3), 261–274.
Maddala, G. S., Limited-Dependent and Qualitative Choice Behaviour, Cambridge: Cam-bridge University Press, 1983.
Marschak, Jacob, “Binary choice constraints on random utility indications,” in Kenneth J.
Arrow, ed., Stanford Symposium on Mathematical Methods in the Social Sciences, Stanford, CA: Stanford University Press, 1960.
McFadden, Daniel L., “Conditional logit analysis of qualitative choice behavior,” in
A. Zarembka, L. Lundqvist, F. Snickars, and J. Weibull, eds., Frontiers in Econometrics, New York: Academic Press, 1974.
Meyer, Klaus, Direct Investment in Economies in Transition, Cheltenham, UK: Edward El-gar, 1998.
Mucchielli, Jean Louis and F. Puech, “Globalization, agglomeration and FDI location:
the case of French firms in Europe,” in Jean Louis Mucchielli and Thierry Mayer, eds.,
Multinational Firms’ Location and the New Economic Geography, Cheltenham, UK: Edward Elgar, 2004.
North, Douglas, “The process of locational change in different manufacturing organizations,”
in F. E. I. Hamilton, ed.,Spatial Perspectives on Industrial Organisation and Decision Making, London: John Wiley and Sons, 1974.
Qu, Tao and Milford B. Green, Chinese Foreign Direct Investment: A Subnational Per-spective on Location, Aldershot: Ashgate, 1997.
Rees, J., “Decision-making, the growth of the firm and the business environment,” in F. E. I.
Hamilton, ed.,Spatial Perspectives on Industrial Organisation and Decision Making, London: John Wiley and Sons, 1974.
Resmini, Laura, “The determinants of foreign direct investment in the CEECs: New evidence
from sectoral patterns,” Economics of Transition, 2000, 8(3), 665–689.
Robert-Nicoud, Frederic, “New economic geography: welfare, multiple equilibria and
polit-ical economy.” PhD dissertation, London School of Economics 2002.
Saxenian, Anna L.,Regional advantage: culture and competition in Silicon Valley and Route 128, Cambridge, MA: Harvard University Press, 1994.
Shaver, Myles J. and Frederick Flyer, “Agglomeration economies, firm heterogeneity and
foreign direct investment in the United States,”Strategic Management Journal, 2000,21(12), 1175–1194.
Smith, Donald F. and Richard Florida, “Agglomeration and industrial location: An
econo-metric analysis of Japanese-affiliated manufacturing establishments in automotive-related
in-dustries,” Journal of Urban Economics, 1994, 36(1), 23–41.
Sun, Qian, Wilson Tong, and Qiao Yu, “Determinants of foreign direct investment across
China,” Journal of International Money and Finance, 2002, 21(1), 79–113.
Train, Kenneth E., Discrete Choice Methods with Simulation, Cambridge: Cambridge Uni-versity Press, 2003.
Tung, Chun-Yun, “Made by Taiwan but made in China: the impact of Taiwanese
busi-nesspeople’s outward investment in the information technology industry in China on their
competitiveness and the Chinese economy,” in Kevin Honglin Zhang, ed., China as a World Workshop, New York: Routledge, 2004.
Wakasugi, Ryuhei, “The effects of Chinese regional conditions on the location choice of
Wei, Yingqi and Xiaming Liu, Foreign Direct Investment in China: Determinants and Impact, Cheltenham: Edward Elgar, 2001.
, , David Parker, and Kirit Vaidya, “The regional distribution of foreign direct
invest-ment in China,” Regional Studies, 1999, 33(9), 857–867.
Wheeler, David and Ashoka Mody, “International investment location decisions: The case
of U.S. firms,” Journal of International Economics, 1992, 33(1), 57–76.
Woodward, Douglas P., “Locational determinants of Japanese manufacturing start-ups in
the United States,” Southern Economic Journal, 1992, 58(3), 690–709.
, Octavio Figueiredo, and Paulo Guimaraes, “Beyond the Silicon Valley: Unversity
R&D and high-technology location,” Journal of Urban Economics, 2006, 60, 15–32.
Zhang, Kevin Honglin, “What attracts foreign multinational corporations to China?,” Con-temporary Economic Policy, 2001, 19(3), 336–346.
Zhou, Changhui, Andrew Delios, and Jing Yu Yang, “Locational determinants of
Japanese foreign direct investment in China,” Asia Pacific Journal of Management, 2002,
19 (1), 63–86.
Table 1: Location of Taiwanese greenfield investment in China, 1996-2005, by province and industry
Industry Chemicals Electric Food Machinery Metal Transportation Textiles Retails Total
Province
Beijing 5 34 8 6 6 4 8 13 84
Tianjin 12 21 9 1 2 2 2 6 55
Hebei 1 1 0 0 4 0 1 0 7
Shanxi 1 3 0 0 1 0 0 0 5
Inner Mongolia 0 1 0 0 0 0 0 0 1
Liaoning 2 7 4 0 0 1 1 2 17
Jilin 1 1 0 1 0 2 0 0 5
Heilongjiang 0 1 0 0 0 3 0 0 4
Shanghai 50 212 17 26 37 18 26 62 448
Jiangsu 7 14 0 2 5 2 1 2 33
Zhejiang 96 351 11 15 68 26 38 21 626
Anhui 2 3 0 0 0 1 0 0 6
Fujian 11 21 5 1 4 26 7 7 82
Jiangxi 0 4 1 0 0 1 2 0 8
Shandong 7 16 1 1 0 2 3 2 32
Henan 1 1 1 0 0 0 1 1 5
Hubei 3 12 1 0 0 3 1 2 22
Hunan 3 2 0 0 1 1 1 4 12
Guangdong 81 348 7 20 48 19 47 32 622
Guangxi 0 4 1 0 0 0 0 1 6
Hainan 0 1 0 0 2 1 0 0 4
Sichuan 3 9 0 3 2 6 1 12 36
Guizhou 0 1 0 0 0 0 0 0 1
Shaanxi 2 3 0 0 2 0 0 3 10
Total 289 1,071 66 76 182 118 140 170 2,131
Table 2: Summary statistics, by variable
Effect Variable Symbol Sign Mean S.D. Min. Max.
Market Gross provincial product (RMB billion) Gpp + 4.404 2.920 0.588 6.159
access Gross provincial product per capita (RMB) Pgpp + 3.665 3.044 0.271 4.440
Population density (person/km2) Popd + 1.455 0.259 0.402 2.554
Trade Railway density (km/km2) Rwayd + -1.867 -2.409 -1.161 0.301
cost Highway density (km/km2) Hwayd + 4.644 3.589 0.337 5.224
Total railways and highways density (km/km2) Wayd + -0.457 -1.367 0.121 0.263
Industrial Manufacturing output (RMB billion) Moutput + 4.404 2.920 0.588 6.159
linkages Number of manufacturing workers (10,000 people) Mworker + 6.078 4.829 0.357 6.893
Number of manufacturing firms (count) NMF + 3.661 4.605 0.435 2.790
Cumulative FDI (RMB 10,000) CFDI + 9.762 8.802 0.498 10.909
Number of foreign enterprises (count) NFDI + 3.694 2.775 0.481 4.782
Cumulative Taiwanese investment (RMB10,000) CTDI + 5.512 3.320 0.818 7.510
Number of Taiwanese enterprises (count) NTDI + 3.694 2.775 0.481 4.782
Labour-market Average real wage rate (RMB) Awage - 3.674 3.281 0.174 4.159
pooling Efficiency wage rate (RMB) Ewage - 2.649 2.206 0.207 3.220
Monitoring Telephone density (Telephone set per 1,000 people) Teld + 0.990 -0.042 0.406 1.772
cost Postal and telecommunication output (RMB billion) Toutput + 3.255 1.848 0.600 4.963
Number of telecommunication and postal workers (10,000 people) Tworker + 5.348 4.542 0.236 5.750
Note: These descriptive statistics are based on the logged value and since log 0 is undefined, 10-4 is used to replace the zero whenever it occurs in the dataset. The panel data comprises observations of 29 provinces across the period 1996-2005.
Table 3: Pearson pair-wise correlation coefficient matrix, by variable
1 2 3 4 5 6 7 8 9 10 11 12 13 14 15 16 17 18
1. Prgp 1.00
2. Popd 0.59 1.00
3. Grp 0.83 0.90 1.00
4. Hwayd -0.45 -0.52 -0.54 1.00
5. Lwayd 0.62 0.86 0.85 -0.38 1.00
6. Rway 0.59 0.65 0.69 -0.60 0.59 1.00
7. Mworker 0.18 0.31 0.31 0.21 0.08 0.17 1.00
8. Indout 0.83 0.93 1.00 -0.54 0.85 0.69 0.31 1.00
9. Teld 0.86 0.39 0.65 -0.26 0.56 0.50 0.01 0.65 1.00
10. Telout 0.85 0.89 0.98 -0.55 0.85 0.69 0.26 0.98 0.69 1.00
11. Tworker 0.12 0.16 0.18 0.28 -0.08 0.11 0.84 0.18 -0.07 0.12 1.00
12. CNFDI 0.67 0.63 0.72 -0.24 0.58 0.25 0.47 0.72 0.43 0.72 0.35 1.00
13. CNTDI 0.39 0.05 0.21 0.21 0.26 0.15 -0.19 0.21 0.68 0.24 -0.22 -0.06 1.00
14. CFDI 0.76 0.66 0.78 -0.22 0.64 0.31 0.44 0.78 0.56 0.79 0.34 0.97 0.09 1.00
15. CTDI 0.77 0.60 0.75 -0.15 0.65 0.26 0.26 0.75 0.73 0.76 0.12 0.78 0.47 0.84 1.00
16. Ewage -0.01 0.08 0.04 -0.42 0.11 0.22 0.11 0.04 -0.06 0.06 -0.16 0.03 -0.31 -0.02 -0.07 1.00 17. Awage 0.77 0.41 0.62 -0.19 0.59 0.37 -0.10 0.62 0.86 0.63 -0.17 0.35 0.74 0.49 0.73 -0.05 1.00
18. LNMF 0.43 0.47 0.52 0.04 0.36 0.28 0.49 0.52 0.39 0.50 0.37 0.47 0.25 0.51 0.53 -0.21 0.34 1.00
Table 4: Principal components analysis
Variable Market Trade Industrial Labour-market Monitoring access costs linkage pooling costs
Gpp 0.841 0.335 0.380 0.148 0.048
Pgpp 0.461 0.194 0.805 -0.019 0.046
Popd 0.885 0.331 0.118 0.205 0.030
Rwayd 0.848 0.125 0.135 0.105 -0.079
Hwayd -0.560 0.477 -0.101 0.480 0.291
Wayd 0.817 0.189 0.241 0.365 0.013
Moutput 0.841 0.335 0.380 0.148 0.048
Mworker 0.284 0.908 0.391 0.151 -0.105
NMF 0.344 0.677 0.272 0.117 0.217
CFDI 0.583 0.550 -0.077 0.258 0.062
NFDI 0.594 0.578 0.277 0.239 0.014
CTDI 0.529 0.353 0.200 0.699 0.114
NTDI 0.444 0.258 0.071 0.808 0.152
Awage 0.159 -0.086 0.927 -0.140 0.047
Ewage 0.012 -0.078 -0.064 -0.102 -0.979
Teld 0.230 -0.001 0.924 0.057 0.099
Toutput 0.835 0.307 0.407 0.158 0.010
Tworker 0.210 0.889 -0.102 0.182 0.030
Eigenvalue 6.297 3.659 3.285 1.854 1.168 Cumulative variance 34.986 55.314 73.566 83.865 90.355
Note: Varimax with Kaiser Normalisation. Rotation converged in seven iterations.
Table 5: Pearson pair-wise correlation coefficients, by selected variable
Popd Hwayd Mworker Ewage Teld Popd 1.00
Hwayd -0.52 1.00
Mworker 0.31 0.21 1.00
Ewage 0.08 -0.42 0.11 1.00
[image:36.595.162.430.601.685.2]