6
I
January 2018
Optimization of Process parameters for Single
Cylinder Piston Type Compressed Air Engine
Using Taguchi’s Approach
Lalit Patel1, Ratnesh Shukla2
1
Research Scholar, Department of Mechanical Engineering, Rai University, Ahmedabad, Gujarat, India
2
Principal, Government Engineering College , Bharuch ,Gujarat, India
Abstract: This study presents a physical model of compressed air engines (CAEs) is established from existing 4 stroke petrol engine. A conventional 100CC four stroke internal combustion engine was modified to a two stroke compressed air engine To obtain performance on the CAEs, a setup is prepared with dynamometer. The output torque and brake power are obtained through experimental study. the investigation on piston type compressed air engine for different loading condition on a test bench and brake power has been examined with different loading condition by use of design of experiments. For design of experiments L9 taguchi method is used for experimentation and parametric analysis. The results show that CAE has a good economic performance at pressure 5 kg/cm2 provide maximum 0.9283 kW power output with varying load 1.5 kg to 2.5 kg for modified air engine from existing 4 stroke engine and 2 stroke engine. This research can be referred to in the optimization of air-powered engine.
Keywords: Design Of Experiment, Compressed Air Engine, Piston Type, Different Loading Condition
I. INTRODUCTION
Fossil fuel burning is considered to be the main cause of serious environmental issues, including greenhouse effect, ozone layer depletion and acid rain [1].Renewable fuels, such as wind, solar, compressed air, etc., are used as obvious solutions [2]. With respect to environmental protection, Shafiee and Topal believe that oil and gas reserves may be diminished in 2042; this enhances the competition in the field of renewable energy vehicles [3]. Because of its low cost, safe maintenance, easy access, recyclability, higher energy storage density and long lifespan, compressed air energy storage will be an advanced and rapidly developing field in the future. The flow characteristics of compressed air in equipment have been studied [4] to [6]. Most applications of compressed air engines focus on auxiliary systems or systems that assist IC engines [7,8,9]. Only a few studies or industrial projects have focused on the application of a compressed air engine as the main power system [10].India is one of the fastest developing countries with stable economic growth, which increases the demand for transport in many cases. Fuel consumption is relatively proportional to this demand. Due to shortage of fossil fuel reserves, India relies heavily on imported fuel and has a great effect on the economy. India has to find alternative to maintain growth rate. Compressed Air Engine is a better option to produce power to run automobile, generators etc. it does not required any of the known fossil fuels like petrol, diesel, CNG, LPG, hydrogen etc. this works using only compressed air. It works on high pressure air and hence is pollution free and 100% eco-friendly[11]. This study focuses on the experimental investigation of compressed air engines in vehicles as the main power system. These results can be used to evaluate the functional applications and efficiency of a compressed aerial engine and improve the scope of possible solutions. Choosing Piston Type Engine for Compressed Air Operations has the advantage of simple convenience in traditional internal combustion (IC) engines, considering the use of vehicles with zero pollution.
II. EXPERIMENTAL METHOD
originally had two cams with one lobe each which were mutually perpendicular to each other. The crank rotates due to the movement of the piston; the camshaft is attached with the crankshaft by a timing chain or a timing belt. And as the crank rotates the camshaft also rotates and hence the timing of the valves is managed. In the traditional camshaft the inlet and exhaust valve both functions [12]. Table (1) lists the specification of the 4-stroke IC engine, which was modified in the current study as a single cylinder piston type compressed air engine. Before the experiments, the 97.2 cc Internal Combustion engine was modified and connected to a compressed air tank. The cam profile was modified to be conjugate to change the engine from 4-stroke to 2-stroke operation. After the engine was installed, the intake and exhaust valves were examined for possible leakage under high-air-pressure operation.
Table 1: Engine Specifications for 4-stroke engine
Parameter Honda Sleek
Engine displacement 97.2 cc
Engine type air cooled ,4 stroke Number of cylinder 1
Valves per cylinder 2
Max power 7.0 ps @8000 rpm
Max torque 7.5 nm
Bore*Stroke 50 mm*49.5 mm
Fuel type petrol
Starter kick
[image:3.612.57.553.207.710.2]Number of speed gear 4
Fig.1 Pictorial view of the Conventional cam Fig.2 Pictorial view of the Modified cam
Fig.5 Sectional front view of Modified cam Fig.6 Actual view of the Modified cam
Fig.7 Experimental set up for single cylinder piston type air engine
The seepage of the intake valve was consequently close to the flow rate in the experiments, and it seriously affected the performance of the compressed air engine. The exhaust valve leakage was examined when the engine was locked in the intake process, and no leakage was observed. The experimental set up for 4 stroke single cylinder air engine is shown in Fig.7[12].
III. EXPERIMENTAL DESIGN
The purpose of the formation of the experiment is to determine the critical parameters and their target values[13]. On the basis of selected parameters, experimental design is carried out. The Taguchi experimental design is done for L9 OA for two parameters
which are air pressure and different load condition.
A. Process parameters
Process parameters are one of the most important factors for any experimental work. In the current case, the process parameters are selected based on the reviews of various literature. The different levels for process parameters are shown in table 2below.
Table 2 Levels for process parameters
Factor Symbol Unit -1 0 +1
AIR PRESSURE p kg/cm2 4 5 6
LOAD L KG 1.5 2 2.5
B. Output Process Parameters
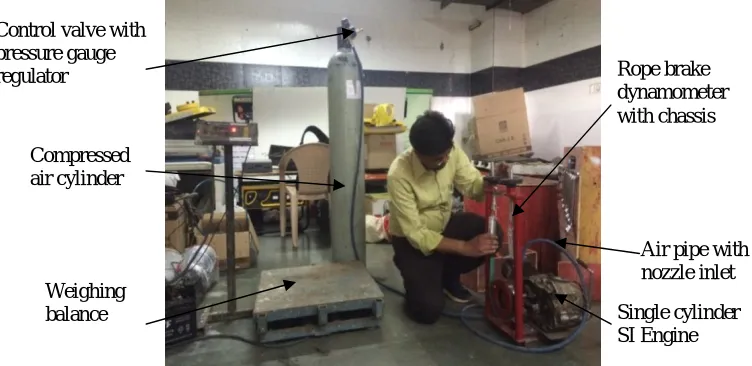
In present study parameter taken as a response is brake power. Compressed
air cylinder
Rope brake dynamometer with chassis
Air pipe with nozzle inlet
Single cylinder SI Engine Weighing
IV. RESULT AND DISCUSSION
For load testing of air engine, it is connected with the rope brake dynamometer with brake drum, spring balance, belt and holding frame. During testing, brake power were measured to determine effective parameters of air pressure with loading condition by using taguchi design of experiments L9
A. Taguchi Analysis of brake power of air engine versus pressure, load
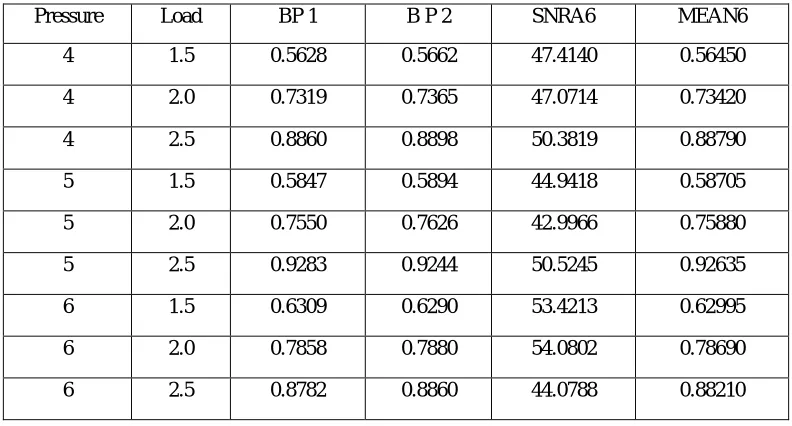
Table 3 shows the Experimental Readings For Taguchi L9 Orthogonal Array for brake power. The response tables 4 and 5 show the
average of the selected characteristic for each level of the factors. The response tables include ranks based on Delta statistics, which compare the relative magnitude of effects. The Delta statistic is the highest average for each factor minus the lowest average for each factor.
Table 4 Response Table for Signal to Noise Ratios Level pressure load
1 48.29 48.59 2 46.15 48.05 3 50.53 48.33 Delta 0.54 4.37 Rank 2 1
Table 5 Response Table for Means Level pressure load
1 0.7289 0.5938 2 0.7574 0.7600 3 0.7663 0.8988 Delta 0.0374 0.3049 Rank 2 1
[image:5.612.108.504.496.709.2]Ranks are assigned based on Delta values; Rank 1 is assigned to the highest Delta value, Rank 2 to the second highest Delta value, and so on. The main effects plot provides a graph of the averages in the response table. Based on the taguchi design analysis, from the table 4 and 5, it can be seen that for, the factor with the biggest impact on the S/N ratio is load (delta =4.37,Rank =1 ) so load is given more impact for brake power. and also it can be seen that at the response table and main effect plots for S/N ratio from figure 5,9 , for 2 kg and 2.5 kg of load have almost the same average S/N ratio (48.05 and 48.33).
Table 3Experimental Readings For Taguchi L9 Orthogonal Array (brake power)
Pressure Load BP 1 B P 2 SNRA6 MEAN6
4 1.5 0.5628 0.5662 47.4140 0.56450
4 2.0 0.7319 0.7365 47.0714 0.73420
4 2.5 0.8860 0.8898 50.3819 0.88790
5 1.5 0.5847 0.5894 44.9418 0.58705
5 2.0 0.7550 0.7626 42.9966 0.75880
5 2.5 0.9283 0.9244 50.5245 0.92635
6 1.5 0.6309 0.6290 53.4213 0.62995
6 2.0 0.7858 0.7880 54.0802 0.78690
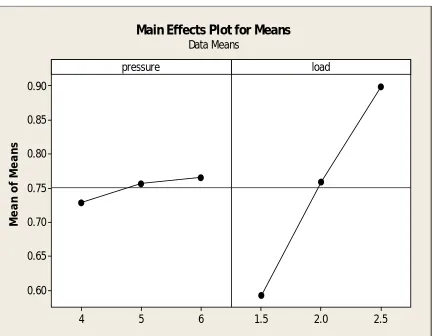
Fig. 8 Main effects Plot for SN ratio (Brake Power) 6 5 4 0.90 0.85 0.80 0.75 0.70 0.65 0.60 2.5 2.0 1.5 pressure M e a n o f M e a n s load
Main Effects Plot for Means
Data Means
Fig.9Main Effect plot for Means (Brake Power)
6 5 4 51 50 49 48 47 46 2.5 2.0 1.5 pressure M e a n o f S N r a ti o s load Main Effects Plot for SN ratios
Data Means
[image:6.612.92.524.374.710.2]From the response diagrams in fig 8 and 9,it can be seen that with increase the pressure of the compressed air then brake power of the engine would increase. also from the response diagram and experimental taguchi design array combination, it can be seen that at 5 bar pressure and 2.5kg load , achieved maximum mean of brake power.
2.5 2.0 1.5 54 51 48 45 42 6 5 4 54 51 48 45 42 pressure load 4 5 6 pressure 1.5 2.0 2.5 load
Interaction Plot for SN ratios
Data Means
Signal-to-noise: Nominal is best (10*Log10(Ybar**2/s**2))
Fig.10.Interaction Plot for SN ratio (Brake Power)
2.5 2.0 1.5 0.9 0.8 0.7 0.6 6 5 4 0.9 0.8 0.7 0.6 pressure load 4 5 6 pressure 1.5 2.0 2.5 load
Interaction Plot for Means
Data Means
As shown in Fig.10 and fig.11, these interaction plot lines are not parallel .This interaction effect between load and brake power depends on the value of the pressure. for example, as per the plot at 2.5 kg load and 5bar pressure this combination is associated with the higher brake power.
B. Contour Plot Analysis
Load P re s s u re 2.50 2.25 2.00 1.75 1.50 2.50 2.25 2.00 1.75 1.50 6.0 5.5 5.0 4.5 4.0 6.0 5.5 5.0 4.5 4.0 > – – – – – – < 0.60 0.60 0.65 0.65 0.70 0.70 0.75 0.75 0.80 0.80 0.85 0.85 0.90 0.90 MEAN6
Contour Plot of MEAN of BP vs Pressure, Load
Fig.12 Contour plot of Mean of brake power vs Pressure & load
Fig.12 shows how pressure (y) and load (x) affect the contours of a brake power. The darker green regions indicate higher brake power. From the figure12 it can be seen that the combination of 5 bar pressure and 2.5 kg load gives maximum brake power i.e darker green area in convex shape. This graph gives the means of brake power range so prediction of compressed air pressure on different loading condition for air engine will be very easy to predict.
V. CONCLUSIONS
Present work based on DOE L9 three different values of pressure viz; 4bar ,5bar and 6 bar and three different values of load i.e 1.5
kg ,2kg and 2.5kg are experimentally investigated on air engine test rig i.e modified from the existing 4 stroke internal combustion engine. Based on experimental observation, graphs are plotted and results are critically discussed for the different responses. Here, Load is given more impact on brake power as compare to pressure.. At 2.5 kg load and 5bar pressure this combination is associated with the higher brake power. In this study, the taguchi method gives effective methodology in order to find out the effective performance output for any machines. The results are very useful for adopting conventional internal combustion engine to convert to the air engine, and there is also the forecast of the process parameters to use the compressed air engine with zero pollution.
REFERENCES
[1] Veziroglu, T. N., Sahin, S.,21st century’s energy: hydrogen energy system. Energy Conversion & Management,2008, vol.49, no. 7, pp. 1820-183
[2] Li, Y., Chen, H., Zhang, X., Tan, C., Ding, Y. ,Renewable energy carriers: Hydrogen or liquid air/nitrogen, Applied Thermal Engineering,2010, vol.30, no.14-15, pp.1985-1990,
[3] Shafiee, S., Topal, E. ,When will fossil fuel reserves be diminished? Energy Policy, 2009,vol. 37, no.1, pp.181-189,
[4] Bergant, A., Kruisbrink, A., Arregui, F.,Dynamic behavior of air valves in a large-scale pipeline apparatus. Strojniški vestnik - Journal of Mechanical Engineering, 2012,vol. 58, no. 4. pp. 225-237,
[5] Vukčević, V., Werner, A., Degiuli, N. Application of smoothed particle hydrodynamics method for simulating incompressible laminar flow. Transactions of Famena,2012, vol. 36, no. 4, pp. 1-13.
[6] Dudić, S.P., Ignjatović, I.M., Šešlija, D.D., Blogojević, V.A., Stojiljković, M.M. ,Leakage quantification of compressed air on pipes using thermovision. Thermal Science,2012, vol. 16, Suppl. 2, pp. 555-565,
Combustion and Direct Energy Recovery in Heavy Duty Application. In Proceedings of SAE World Congress and Exhibition, Detroit, MI, USA, 14 April 2008; SAE International: Warrendale, PA, USA.
[9] Schechter, M. New Cycles for Automobile Engines. In Proceedings of International Congress and Exposition, Detroit, MI, USA, 1 March 1999; SAE International: Warrendale, PA, USA.
[10] Motor Development International (MDI) Web Page. AIRPod. Available online: http://www.mdi.lu/ english/airpod.php (accessed on 27 August 2012). [11] Abhishek Lal (2009),Design and Dynamic Analysis of Single Stroke Compressed Air Engine,International Journal Of Renewable Energy Research, Vol.3,
No.2, 2013,pp 315-319.
[12] Lalit Patel, Ratnesh Shukla, An Experimental Investigation on Single Cylinder Piston Type Compressed Air Engine using Taguchi Technique,International Journal for Research in Applied Science & Engineering Technology,2017, Volume 5, Issue XII,pp1113-1123.