Munich Personal RePEc Archive
Is China taking actions to limit its
greenhouse gas emissions? past evidence
and future prospects
Zhang, ZhongXiang
University of Groningen, The Netherlands
September 1998
Online at
https://mpra.ub.uni-muenchen.de/13054/
September 1998
Is China Taking Actions to Limit its Greenhouse Gas Emissions?
Past Evidence and Future Prospects
ZhongXiang Zhang
Faculty of Economics and Faculty of Law University of Groningen
P.O. Box 716 9700 AS Groningen
The Netherlands Tel: +31 50 3636882 Fax: +31 50 3637101
Email: Z.X.Zhang@Rechten.RUG.NL
Summary: As the world’s second largest carbon emitter, China has long been criticised as a “free-rider” enjoying benefits from other countries’ efforts to abate greenhouse gas emissions but not taking due responsibilities of its own. China has been singled out as one of the major targets at the subsequent negotiations after the Kyoto curtain had fallen. By analyzing the historical contributions of inter-fuel switching, energy conservation, economic growth and population expansion to China’s CO2 emissions during the period 1980-1997, this article first demonstrates that the above criticism cannot hold its ground. Then the article envisions some efforts and commitments that could be expected from China until its per capita income catches up with the level of middle-developed countries. By emphasizing the win-win strategies, these efforts and commitments could be unlikely to severely jeopardize China’s economic development and, at the same time, would give the country more leverage at the post-Kyoto climate change negotiations.
1. Introduction
In December 1997, 160 countries reached an historical agreement on limiting greenhouse gas emissions in Kyoto. While the United Nations Framework Convention on Climate Change (UNFCCC) at the Earth Summit in June 1992 committed Annex I countries to “aim” to stabilize emissions of carbon dioxide (CO2) and other greenhouse gases at their 1990 levels by 2000, the so-called Kyoto Protocol goes further. It sets legally binding emissions targets and timetables for these countries. Together, Annex I countries must reduce their emissions of six greenhouse gases by at least 5% below 1990 levels over the commitment period 2008-2012, with the European Union (EU), the United States (US) and Japan required to reduce their emissions of such gases by 8%, 7% and 6% respectively (UNFCCC, 1997). The Protocol will become effective once it is ratified by at least 55 parties whose CO2 emissions represent at least 55% of the total from Annex I Parties in the year 1990.
The binding emissions targets set at Kyoto for Annex I countries, although far short of what developing countries called for, may give them some “moral” right to persuade developing countries to take meaningful mitigation action. There is no doubt that securing meaningful participation from key developing countries will remain a priority for the US.1 From the industrialized countries’ perspective, the lack of developing countries’
involvement in combating climate change aggravates their short-term concerns about international competitiveness. Non-participation of developing countries also increases emissions leakage that could arise in the short term, as emissions controls lower world fossil fuel prices, and in the long term, as industries relocate to developing countries to avoid emissions controls at home. In addition, it raises the spectre of developing countries becoming “locked in” to more fossil fuel intensive economy and eliminates the Annex I countries’ opportunity to obtain low-cost abatement options. When there is no emissions trading at all, the cost of complying with the Kyoto target for the US would run to $125 per ton of carbon, according to Dr. Janet Yellen (1998), Chair of the White House’s Council of Economic Advisers, testifying on 4 March 1998 before the House Commerce Subcommittee on Energy and Power about the domestic economic implications of the Kyoto Protocol. With emissions trading only among Annex I countries, the cost would drop to $30-50 per ton. With fully worldwide emissions trading, the cost would further drop to $14-23 per ton. This clearly explains why the US puts heavy emphasis on the involvement of developing countries. Indeed, recent Indonesian bush fires choking Southeast Asia served as a graphic reminder that developing countries have an important part to play in protecting the environment against global warming.
On the other hand, developing countries insist that the US demand contradicts an earlier United Nations agreement, known as the Berlin Mandate, which attempts to set binding targets and timetables only to industrialized countries. They argue that industrialized countries are responsible for the majority of both historical and current greenhouse gas emissions and, thus, must demonstrate once and for all that they are really taking the lead in reducing their emissions. Developing countries insist that they have very little historical responsibility for climate problems, although industrialized countries insist that developing countries represent rapidly growing emissions sources in line with their industrialization and urbanization.
[image:3.612.95.522.576.683.2]China is the world’s most populous country and largest coal producer and consumer. At present, it contributes 13.5% of global CO2 emissions, which makes it the world’s second largest emitter of CO2, after the US, according to the World Energy Council (see Table 1). China’s share in global CO2 emissions is expected to increase and is likely to exceed that of the US by 2020, if the current trend of economic development in China continues (World Bank, 1994). That is why China has been singled out as one of the major targets at the subsequent negotiations after the Kyoto curtain had fallen. Indeed, both before and at Kyoto, China was already the attacked target. Media, particularly those from the West, had painted a much distorted picture of China by simply repeating the statement of its chief negotiator that Beijing would reject “the introduction of any new commitments for developing countries” as well as the “launching of any negotiating process” for such a purpose. In addition, the media explicitly overlooked many positive actions that had been taken by China. Since the Annex I countries had made commitments at Kyoto, Western media now could easily fool the general public by blaming China for not adopting binding commitments and even for “blowing up” subsequent negotiations aimed at dealing with developing countries’ commitments. This underlines the importance of China’s strategies at the subsequent climate negotiations.
Table 1
Shares of Global CO2 Emissions and World Population, 1996
Share of global CO2 emissions (%) Share of the world population (%) USA
EU-15 China
CIS Republics Japan
India Canada Australia
25.0 14.7 13.5 10.2 5.6 3.6 2.1 1.3
4.7 6.5 21.5
5.0 2.2 16.3
0.5 0.3
In this article, we first examine the historical evolution of China’s CO2 emissions during the period 1980-1997. By analyzing the historical contributions of inter-fuel switching, energy conservation, economic growth and population expansion to CO2 emissions, we indicate that China has made significant contribution to reducing global CO2 emissions, although none of these carbon savings have resulted from domestic climate mitigation policies. Next, we analyze what the economic effects would be if China’s carbon emissions in 2010 were cut by 20% and 30%, respectively, relative to the baseline. Then, we envision some plausible strategies that China might take at the post-Kyoto climate change negotiations. Finally, some concluding remarks are drawn.
2. Decoupling China’s Carbon Emissions Increases from Economic Growth from 1980 - 1997
With more than 1.2 billion people, China is home to about 21.5% of the world’s population (see Table 1) and has a large and rapidly growing economy, making the country an important player on the world’s stage. Since launching its open-door policy and economic reform in late 1978, China has experienced spectacular economic growth, with its gross domestic product (GDP) growing at the average annual rate of about 10% over the period 1978-1997. Along with the rapid economic development, energy consumption rose from 571.4 million tons of coal equivalent (Mtce) in 1978 to 1440.0 Mtce in 1997. Currently, China consumes almost 1400 million tons of coal a year, leading the world in both production and consumption of coal. As indicated in Figure 1, coal has accounted for about 75% of the total energy consumption over the past years. This share has remained stable after having increased from 70% in 1976, indicating that coal has fuelled much of China’s economic growth over the past two decades. Although China had surpassed Russia to become the world’s second largest energy producer and user in 1993, China’s current per capita energy consumption of 1.165 tons of coal equivalent (tce) (see Table 3) is about half the world’s average, or only about one-twelfth of that of the US.
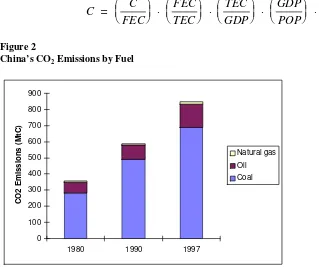
Accompanying the growth in fossil fuel use, China’s CO2 emissions have grown rapidly. The corresponding CO2 emissions from fossil fuels in China over the period 1980-1997 have been calculated based on fossil fuel consumption and by using the CO2 emission coefficients given in Table 2 that are measured in tons of carbon per ton of coal equivalent (tC/tce) and are generally considered suitable for China. As shown in Table 3, the total CO2 emissions in China rose from 358.60 million tons of carbon (MtC) in 1980 to 847.25 MtC in 1997, with an average annual growth rate of 5.2%. This ranks China as the world’s second largest CO2 emitter only behind the US. But on a per capita basis, China’s CO2 emissions of 0.685 tC in 1997 (see Table 3) were very low, only about half the world average.
Figure 1
0% 10% 20% 30% 40% 50% 60% 70% 80% 90% 100%
1976 1978 1980 1982 1984 1986 1988 1990 1992 1994 1996 1997
Hydropower Natural gas Oil Coal
[image:5.612.91.455.65.348.2]Sources: Drawn based on data from the State Statistical Bureau (1992, 1998).
Table 2
CO2 Emission Coefficients for China
Fuels tC/tce
Coal Oil Natural gas
Hydropower, Nuclear power and Renewables
0.651 0.543 0.404
0
Source: Energy Research Institute (1991).
The breakdown of CO2 emissions by fuel is shown in Figure 2. Because of the coal-dominant structure of Chinese energy consumption, it is not surprising that coal predominates, accounting for 81.3% of the total emissions in 1997. This share has remained almost unchanged over the past two decades.
Let us now turn to the contributions of inter-fuel switching, energy conservation, economic growth and population expansion to CO2 emissions over the past 17 years.
CO2 emissions can be subdivided as follows:2
2
C =
C
FEC
FEC
TEC
TEC
GDP
GDP
POP
POP
⎛
[image:6.612.90.409.77.344.2]⎝⎜
⎞
⎠⎟
⋅ ⎛
⎝⎜
⎞
⎠⎟
⋅ ⎛
⎝⎜
⎞
⎠⎟
⋅ ⎛
⎝⎜
⎞
⎠⎟
⋅
Figure 2
China’s CO2 Emissions by Fuel
0 100 200 300 400 500 600 700 800 900
1980 1990 1997
CO2 Em
issions (MtC)
Natural gas Oil Coal
where C is the amount of CO2 emissions, FEC is the total carbon-based fossil fuel consumption, TEC is the total commercial energy consumption, GDP is the Gross Domestic Product, and POP is the population.
Taking logs and differences over time yields:
Δ
Δ
Δ
Δ
Δ
Δ
log
log
/
log
/
log
log
log
C =
(C FEC) +
(FEC TEC) +
(TEC / GDP)
+
(GDP / POP) +
(POP)
Table 3
Determining Factors for CO2 Emissions in China
Year POP (million)
C (MtC)
GDPa TEC (Mtce)
FEC (Mtce)
GDP/POP (US$)b
TEC/GDPc FEC/TEC C/FEC (tC/tce)
TEC/POP (tce)
C/POP (tC)
C/GDPd
1980 987.05 358.60 3011.87 602.75 578.70 305 2.001 0.960 0.620 0.611 0.363 1.191 1981 1000.72 352.63 3170.25 594.47 567.66 317 1.875 0.955 0.621 0.594 0.352 1.112 1982 1016.54 367.82 3455.86 620.67 590.51 340 1.796 0.951 0.623 0.611 0.362 1.064 1983 1030.08 390.39 3832.34 660.40 625.66 372 1.723 0.947 0.624 0.641 0.379 1.019 1984 1043.57 421.41 4413.94 709.04 674.23 423 1.606 0.951 0.625 0.679 0.404 0.955 1985 1058.51 456.58 5008.53 766.82 729.63 473 1.531 0.952 0.626 0.724 0.431 0.912 1986 1075.07 482.01 5452.52 808.50 770.42 507 1.483 0.953 0.626 0.752 0.448 0.884 1987 1093.00 517.32 6083.45 866.32 826.12 557 1.424 0.954 0.626 0.793 0.473 0.850 1988 1110.26 554.98 6768.91 929.97 886.08 610 1.374 0.953 0.626 0.838 0.500 0.820 1989 1127.04 577.37 7044.13 969.34 921.94 625 1.376 0.951 0.626 0.860 0.512 0.820 1990 1143.33 586.87 7314.16 987.03 936.40 640 1.349 0.949 0.627 0.863 0.513 0.802 1991 1158.23 618.90 7986.64 1037.83 988.01 690 1.299 0.952 0.626 0.896 0.534 0.775 1992 1171.71 650.12 9123.88 1091.70 1038.21 779 1.197 0.951 0.626 0.932 0.555 0.713 1993 1185.17 687.61 10354.59 1159.93 1099.61 874 1.120 0.948 0.625 0.979 0.580 0.664 1994 1198.50 724.65 11665.79 1227.37 1157.41 973 1.052 0.943 0.626 1.024 0.605 0.621 1995 1211.21 771.24 12891.31 1311.76 1231.74 1064 1.018 0.939 0.626 1.083 0.637 0.598 1996 1223.89 820.71 14127.21 1389.48 1313.06 1154 0.984 0.945 0.625 1.135 0.671 0.581 1997 1236.26 847.25 15370.91 1440.00 1357.92 1243 0.937 0.943 0.624 1.165 0.685 0.551
a
Measured in 100 million US$ at 1980 prices and at the average exchange rate 1 US$ = 1.5 Chinese yuan. b
At 1980 prices.
c Measured in tce per thousand US$ at 1980 prices. d
Measured in tC per thousand US$ at 1980 prices.
Figure 3
Contribution to CO2 Emissions in China, 1980-1997
0 50 100 150 200 250 300 350 400 450
1980 1981 1982 1983 1984 1985 1986 1987 1988 1989 1990 1991 1992 1993 1994 1995 1996 1997
Index (1980=100)
POP C GDP/POP TEC/GDP FEC/TEC C/FEC
The third term shows the effect of changes in the aggregate energy intensity on emissions, and the last two terms show the effect on emissions due to growth in income per capita and population respectively. Needless to say, this identity is in a form suitable for analyzing the historical contributions of inter-fuel switching, energy conservation, economic growth, and population expansion to CO2 emissions by examining the relevant time-series data.
Table 4 shows the results of this analysis for the period 1980-1997, based on data given in Table 3. It quantifies the historical contribution to CO2 emissions each factor has made. Population data, GDP values and commercial energy consumption of various types have been taken from the State Statistical Bureau (1992, 1998). The corresponding CO2 emissions associated with the fossil fuel consumption have been calculated above. Part of the data in Table 3 are presented in Figure 3, after normalization to the year 1980.
overwhelming. This factor alone resulted in an increase of 799.13 MtC. During the corresponding period, through its strict family planning programmes, China experienced a very low rate of population growth in comparison with other countries at China’s income level, which in turn contributed to a smaller increase in China’s CO2 emissions than would otherwise have been the case.3 As a result, population expansion was responsible for an increase of 128.39 MtC, an increase in emissions considered to be modest given its population size. Also, the change in fossil fuel mix contributed to an increase in emissions (3.93 MtC), but its role was very limited because the share of coal use in total commercial energy consumption increased only slightly during the period.
Table 4
Breakdown of the Contributions to CO2 Emissions Growth, 1980-1997 (MtC)a
Due to change in fossil fuel carbon intensity
Due to penetration of carbon free fuel
Due to change in energy intensity
Due to economic growth
Due to population expansion
Total change in CO2 emissions
+3.93 -10.48 -432.32 +799.13 +128.39 +488.65
a
A positive sign indicates an increase; A negative sign indicates a decline.
Source: Own calculations.
By contrast, a reduction in energy intensity tended to push CO2 emissions down. Since the early 1980s, the Chinese government has been placing great emphasis on energy conservation and has formulated and implemented approximately 30 energy conservation laws concerning the administrative, legislative, economic and technological aspects of energy conservation. After years of preparation, China’s Energy Conservation Law was enacted on 1 November 1997 and came into force on 1 January 1998. In order to efficiently use energy, China has significantly reduced subsidies for energy consumption, with coal subsidy rates falling from 61% in 1984 to 37% in 1990 and to 29% in 1995, and petroleum subsidy rates falling from 55% in 1990 to 2% in 1995 (Kosmo, 1987; World Bank, 1997a). Currently, coal prices are largely decided by the market and vary significantly depending on the destination of the coal.4 Along with the economic reforms that, among other achievements, have spurred investment in more energy efficient production technologies, the Chinese government has also played a crucial role both in promoting a shift of economic structure towards less energy-intensive services (see Table 5) and a shift of product mix towards high value-added products, and in encouraging imports of energy-intensive products.5 Furthermore, efforts have been made towards implementing nationwide energy conservation programmes as exemplified by developing large-size coal-fired power plants. In 1987, only 11 power stations had an unit capacity of 1 gigawatt (GW) and above. The combined capacity of these power stations was about 15 GW, accounting for one-seventh of the nation’s total. By 1994, there were 34 power stations having an unit capacity of 1 GW and above, with a combined capacity of 43 GW, accounting for 21.4% of the nation’s total (SETC, 1996). In the meantime, the share of generating units having a capacity of 100 MW and above increased from 32.5% in 1984 to 57.2% in 1994 (MOEP, 1985; SETC, 1996). Along with these large units commissioned into operation, the average generation efficiency of thermal power increased from 28.5% in 1984 to 29.7% in 1994.
3
During the period 1980-1997, the annual average growth rate of population in China was 1.33%. In contrast, the corresponding figure for low-income economies (excluding China) between 1980 and 1995 was 2.35%, and the world average was 1.66% (World Bank, 1997c).
4 For example, the mine-mouth price of Datong mixed coal was 128 yuan per ton in June 1994. The same coal retained for 230 yuan per ton in Shanghai, 262 yuan per ton in Nanjing, 280 yuan per ton in Guangzhou, and 340 yuan per ton in Xiamen (SETC, 1996).
5
Table 5
The Composition of GDP in China, Japan and the US (percentage of GDP)
China Japan United States
1980 1990 1997 1995 1995 Agriculture
Industry Services
30.1 48.5 21.4
27.1 41.6 31.3
18.7 49.2 32.1
2 38 60
2 26 72
Sources: State Statistical Bureau (1998); World Bank (1997c).
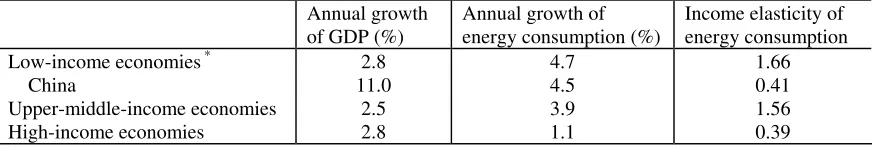
Time constraints and lack of the data do not allow for quantification of the magnitude of the effect of each policy and measure on reduced energy intensity measured by total energy consumption per unit of GDP. Clearly, however, it is by implementing these policies and measures that great progress in decoupling China’s GDP growth from energy consumption has been made, with an annual growth of 10.06% for the former but only 5.26% for the latter during the period 1980-1997. This achievement corresponds to an income elasticity of energy consumption of 0.52 and to an annual saving rate of 4.37%.6 Given the fact that most developing countries at China’s income level have the income elasticity of energy consumption well above one (see Table 6), this makes China’s achievement unique in the developing world.7 As a result, a reduction of 432.32 MtC was achieved. In other words, without the above policies and measures towards energy conservation, China’s CO2 emissions in 1997 would have been 432.32 MtC higher, or more than 50% higher, than its actual emissions.
Table 6
Growth Rates of GDP and Energy Consumption, and the Income Elasticity of Energy Consumption among Different Economies, 1980-1994
Annual growth
of GDP (%)
Annual growth of energy consumption (%)
Income elasticity of energy consumption Low-income economies *
China
Upper-middle-income economies High-income economies
2.8 11.0
2.5 2.8
4.7 4.5 3.9 1.1
1.66 0.41 1.56 0.39
*
Excluding China.
Source: Calculated based on data from the World Bank (1996).
In addition to energy conservation, the penetration of carbon-free fuels contributed to a small reduction in CO2 emissions (-10.48 MtC). This is mainly due to the underdevelopment of hydropower, and partly because the development of nuclear power in China is still at the initial start-up stage.
6
The income elasticity of energy consumption is defined as the change in energy consumption divided by the change in economic growth.
7
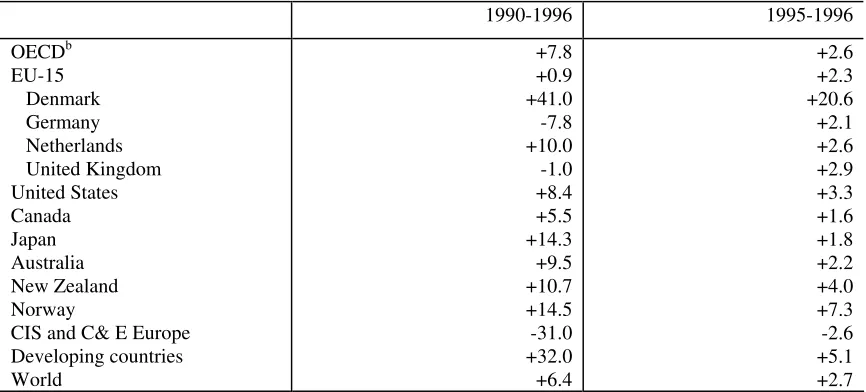
[image:10.612.86.522.426.500.2]From the preceding analysis, it follows that China has made significant contribution to reducing global CO2 emissions, although none of these carbon savings have resulted from domestic climate mitigation policies. While China is making such an impressive achievement, we might ask how the OECD countries perform in this regard. They accounted for 50.3% of global CO2 emissions in 1996 compared with 49.6% in 1990 (Jefferson, 1997) and promised at the Earth Summit in June 1992 to individually or jointly stablilize emissions of CO2 and other greenhouse gases at their 1990 levels by 2000. As shown in Table 7, the total CO2 emissions in the OECD countries rose by 7.8% between 1990 and 1996. On their current trends, CO2 emissions in the US and EU-15 (the fifteen member countries of the European Union) would be 13% and 8% above the promised targets in 2000 respectively (Jefferson, 1997; Reid and Goldemberg, 1997). Therefore, it is fair to say that, with few exceptions, most of the OECD countries are unlikely to meet their voluntary commitments to stablilizing CO2 emissions at their 1990 levels by 2000.
Table 7
Changes in CO2 Emissions from Fossil Fuel among Selected Countries and Regions (%)
a
1990-1996 1995-1996
OECDb EU-15 Denmark Germany Netherlands United Kingdom United States Canada Japan Australia New Zealand Norway
CIS and C& E Europe Developing countries World
+7.8 +0.9 +41.0 -7.8 +10.0 -1.0 +8.4 +5.5 +14.3 +9.5 +10.7 +14.5 -31.0 +32.0 +6.4
+2.6 +2.3 +20.6 +2.1 +2.6 +2.9 +3.3 +1.6 +1.8 +2.2 +4.0 +7.3 -2.6 +5.1 +2.7
a
A positive sign indicates an increase; A negative sign indicates a decline. b
Excluding Mexico, Korea, Hungary and Poland.
Source: Jefferson (1997).
3. Economic Effects of Future Carbon Limits for China
To this end, a dynamic computable general equilibrium (CGE) model of the Chinese economy has been developed.8 Using this CGE model, a baseline scenario for the Chinese economy has been developed under a set of assumptions about the exogenous variables. The baseline scenario is characterized by a rapid economic growth, with gross national product (GNP) being expected to grow at an average annual rate of 7.95% for the period from 1990 to 2010. Although the calculated rates of GNP growth are lower than those achieved in the early 1980s and 1990s, they are well in line with the government targets of GNP growth rate, which are set at 8-9% per annum for the period 1990-2000 and at 7.2% thereafter to 2010.9 Rapid economic growth will lead to increased energy consumption and hence CO2 emissions, despite substantial energy efficiency improvement. As shown in Table 8, total energy consumption is expected to rise from 987.0 million tons of coal equivalent (tce) in 1990 to 2560.4 million tce in 2010. Consequently, the baseline CO2 emissions are expected to grow from 586.9 million tons of carbon (tC) in 1990 to 1441.3 million tC in 2010, at an average annual rate of 4.59% for the period to 2010. While the absolute amounts of CO2 emissions in China are increasing in line with its rapid economic development, its carbon emissions per unit of output are expected to be cut about in half during the period 1990-2010.
Table 8
Energy-Related Results for the Baseline Scenario of the Chinese Economy
1990 1997 2010
Energy consumption (million tce)
Coal's share in total energy consumption (%) Energy consumption per capita (tce)
CO2 emissions (million tons of carbon) Carbon intensity of GDP (GNP)a
CO2 emissions per capita (tons of carbon)
987.0 76.2 0.86 586.9 0.802 0.51
1440.0 73.5 1.16 847.3 0.551 0.69
2560.4 67.5 1.80 1441.3
0.427 1.01
a Measured in tC per thousand US$ at 1980 prices.
Sources: Zhang (1997a, 1998a). Own calculations.
On a per capita basis, China's energy consumption of 0.86 tce in 1990 is expected to rise to 1.80 tce in 2010, while the corresponding CO2 emissions of 0.51 tC in 1990 are expected to rise to 1.01 tC in 2010. Although the amounts are expected to double over twenty years, they are still well below the corresponding current world average levels, which were equal to 2.12 tce and 1.14 tC respectively in 1990 (Zhang, 1997a).
Using the CGE model, we have then analyzed the implications of two scenarios under which China's CO2 emissions in 2010 will be cut by 20% and 30% respectively relative to the baseline (see Figure 4). The two emission targets are less restrictive in that they are not compared with the level of emissions in a single base year, but with the baseline CO2 emissions in 2010, the latter being 2.46 times that in 1990. The carbon tax required to achieve a 20% cut in CO2 emissions in 2010 relative to the baseline is estimated to be US$ 18 at 1987 prices, while the corresponding figure necessary to achieve a 30% cut in CO2 emissions in 2010 is estimated to be US$ 35 at 1987 prices.10 This means that a larger absolute cut in CO2 emissions will require a
8
Zhang (1997a) and Zhang and Folmer (1998) have argued that in analyzing the economic impacts of limiting CO2 emissions, a CGE approach is generally considered an appropriate tool. For a detailed description of the CGE model for China and its application, see Zhang (1997a, 1998a, 1998b).
9
Converted to the period 1990-2010, the government target of GNP growth rate ranges from 7.6% to 8.1% per annum.
10
higher carbon tax. A higher tax also implies higher fuel-specific tax rates and hence higher prices of fossil fuels.
Figure 4
CO2 Emissions in China under Alternative Scenarios
0 200 400 600 800 1000 1200 1400 1600
1990 1997 2010
CO2 em
issions (MtC)
Baseline Scenario 1
Scenario 2
As shown in Table 9, even under the two less restrictive carbon emission scenarios, China's GNP drops by 1.5% and 2.8% respectively and its welfare measured in Hicksian equivalent variation11 drops by 1.1% and 1.8% respectively in 2010 relative to the baseline. This indicates that the associated GNP and welfare losses tend to rise more sharply as the degree of the emission reduction increases. Given the fact that most studies surveyed by the Intergovernmental Panel on Climate Change second assessment report estimate that the economic losses under very restrictive carbon limits (e.g. stabilization or even 20% below 1990 levels in 2010) are reported not to exceed 2% of GNP for the OECD countries (IPCC, 1996), our results also support the general finding from global studies that China would be one of the regions hardest hit by carbon limits.12 This, combined with the industrialized countries being responsible for the majority of global CO2 emissions, explains the Chinese government stance on carbon abatement.
Table 9
Main Macroeconomic Effects for China in 2010
(Percentage deviations relative to the baseline)a
Scenario 1 Scenario 2
that China has used emissions charges to control emissions of a number of pollutants, including SO2 emissions in the acid rain control area.
11
Equivalent variation (EV) takes the pre-policy equilibrium income and consumer prices as given and measures the maximum amount of income that a consumer would be willing to pay to avoid the price change. Because EV measures income change at pre-policy prices, this makes it more suitable for comparisons among a variety of policy changes compared with the compensating variation. At each point in time, if EV is positive, post-policy welfare is improving; if negative, post-policy welfare is worsening. 12
GNP Welfare Private consumption Investment Exports Imports Energy consumption CO2 emissions
Price elasticity of carbon abatement
Price of coal Price of oil Price of natural gas
Average price of fossil fuels Price of electricity
Terms-of-trade Nominal wage rate Real exchange rate User price of capital Prices of exports Prices of imports
-1.521 -1.078 -1.165 -0.686 -5.382 -1.159 -19.468 -20.135 -0.396 +64.954 +15.296 +46.813 +50.888 +22.785 +3.636 -1.807 -0.004 -1.777 +3.633 -0.004 -2.763 -1.753 -2.972 -1.832 -7.447 -2.128 -29.322 -30.112 -0.317 +123.095 +29.144 +90.564 +94.895 +43.256 +3.822 -3.043 -0.021 -4.228 +3.801 -0.021
a A positive sign indicates an increase; A negative sign indicates a decline.
[image:14.612.92.520.70.327.2]Sources: Zhang (1997a, 1998a).
Table 10 shows the carbon tax levels across the countries and regions considered. It can be seen that there are significant differences in the carbon taxes required in order to achieve the same percentage of emission reductions relative to the baseline. As shown in Table 10, the carbon taxes would be much higher in the industrialized countries than in the developing countries, because the industrialized countries already have relatively energy-efficient economies, have limited possibilities for substituting less polluting energy sources, and already have high pre-carbon tax energy prices as a result of existing energy taxes. Moreover, Table 10 clearly indicates that the carbon taxes required in China in order to achieve the same percentage of emission reductions relative to the baseline are much lower than those of the industrialized countries and the world average. This provides the economic rationale for the development of carbon credit investment projects in China. Through the so-called “Clean Development Mechanism” (CDM) under the Kyoto Protocol, developing countries will be encouraged to combat global climate change. Now the US even wants to go beyond this by demanding major developing countries like China to commit themselves to some kind of limitation on GHG emissions, and threats that its ratification of the Kyoto Protocol is conditional on this. How should China respond to this challenge? This leads to another large subject.
Table 10
Carbon Taxes across Regions in 2010
(at 1985 $ per ton of carbon)
USA Japan EEC Total OECD China World
Scenario 1 Scenario 2 53.4 120.3 55.9 103.1 85.7 158.6 62.7 132.3 10.1 18.3 45.1 92.9
[image:14.612.90.525.620.671.2]4. Beyond Kyoto: Should China’s Current Stance Remain Unchanged?
In the run up to Kyoto, many Parties to the UNFCCC were keen to see joint implementation (JI) as a key part of any protocol -- even although it is not without conceptual and operational problems (Zhang, 1997a, 1997b). For example, the US had incorporated JI in its Draft Protocol to the UNFCCC submitted on 17 January 1997 to its Secretariat. Although it is regarded as offering the potential for lowering the global costs of abating GHG emissions, from the beginning, China, joining in many other developing countries, has strongly opposed to the concept of JI. With the support of many Western environmental non-governmental organisations, the developing countries have accused the developed countries of using JI as a means of buying their way out of responsibility for climate problems while postponing radical changes in their own consumption patterns and passing the responsibility on to the developing countries. The fact that JI is voluntary and is based on the decision of both Parties will probably not have much effect on their view. Developing countries have also expressed the fear that:
• All their low-cost abatement options would be used up, leaving them to face only high-cost options if they would be subsequently required to reduce their own emissions.
• The OECD countries would redefine existing development aid projects as JI projects, and reduce their aid budgets accordingly. Small developing countries, in particular, fear that JI would tend to shift the OECD countries' attention towards those developing countries with large economies and GHG emissions.
• Developed countries may use JI to interfere their internal affairs, given that the implementation of JI projects across national borders would touch on the issue of national sovereignty.
Acknowledging the strong opposition to JI in the developing world, the first Conference of the Parties (COP) to the UNFCCC in Berlin in April 1995 endorsed a pilot phase of JI referred to as “Activities Implemented Jointly” (AIJ) among Annex I Parties and, on a voluntary basis, with non-Annex I Parties. During the AIJ pilot phase, which ends no later than the year 2000, emission reductions achieved are not allowed to be credited to current national commitments of investor countries under the UNFCCC. Since inception of the pilot phase, however, a relatively small number of AIJ projects have so far been officially reported to the UNFCCC Secretariat as being accepted, approved or endorsed by the governments of the host and investor countries. This is attributed to a lack of adequate incentives for the private sector participation in project financing. In addition, the geographical distribution of these projects is quite uneven, with very few AIJ projects being established in Africa and Asia.
To speed up the cooperation between Annex I countries and non-Annex I countries in combating climate change, at the third COP held in Kyoto in December 1997, the CDM was established. Through the mechanism, Annex I countries can obtain the “certified emission reductions” (CERs) from jointly implemented projects with non-Annex I countries, and use them to count towards meeting their commitments under the Kyoto Protocol. The CDM differs from the AIJ in several aspects. The CDM explicitly aims to help non-Annex I countries achieve sustainable development, is a multilateral and trading mechanism, allows trading, and incorporates adaptation. It seems that the group of 77 and China may prove somewhat more receptive to the CDM than to the original concept of JI. But many issues remain unresolved, in particular regarding how the CDM will function, and what kind of modalities and rules will be applied for CDM projects. These issues, together with securing a meaningful participation of developing countries, will be on the top agenda at the fourth COP to be held in Buenos Aires in November 1998.
4.1 The Changed Negotiating Environment
Prior to Kyoto, developing counties’ demand for the US to demonstrate the leadership and the EU proposal for a 15% cut in emissions of a basket of three greenhouse gases below 1990 levels by 2010 put collective pressure on the US, which leads the world in GHG emissions. Now the US has made legally binding commitments at Kyoto. The Kyoto target is seen as not enough but yet not unreasonable given that the US economy would not be disrupted unreasonably (King, 1998).13 Now the ball is kicked off to China’s court.
13
The US has made it clear that bringing key developing countries, including China, on board will be the focus of the upcoming fourth COP in Buenos Aires. According to some US Senators, it will be countries like China, India and Mexico that will decide whether the US will ratify the Kyoto Protocol. It is therefore conceivable that the pressure will mount for China to make some kind of commitments at and beyond Buenos Aires. The world’s media will undoubtedly bring attention to China’s non-participation, which will be seen as holding up the ratification of the Protocol by the US Senate and possibly even be blamed for “blowing up” subsequent negotiations aimed at dealing with developing countries’ commitments.
While preparing for greater and greater pressure from the US, China should take the following non-US factors into account in developing its post-Kyoto climate negotiation strategies.
First, moving the meeting place of the COP from industrialized countries to a developing country presents an unprecedented challenge for China. For the first time, the COP’s annual conference will take place in a developing country, and the host country, Argentina, certainly hopes that the spirit of Kyoto would continue so that Buenos Aires, too, would be regarded positively. If the success of the third COP at Kyoto was marked by the setting of legally binding emissions targets and timetables for industrialized countries and by incorporating cooperative implementation mechanisms, then the fate of the fourth COP at Buenos Aires will hinge on how and to what extent developing countries should be brought into the battle against climate change, and whether rules and guidelines could be worked out for cooperative implementation mechanisms. As might be expected, Argentina has proposed placing the voluntary reduction in GHG emissions by developing countries on the agenda.
Second, although the group of 77 and China14 managed to block the US proposal for allowing a developing country to voluntarily commit to reductions in GHG emissions at Kyoto, the US had partial success in weakening the position of the group. As might be expected, the US will probably continue to apply the “divide and rule” tactic by getting at least a few to accept obligations they are not required to undertake and then putting pressure on the rest of the developing countries to do the same, exploiting the fact that such developing countries as South Korea and Argentina have already prepared to take on voluntary commitments.15 Given the fact that developing countries are a more diverse and heterogeneous group than the Annex I countries, and that their interests in the climate change debate are heterogeneous and occasionally competing, it might be very difficult to prevent some countries in the group -- particularly those countries with a relatively high per capita income and that perceive the greatest potential gain from emissions trading -- from being drawn into making commitments of their own at and beyond Buenos Aires.
Third, after the first commitment period 2008-2012, China will soon surpass the US as the world’s largest GHG emitter, due mainly to its sheer size of population and partly to its rapidly growing economy. While it will still take another couple of decades for cumulative GHG emissions from China to exceed those of the US, Western media and some US Senators could deliberately misguide the general public’s attention and then shift the attack on the US to China.
Under these new circumstances, it would be unwise for China just to sit back and let the US define what is “meaningful participation” from developing countries. It would be also unwise for China simply to reject any proposals at and beyond Buenos Aires. Doing so would only create negative image and publicity for China, which has been regarded as a “hard liner” at the climate change negotiations. In the meantime, China should keep watch on the negotiating positions of such developing countries as Argentina, Costa
14
As has been the case in the international climate change negotiations, the developing countries express their consensus views as the group of 77 and China’s positions. Divergent or dissenting views are then expressed separately, representing either individual countries or smaller groups, such as the Alliance of Small Island States (AOSIS).
15
Rica and South Korean and should not let the fate of the whole South be left at the hands of these relatively high-per-capita-income countries.
4.2 Strategies for China’s post-Kyoto Climate Change Negotiations
Faced with a different situation from that at Kyoto, China should ponder deeply over its strategies at the post-Kyoto climate change negotiations. On the one hand, China should take much more efforts towards communicating to the industrialized world the substantial contributions it has already made to limiting GHG emissions. China has cut its energy consumption per unit of output in half since 1980, indicating that if the energy intensity were the same now as that in 1980, China would consume twice as much energy, and produce twice as much CO2 emissions as it now does. Unfortunately, this achievement is not widely known or appreciated outside of China: outsiders know that the Chinese economy is booming, but they are not as cognizant of China’s very impressive improvement in energy efficiency. Therefore, efforts towards effective communication about what has been achieved in China to the outside world will help to correct the distorted picture that had been painted.
On the other hand, while insisting on its legitimate demand for industrialized countries to provide adequate technology transfer and financing, and demanding thatemissions targets beyond the first commitment period be set for Annex I countries at the subsequent negotiations over new additional developing countries’ commitments, China could propose and direct negotiations, rather than just react and respond. In proposing its voluntary efforts and commitments, China should bear in mind that demanding for the “equal per capita entitlements” is politically unrealistic for the time span we are considering, although it is perfectly justified on grounds that all human beings are born equal and that the atmosphere is a global common. On the other hand, the US demand for imposing a cap on China’s future emissions is absolutely unacceptable for China, at least until its per capita income catches up with the level of middle-developed countries. For these reasons, we reject both “equal per capita entitlements” and an absolute cap on national emissions. We envision the following five proposals that could be put on the table as China’s plausible negotiation position, which are each described in the order of their stringentness.
First, just as Article 3.2 requires Annex I countries to “have made demonstrable progress” in achieving their commitments by 2005, China could commit to demonstrable efforts towards slowing its GHG emissions growth at some point between the first commitment period and 2020. Securing the undefined “demonstrable progress” regarding China’s efforts is the best option that China should fight for at and beyond the fourth COP in Buenos Aires.
Second, if the above commitment is not considered “meaningful”, China could go a little farther to make voluntary commitments to specific policies and measures to limit GHG emissions at some point between the first commitment period and 2020. Policies and measures might need to be developed to explicitly demonstrate whether or not China has made adequate efforts. Such policies and measures might include abolishing energy subsidies, improving the efficiency of energy use, promoting renewable energies, and increasing the R&D spending on developing environmentally sound coal technologies.
China should resort to all means of securing either of the above deals. It could even lobby for support from the EU, and therefore put collective pressure on the US.16 If all the attempts prove unsuccessful, China might resort to the last three options.
16
Third, China could make a voluntary commitment to total energy consumption or total GHG emissions per unit of GDP at some point around or beyond 2020.17 Such a commitment would still allow China to grow economically while improving the environment. It reflects a basic element of the UNFCCC, which has recongnized the developing countries’ need for further development and economic growth. The industrialized countries, particularly the US, have no reason or right to argue against it. To do so would contradict their claim that asking China’s involvement in combating global climate change is not intended to limit its capacity to industrialize, reduce poverty and raise its standards of living. Even if the Chinese government has claimed that China will continue its efforts towards improving energy efficiency and minimizing further degradation of the environment in any event, it would be wise to propose an explicit value for energy or carbon intensity of the economy as a starting point for negotiations. In this regard, there is a pressing need for comprehensive analysis and quantification of the economic implications of climate change for China. For a long time, the Chinese government has claimed that asking for China to take actions would seriously harm China’s economic development. However, until now, there has been no single comprehensive study indicating the economic effects of possible future carbon limits for China, for example, in terms of foregone national income. Findings that show that China would be the region hardest hit by carbon limits can help convince the world of the Chinese government’s claim. Such information can be used to China’s advantage in bargaining a possible targeted energy or carbon intensity with other countries, as well.
The fourth option would be for China to voluntarily commit to an emissions cap on a particular sector at some point around or beyond 2020. Taking on such a commitment, although already burdensome for China, could raise the US concern about the carbon leakage from the sector to those sectors whose emissions are not capped.
This leads to the final option that China could offer: a combination of a targeted energy or carbon intensity level with an emissions cap on a particular sector at some point around or beyond 2020. This is the bottom line: China can not afford to go beyond it until its per capita income catches up with the level of middle-developed countries.
4.3 Combating Global Climate Change Is in China’s Interest
Because economic development remains the priority for China, its climate policy would focus on the so-called win-win strategies. The above efforts and commitments proposed for China reflect that; they do not go beyond the scope of taking no-cost or low-cost “no-regrets” actions. Although the last three commitments are more stringent than the first two, none of them would be likely to severely jeopardize Chinese economic development. Indeed, taking due responsibilities in combating global climate change should be in China’s interest on the following grounds.
First, because climate-sensitive sectors such as agriculture still account for a much larger proportion of GDP in China than in the developed countries (see Table 5), China is even more vulnerable to climate change than the developed countries. Therefore, a broad commitment to global efforts towards limiting GHG emissions would reduce the potential damage from climate change in China itself, since after all it is not only the developed countries whose climate will change if GHG emissions are not reduced.
Second, China is scarce in energy, with per capita energy endowments far below the world average (see Table 11). Although energy consumption per unit of output in China has been cut in half since 1980, its major industries continue to use energy far more intensively than in industrialized countries (see Table 12). By making the above commitments, China will be pushed for a more efficient use of its scarce energy resources.
Table 11
Proved Reserves and Utilization Rates of Fossil Fuels in China, 1997
17
Resources Proved reserves R/P ratioa (years) Per capita proved reservesb
China China World China World
Coal
% world total Oil
% world total Natural gas % world total
114.5 billion tons 11.1% 3.3 billion tons
2.3%
1.16 trillion cubic meters 0.8% 82 21 52 219 41 64 95 3 967 182 25 25517 a
R/P ratio stands for the lifetime of proved reserves at 1997 rates of production. b
Measured in tons for coal and oil and in cubic meters for natural gas and based on population in 1995.
[image:19.612.93.524.288.411.2]Sources: Calculated based on data from the British Petroleum (1998) and World Bank (1997c).
Table 12
A Comparison of Unit Energy Consumption for Selected Energy-Intensive Users
1980 China 1994 China Advanced level abroad
Comparable energy consumption per ton of steel (tce/t) Energy consumption per ton of synthetic ammonia (tce/t) Large plants
Small plants
Energy consumption per ton of cement clinker (kgce/t) Net coal consumption of coal-fired plants (gce/kWh) Thermal efficiency of industrial boilers (%)
1.30 1.45 2.90 206.5 448 1.03a 1.34a 2.09 175.3 413 60-70 0.6 (Italy) 1.2 108.4 (Japan) 327 (ex-USSR) 80-85 a In 1990.
Source: Zhang (1997a).
Third, driven by the threat of further degradation of the environment18 and the harmful economic effects of energy shortages, China is already determined to push energy conservation and enhanced energy efficiency in general and more efficient coal usage in particular. Although it is taking such drastic domestic efforts on its own, China badly needs assistance and economic and technical cooperation with the developed countries, because of the huge amounts of capital and technical expertise required. In this regard, the CDM, if designed appropriately, could provide an opportunity for China to get increased access to more advanced energy efficiency and pollution control technologies and additional funding.
From this, it follows that the above efforts and commitments proposed for China, though aimed at limiting GHG emissions, will contribute to the reductions in local pollutants and thus will be beneficial to a more sustainable development of the Chinese economy.
5. Conclusions
In the face of a potentially serious global climate change problem, the industrialized countries finally committed themselves to legally binding emissions targets and timetables for reducing their GHG emissions in
18
Kyoto. Since China has made no concrete commitments, it has been criticised as a “free-rider”. By examining the historical evolution of China’s CO2 emissions during the period 1980-1997, however, and analyzing the historical contributions of inter-fuel switching, energy conservation, economic growth and population expansion to CO2 emissions, we have shown that such criticism is without foundation. Indeed, China has made significant contribution to reducing global CO2 emissions. By implementing a series of policies and measures towards energy conservation, China has cut its energy consumption per unit of output in half since 1980. In other words, without these efforts, China’s CO2 emissions in 1997 would have been 432.32 MtC higher, or more than 50% higher, than its actual emissions. Given the fact that most developing countries at China’s income level have the income elasticity of energy consumption well above one (see Table 6), this makes China’s achievement unique in the developing world, and surpasses that of the OECD countries, most of which will fail to honour their promises at the Earth Summit to stabilizing CO2 emissions at their 1990 levels by 2000. Clearly, in order to correct a much distorted picture that had been painted for China, there is a pressing need for China to take more efforts to effectively communicate its achievements to the outside world.
Of course, this is not to justify no further action by China. Indeed, faced with both the mounting pressure from the US and the new post-Kyoto negotiating environment, andgiven the global characteristics of climate change and China's importance as a source of future CO2 emissions in line with its industrialization and urbanization, China cannot come away without taking due responsibilities. On the other hand, it should be kept in mind that economic development still remains the priority for China. For this reason, any demand for imposing a cap on its future emissions is absolutely unacceptable for China, at least until its per capita income catches up with the level of middle-developed countries. Realistic efforts and commitments that could be expected from China range from demonstrating efforts towards slowing its GHG emissions growth at some point between the first commitment period and 2020 to committing to a combination of a targeted energy or carbon intensity level with an emissions cap on a particular sector around or beyond 2020. With their focus on the win-win strategies, such efforts and commitments could be unlikely to severely jeopardize the Chinese economic development and, at the same time, would give China more leverage at the post-Kyoto climate change negotiations. Though aimed at limiting GHG emissions, they will also contribute to the reductions in local pollutants and thus will be beneficial to a more sustainable development of the Chinese economy as well as to the global climate.
Acknowledgements
This article has been commissioned by the United Nations Development Programme (UNDP) and the World Resources Institute (WRI). It was presented at the UNDP Workshop on Slowing Greenhouse Gas Emissions Growth while Promoting Sustainable Development, New York, 20-21 August, 1998. I would like to thank the participants in the Workshop, particularly Jose Goldemberg, Thomas B. Johansson, and Walter Reid for useful discussions and comments on an earlier version of the article. The views expressed here are those of the author and do not necessarily reflect those of the UNDP, WRI or the Chinese government.
References
British Petroleum (1998), BP Statistical Review of World Energy 1998, London. Ehrlich, P. and A. Ehrlich (1990), The Population Explosion, Touchstone, New York.
Energy Research Institute (1991), CO2 Emissions from Fossil Fuel Combustion and Reduction Countermeasures in China, Bulletin of Energy Policy Research, No. 2, pp. 4-7, State Planning Commission, Beijing.
IPCC (1996), Climate Change 1995: Economic and Social Dimensions of Climate Change, Contribution of Working Group III to the Second Assessment Report of the Intergovernmental Panel on Climate Change (IPCC), Cambridge University Press, Cambridge.
King, E. (1998), Spoke as a Representative of Small Island States at the Latin American Workshop on New Partnerships for Sustainable Development: The Clean Development Mechanism under the Kyoto Protocol, 28-29 April, Mangaratiba, Brazil.
Kosmo, M. (1987), Money to Burn? The High Costs of Energy Subsidies, World Resources Institute, Washington, DC.
MOEP (1985), Electric Power Industry in China 1984-85, Ministry of Electric Power (MOEP), Beijing. Neary, J.P. and K.W.S. Roberts (1980), The Theory of Household Behaviour under Rationing, European
Economic Review, Vol. 13, pp. 25-42.
Reid, W. and J. Goldemberg (1997), Are Developing Countries Already Doing As Much As Industrialised Countries to Slow Climate Change?, Climate Notes, World Resources Institute, Washington, DC. SETC (1996), China Energy Annual Review, State Economic and Trade Commission (SETC), Beijing. Smil, V. (1996), Environmental Problems in China: Estimates of Economic Costs, East-West Center,
Honolulu.
State Statistical Bureau (1992), Energy Statistical Yearbook of China 1991, State Statistical Publishing House, Beijing.
State Statistical Bureau (1998), A Statistical Survey of China 1998, State Statistical Publishing House, Beijing.
UNCTAD (1998), Greenhouse Gas Emissions Trading: Defining the Principles, Modalities, Rules and Guidelines for Verification, Reporting and Accountability, United Nations Conference on Trade and Development (UNCTAD), Geneva.
UNFCCC (1997), Kyoto Protocol to the United Nations Framework Convention on Climate Change (UNFCCC), FCCC/CP/1997/L.7/Add.1, Bonn.
World Bank (1994), China: Issues and Options in Greenhouse Gas Emissions Control, Washington, DC. World Bank (1996), World Development Report 1996, Oxford University Press, New York.
World Bank (1997a), Expanding the Measure of Wealth: Indicators of Environmentally Sustainable Development, Washington, DC.
World Bank (1997b), Clear Water, Blue Skies: China’s Environment in the New Century, Washington, DC.
World Bank (1997c), World Development Report 1997, Oxford University Press, New York.
Yellen, J. (1998), Statement before the House Commerce Subcommittee on Energy and Power on the Economics of the Kyoto Protocol, 4 March, Washington, DC.
Zhang, Z.X. (1997a), The Economics of Energy Policy in China: Implications for Global Climate Change, New Horizons in Environmental Economics Series, Edward Elgar, England.
Zhang, Z.X. (1997b), Operationalization and Priority of Joint Implementation Projects, Intereconomics, Vol. 32, No. 6, pp. 280-292.
Zhang, Z.X. (1998a), Macroeconomic Effects of CO2 Emission Limits: A Computable General Equilibrium Analysis for China, Journal of Policy Modeling, Vol. 20, No. 2, pp. 213-250.
Zhang, Z.X. (1998b), Macro-economic and Sectoral Effects of Carbon Taxes: A General Equilibrium Assess-ment for China, Economic Systems Research, Vol. 10, No. 2, pp. 135-159.