http://dx.doi.org/10.4236/epe.2014.610027
Implementation of Parallel Synchronization
Method of Generators for Power & Cost
Saving in University of Gujrat
Uzma Amin, Ghulam Ahmad, Sumbal Zahoor, Fariha Durrani
ElectricalEngineering Department, Faculty of Engineering, University of South Asia, Lahore, Pakistan Email: [email protected]
Received 28July 2014; revised 12August 2014; accepted 20August 2014
Copyright © 2014 by authors and Scientific Research Publishing Inc.
This work is licensed under the Creative Commons Attribution International License (CC BY).
http://creativecommons.org/licenses/by/4.0/
Abstract
In the current economic and political scenario of Pakistan where new projects of Electrical gen-eration seems impossible, one should adopt such means so as to minimize the power consumption via load management. In this paper a relatively better Electrical power system is proposed for University of Gujrat (UOG) power system. UOG runs its all generators whether it is full load or merely a load of 20 percent as a standby power. It is suggested that if generators system is syn-chronized and connected in parallel, it can not only minimize the cost, number of personnel re-quired but also increase the reliability of the system. ETAP software is used for simulation and results show that by adopting this method generation cost can be reduced up to 30 percent which is indeed a huge figure. Losses and cable parameters were calculated using this software and found this proposal quite feasible.
Keywords
Synchronization, Load Management, Reliability, Cable, Transformer
1. Introduction
block faces total black out. So to provide continuous supply to all of the blocks, it is better to operate generators in parallel (synchronized generators operation). In this way if any of the generators goes out of order, the blocks will still avail electricity supply from parallel connected generators. This is the main idea of this research work.
UOG is facing financial losses in aspect of standby power system. These losses comprise of fuel cost, higher maintenance cost and lubrication oil cost. Therefore by implementing this method, these losses can be reduced to a great extent. Furthermore UOG can also avail many advantages of this configuration like a lot of savings in terms of diesel cost. For example in synchronized operation of generators, there may be a need to run only two generators instead of three or four, hence fuel and maintenance cost is reduced.
Heavy load of blocks for example machinery, medical lab equipment, and other such sort of massive loads can be operated easily by parallel synchronization method because all the generators are synchronized and bulk load can be managed. But in existing system to operate such load, a separate generator has to install as it is done in Medical Block in recent months. Synchronized generators method also has the ability to meet future expan-sion of the load. For example, if all the blocks have to build a new computer lab in future then to meet this de-mand, there is a need to install a single generator in parallel. But if generators are not synchronized, we have to install a generator for all of the blocks instead of one. In parallel operation of generators efficiency of the system will be improved. Less number of personnel is required [1].
2. Power System of UOG
2.1. Transformers
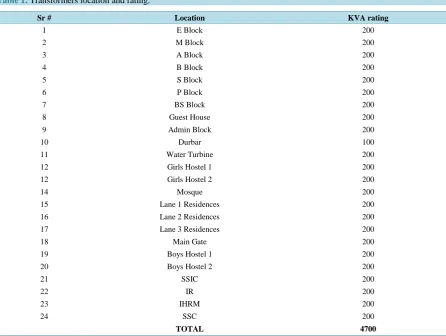
[image:2.595.90.537.385.721.2]The power entering into the UOG power system is distributed using distribution transformers of different KVA ratings. These transformers step down the voltage from 11 kV to 400 volts line to line. There are a total of about 36 transformers of total 4700 kVA. Their number and kVA ratings, the location of each transformer with the load it is serving, the current output of each transformer and the voltage at each of them given in Table 1.
Table 1. Transformers location and rating.
Sr # Location KVA rating
1 E Block 200
2 M Block 200
3 A Block 200
4 B Block 200
5 S Block 200
6 P Block 200
7 BS Block 200
8 Guest House 200
9 Admin Block 200
10 Durbar 100
11 Water Turbine 200
12 Girls Hostel 1 200
12 Girls Hostel 2 200
14 Mosque 200
15 Lane 1 Residences 200
16 Lane 2 Residences 200
17 Lane 3 Residences 200
18 Main Gate 200
19 Boys Hostel 1 200
20 Boys Hostel 2 200
21 SSIC 200
22 IR 200
23 IHRM 200
24 SSC 200
2.2. Generators
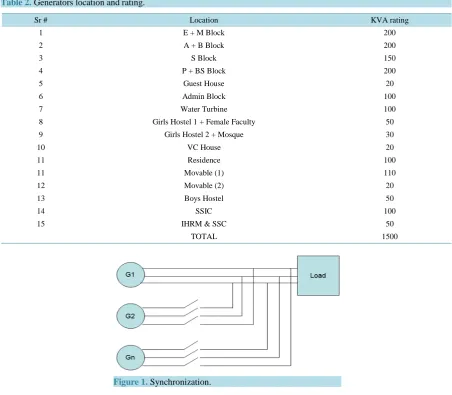
The power input source of UOG is behind the main gate of the university, which is provided by WAPDA. It also has thirteen mobile diesel operated generator sets of different capacity. All these generator sets are made by SMJ company. The generation voltage of these generators sets is 380 V, which is directly fed to the different department of UOG. Location and kVA rating of these generators is shown in Table 2.
3. What Is Synchronization
In today’s world of technology, a separate generator is found very rare supplying the load independently. Very often on small places where the emergency power is required for a short while the synchronous generator is used independently. As in any Electrical system, the loads are not constant load is varying with time, Electrical sys-tems are interconnection of large number of alternators operating in parallel and supplying large number of loads. During the process of synchronization of generators the magnitude of voltage, frequency and phase angle is kept constant this process of paralleling of one alternator to another or to the bus bar is called the synchroniza-tion. Figure 1 shows the block diagram of the synchronized system, where three generators are connected to the same load and any time these can be used together to address the load demand [2].
3.1. Need of Synchronization
[image:3.595.86.539.332.727.2]In any power system it is preferred that instead of supplying power with one big unit, use one or more units at
Table 2. Generators location and rating.
Sr # Location KVA rating
1 E + M Block 200
2 A + B Block 200
3 S Block 150
4 P + BS Block 200
5 Guest House 20
6 Admin Block 100
7 Water Turbine 100
8 Girls Hostel 1 + Female Faculty 50
9 Girls Hostel 2 + Mosque 30
10 VC House 20
11 Residence 100
11 Movable (1) 110
12 Movable (2) 20
13 Boys Hostel 50
14 SSIC 100
15 IHRM & SSC 50
TOTAL 1500
different load conditions, there are number of benefits that are given below when we run alternators in parallel. 1) As we know the efficiency of any machine is maximum at its full load and we can run any machine when it is required and doing this efficiency can be increased.
2) Using several generators can supply a bigger load.
3) Reliability of the system is increased since if one generator is failed than the other is used for the operation and whole system will not be shut down.
4) Having many generators that are working in parallel we can remove one or more generator for the mainte-nance purpose.
5) If load demand increases than more generators can be connected.
6) Instead of placing generators at different locations it is better to place all of them at one place it will ease the maintenance.
7) Standby losses and per unit price is reduced because our generation is according to our demand [3].
3.2. Conditions for Synchronization
The conditions for the generators to be paralleled are given below:
1) The RMS value new coming generator voltage should be equal to the bus bar voltage.
2) The phase sequence of new coming generator should be same to that of bus bar. The phase angle must be the same.
3) The frequency of new generator called the incoming frequency of the generator should be slightly higher than that of running frequency of the bus bar.
The first condition can be found by using the volt meter and the second and 3rd can be found by using lamp method or Synchroscope [4].
3.3. Techniques for Synchronization
Different techniques are being used for the synchronization of the alternators, the purpose is to check the all four conditions listed above and then different schemes are used to connect the generators to the system. These methods are given below:
1) The bright lamp method. 2) The dark lamp method. 3) The Synchroscope method.
These methods are not preferred today due to less accuracy and manual operation; these methods required a very experienced person and also reliability and security of these methods is not enough. So, Synchroscope method is used now a day and microprocessor based systems are used for the automatic synchronization of the alternators, these methods are reliable and easier to manage [5].
3.4. Synchronization Using Synchroscope
As it is already being explained that for synchronization the lamp method is not applicable because it depends on operator decision and experience. And although the three lamp method is cheap but it cannot tell us that ei-ther the frequency of incoming generator is higher or lower, in order to parallel alternators in right way a device named Synchroscope is used. In larger systems lamp method is not applicable so Synchroscope method is used. It consists of three coils and one moving vane. A pointer is connected to moving vane. The coils are connected to the bus bar and the alternator which is to be synchronized. The potential transformer is used to measure the voltage difference, the pointer move in clockwise and antic clockwise manner and when speed of incoming ma-chine is same to that of bus bar then pointer will stop at vertical point and relays are closed that connect the al-ternator to the bus bar as shown below inFigure 2. Assume the voltage difference, the pointer move in clock-wise or anti clockclock-wise manner and when speed of incoming machine is same to that of bus.
Figure 2. Schematic diagram of Synchroscope.
4. Existing System of UOG and Its Drawbacks
4.1. Power Requirement of UOG
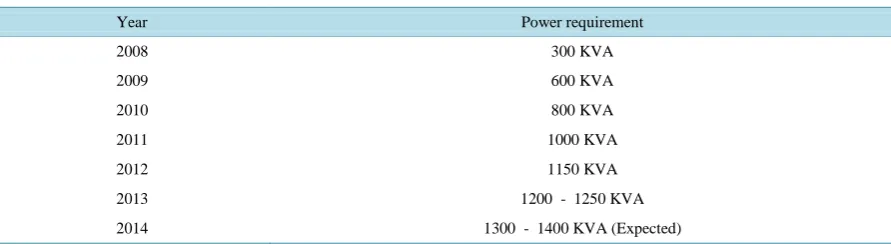
Annual power required for UOG is increasing day by day; energy requirement for UOG from year 2009 to 2013 and expected increase in energy demand after 2013 is given in Table 3.
4.2. Prime Power
As the energy crisis in Pakistan is almost at its peak, approximately there is 12 - 16 hours of load shedding per day. So that’s why the prime power supplied by the electric company is almost 30% - 40%. Due to this severe problem, UOG requires a lot of stand by energy to fulfill out electricity requirements. In the compensation of this problem UOG is using generators to accomplish their stand by power. The per unit cost of electricity is given below:
Present cost of WAPDA/Kwhr (Unit) = 13 Rs./Kwhr [6].
4.3. Standby Power
In order to fulfill the standby power requirements, UOG is using number of generators at different locations. Per unit cost of stand by generators are: Cost of unit produced by diesel generator/Kwh (Unit) = 33 Rs./Kwhr. The total generation capacity of these generators is 1500 KVA.
5. Drawbacks of Existing System
5.1. No Reliability
For every system reliability is one the most important factor. It means supply of energy should be consistently available at any time. The current system is not reliable as it should be. For example academic blocks are fed by separate generators and in case of maintenance issue or if any generator is out of order for a time, the respected block is black out, and the minimum maintenance time for a generator is at least one day, it means the respected block should remain without electricity for a long time.
One another example is of the generator which is installed for water pump is of 100 kVA, if this generator is out of order the water supply for the entire university is disturbed, on the same time all the generators are run-ning properly and generating extra electricity which is not entertained. According to current system there are blocks which are fed by a generator of high kVA rating which is large enough to entertain two blocks at once. In case one generator for a block is out of order and at the same time the generator of adjacent block generates enough electricity which could entertain both the blocks, but the current system does not allow doing so.
5.2. Higher Cost
Table 3. Power requirement of UOG.
Year Power requirement
2008 300 KVA
2009 600 KVA
2010 800 KVA
2011 1000 KVA
2012 1150 KVA
2013 1200 - 1250 KVA
2014 1300 - 1400 KVA (Expected)
demic blocks. For example in winter season and after 4 PM. the total demand of the academic blocks is reduced to 25% of the peak demand, it could be fed by one generator and separate generator for each block is not re-quired. But use of all generators as in the case of existing system to provide the electricity increases the cost in terms of diesel and maintenance requirement.
5.3. Less Efficiency
Efficiency is one of the most important factor of the system. Smaller input and greater output is the first prefer-ence. A more efficient system provides more stability and reduces cost and losses. In UOG all of the generators are running at 25% - 50% of the maximum load. The optimal operational point for synchronous generator is 75% - 80% load of its rated value. At this optimal point the synchronous generator will be at its maximum efficiency. At evening the generators are operated at 25% of the load in order to reduce diesel cost, its mean generators are operating at lower efficiency that is not good for the life of the generator. Using one generator running at 80% of the load will increase the efficiency of the system and reduces the fuel and maintenance cost as well [7] [8].
5.4. No Future Extension
An Electrical system is designed in such a manner to provide electricity for the loads introducing in future. This increases the reliability of that system. If a system is designed according to the prescribed condition it will be long lasting. It is noticed that electricity demand is increasing annually in UOG so in case of future expansion same generators will not be able to feed the system. For this compensation there is requirement to install new generators or replace the existing one by a higher kVA value, but both of the things are difficult to evaluate.
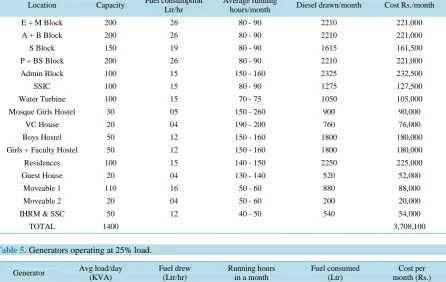
5.5. Annual Diesel Cost of Existing Generators
Annual costs of diesel generators have been calculated. Calculations were shown in Table 4. Total diesel cost per year is Rs. 3,780,100/—excluding lubrication cost.
6. Fuel Cost Comparison for Existing & Proposed System
In this section calculations were done for the fuel cost of various months and the savings obtained by connecting the generators in parallel combination (Synchronization). For these calculations an average of 5 - 6 hour load shading is taken into account. Fuel cost and savings in the month of March is given below in Tables 5-7.
Fuel Cost Comparison in Month of March
Avg load at Generator 1 per day = 42.66 kVA.Avg load at Generator 2 per day = 41.86 kVA. Avg load at Generator 3 per day = 26.91 kVA. Avg load at Generator 4 per day = 40.70 kVA. So savings in the month of March is = Rs. 441,575.
Table 4. Diesel cost of existing generators.
Location Capacity Fuel consumption
Ltr/hr
Average running
hours/month Diesel drawn/month Cost Rs./month
E + M Block 200 26 80 - 90 2210 221,000
A + B Block 200 26 80 - 90 2210 221,000
S Block 150 19 80 - 90 1615 161,500
P + BS Block 200 26 80 - 90 2210 221,000
Admin Block 100 15 150 - 160 2325 232,500
SSIC 100 15 80 - 90 1275 127,500
Water Turbine 100 15 70 - 75 1050 105,000
Mosque Girls Hostel 30 05 150 - 260 900 90,000
VC House 20 04 190 - 200 760 76,000
Boys Hostel 50 12 150 - 160 1800 180,000
Girls + Faculty Hostel 50 12 150 - 160 1800 180,000
Residences 100 15 140 - 150 2250 225,000
Guest House 20 04 130 - 140 520 52,000
Moveable 1 110 16 50 - 60 880 88,000
Moveable 2 20 04 50 - 60 200 20,000
IHRM & SSC 50 12 40 - 50 540 54,000
[image:7.595.91.538.108.390.2]TOTAL 1400 3,708,100
Table 5. Generators operating at 25% load.
Generator Avg load/day
(KVA)
Fuel drew (Ltr/hr)
Running hours in a month
Fuel consumed (Ltr)
Cost per month (Rs.)
G1 42.66 12.5 85 1079.5 107,900
G2 41.86 12.5 85 1079.5 107,900
G3 26.91 09 85 765.5 76,500
G4 40.70 12.5 85 1079.5 107,900
Total 152.3 45.5 340 4003.5 400,200
Table 6. Generators operating at 50% load.
Generator Avg load/day
(KVA)
Fuel drew (Ltr/hr)
Running hours in a month
Fuel consumed
(Ltr) Cost per month (Rs.)
G1 42.66 25 85 2125 212,500
G2 41.86 25 85 2125 212,500
G3 26.91 17 85 1445 122,825
G4 40.70 25 85 2125 212,500
Total 152.3 92 340 7820 760,325
Table 7. Generators operating at 80% load.
Generator Avg load/day
(KVA)
Fuel drew (Ltr/hr)
Running hours In a month
Fuel consumed (Ltr)
Cost per month (Rs.)
200 KVA 152. 3 37.5 85 3187.5 318750
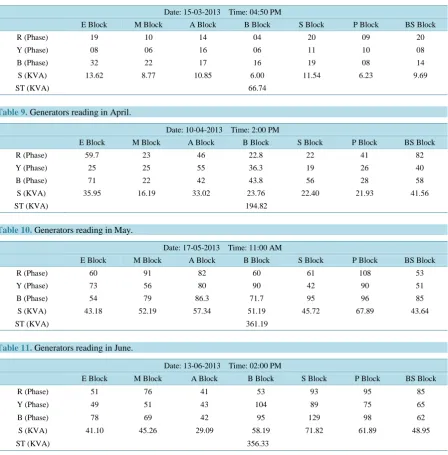
7. Real Time Reading of Generators
Generators Reading in Different Months
Table 8. Generators reading in March.
Date: 15-03-2013 Time: 04:50 PM
E Block M Block A Block B Block S Block P Block BS Block
R (Phase) 19 10 14 04 20 09 20
Y (Phase) 08 06 16 06 11 10 08
B (Phase) 32 22 17 16 19 08 14
S (KVA) 13.62 8.77 10.85 6.00 11.54 6.23 9.69
ST (KVA) 66.74
Table 9. Generators reading in April.
Date: 10-04-2013 Time: 2:00 PM
E Block M Block A Block B Block S Block P Block BS Block
R (Phase) 59.7 23 46 22.8 22 41 82
Y (Phase) 25 25 55 36.3 19 26 40
B (Phase) 71 22 42 43.8 56 28 58
S (KVA) 35.95 16.19 33.02 23.76 22.40 21.93 41.56
ST (KVA) 194.82
Table 10. Generators reading in May.
Date: 17-05-2013 Time: 11:00 AM
E Block M Block A Block B Block S Block P Block BS Block
R (Phase) 60 91 82 60 61 108 53
Y (Phase) 73 56 80 90 42 90 51
B (Phase) 54 79 86.3 71.7 95 96 85
S (KVA) 43.18 52.19 57.34 51.19 45.72 67.89 43.64
ST (KVA) 361.19
Table 11. Generators reading in June.
Date: 13-06-2013 Time: 02:00 PM
E Block M Block A Block B Block S Block P Block BS Block
R (Phase) 51 76 41 53 93 95 85
Y (Phase) 49 51 43 104 89 75 65
B (Phase) 78 69 42 95 129 98 62
S (KVA) 41.10 45.26 29.09 58.19 71.82 61.89 48.95
ST (KVA) 356.33
8. E-Tap Simulations
Using previous mentioned readings of loads two E-Tap models one for synchronized system and for un-syn- chronized system were made for the power system of UOG. In these models real time values of load were used. The ETAP Load Flow Analysis module calculates the bus voltages, branch power factors, currents, and power flows, throughout the Electrical system. Newton Raphson method is adopted to find the optimum results and five iterations were required for this method. Following are the equations used in Newton Raphson calculations.
<
Vρ =Vρ δρ =eρ+ jfρ (1)
eρ and jfρ are real and imaginary parts of voltage in Equation (1).
(
)
1 , i
P =U e f (2)
(
)
2 , i
δ is the phase angle and Piand Qi denotes the real and active power in Equations (1), (2) and (3) respectively.
2 2
n i n i
i p p p p
p p
P P
P e f
e f
= =
∂ ∂
∆ = ∆ + ∆
∂ ∂
∑
∑
(4)2 2
n i n i
i p p p p
p p
Q Q
Q e f
e f
= =
∂ ∂
∆ = ∆ + ∆
∂ ∂
∑
∑
(5)Active and reactive power mismatch can be calculated from Equations (4) and (5) respectively.
1 2 3 4
J J
P e
Q J J f
∆ ∆
= ⋅
∆ ∆
(6)
2 2 2
i i i
V =e + f (7)
Voltage is the sum of square of real and imaginary parts of voltage and can be calculated using Equation (7).
2 2
2 i i
i i i
i i
V V
V e f
e f
∂ ∂
∆ = ∆ + ∆
∂ ∂ (8)
Voltage mismatch can be calculated using Equation (8).
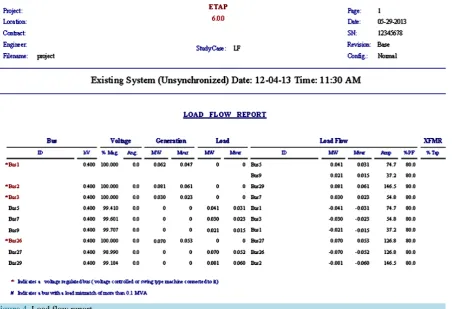
8.1. Un-Synchronized System Simulation
[image:9.595.93.539.416.711.2]In un-synchronized system all the generators are working separately at different locations in UOG. There are four generators for seven academic blocks. First generator feds Engineering and Medical Block, second genera-tor feds Academic and Business Blocks, third generagenera-tor feds Science Block, while the fourth generagenera-tor feds P and BS Blocks. Real time readings of load in E-Tap were used to take the load flow calculation. E-Tap model for un-synchronized system and load flow report shown in Figure 3 and Figure 4respectively.
Figure 4. Load flow report.
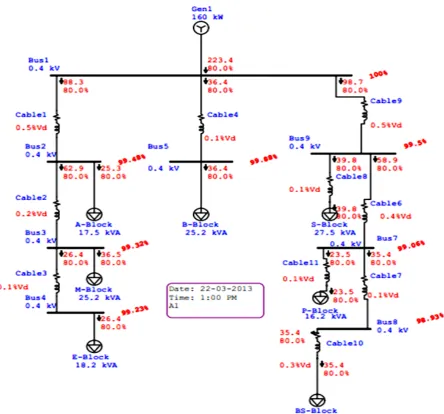
8.2. Synchronized System Simulation
In synchronized system which is the proposed solution, all the generators are connected in parallel and then load flow calculations are performed on this system. In this system all the generators give supply to a main bus bar, and then different cables execute from this bus bar and reach the academic blocks. The E-Tap models include two different schemes, i.e. once using aluminum conductor and once using copper conductor. E-Tap model & load flow report for aluminum and copper conductor have been shown in Figures 5-8.
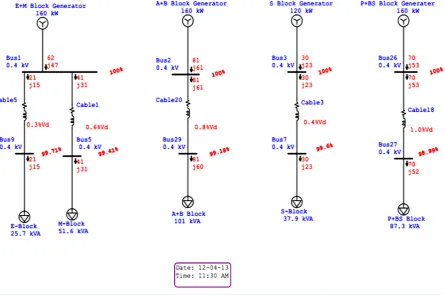
9. Synchronized Generator Operation
For this solution all the generators for the academic blocks have to be placed on one place then they will be synchronized through a synchronization panel. In this manner all the generators will supply power on a bus bar. Academic blocks will get supply from this common bus bar through cables of different gauge depending upon the respective load. Generators will get start according to the load demand, for example if load of all the blocks is 300 KVA, then only two generators of 200 KVA and 150 KVA will run to meet this demand. In this manner only two generators are required for the total demand instead of four generators as present. In winter season for reduced load only one generator is enough to meet the load demand. This solution will result in minimum cost.
The diagrammatic representation of our proposed solution is given inFigure 9. In this figure the cables which are shown in bold are pre-installed, while the cables shown in light lines are to be installed. The length and gauge of all the cables have been shown. Cable of gauge 400 mm2 which is to be installed has a length of 200 meters, while the cable of gauge 240 mm2 has a length of 135 meters.
9.1. Existing Equipments
1) Four Generators (200 kVA * 3 + 150 kVA * 1) = 750 KVA. 2) ATS switches.
Figure 5. E-TAP model with aluminum conductor.
9.2. Equipment Required for Proposed Solution
1) Synchronization panel.2) Cables of gauge 240 mm2 and 400 mm2 to be installed. 3) ATS switches.
4) Generators to be synchronized. 5) Main bus bar.
6) Circuit breakers.
9.3. Synchronization Panel
Figure 6. Load flow report with aluminum conductor.
nization Panel.
9.4. Cables Price & Length Calculation
For this solution proposed, there is requirement to install some new cables of different gauge at different loca-tions as shown in the Figure 9. Cables at some localoca-tions are already installed. The length, gauge and location for the new cables are shown in the Table 12.
For this solution, cables of two different gauges i.e. 240 mm2 and 400 mm2 have to be installed. The total length of 240 mm2 is 125 meters, which includes 33 meters from A Block to M Block and 92 meters from S Block to P Block. The total length of 400 mm2 is 195 meters which includes 105 meters from B Block to A Block and 90 meters from B Block to S Block. The cost comparison for these lengths of 3 & half core non-armored copper, aluminum and copper aluminum conductor given below in Tables 13-15.
9.5. Total Cost for the Solution
For the proposed solution we have to put all the generators at one place and then synchronize them through a synchronization panel. Then we have to install some cables that are mentioned above. The total cost comparison for this solution including panel and cable cost is given below in the Table 16.
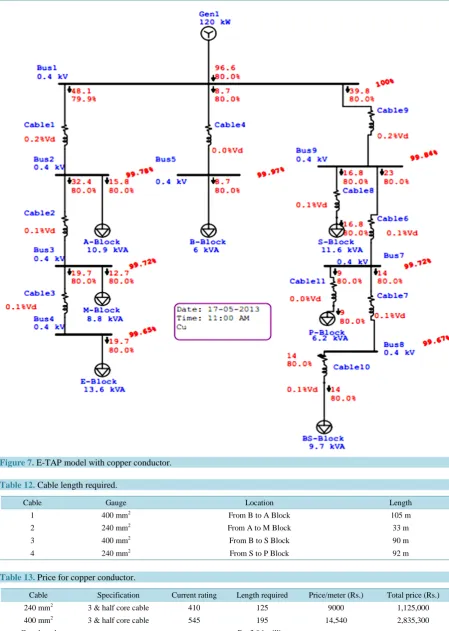
Figure 7. E-TAP model with copper conductor.
Table 12. Cable length required.
Cable Gauge Location Length
1 400 mm2 From B to A Block 105 m
2 240 mm2 From A to M Block 33 m
3 400 mm2 From B to S Block 90 m
[image:13.595.87.537.78.710.2]4 240 mm2 From S to P Block 92 m
Table 13. Price for copper conductor.
Cable Specification Current rating Length required Price/meter (Rs.) Total price (Rs.)
240 mm2 3 & half core cable 410 125 9000 1,125,000
400 mm2 3 & half core cable 545 195 14,540 2,835,300
Figure 8. Load flow report with copper conductor.
[image:14.595.143.481.451.702.2]9.6. Pay Back Period
As have been seen from the real time calculations that diesel cost can be save every month in a good manner. Adding all the diesel savings and approximated savings for coming months can be helpful to obtain the payback period. Total saving in current year have been shown in Table 17.
The approximated savings in the up-coming months are estimated below in Table 18.
It is clear from calculations that 18 months are required to compensate these costs. So if Synchronized net
Table 14. Price for aluminum conductor.
Cable Specification Current rating Length required Price/meter (Rs.) Total price (Rs.)
240 mm2 3 & half core cable 361 125 1470 183,750
400 mm2 3 and half core cable 490 195 2400 468,000
[image:15.595.86.544.183.722.2]Grand total Rs. 6.51 Lac
Table 15. Price for copper aluminum conductor.
Cable Conductor
type Length required
Cost/meter (Rs.)
Total price (Rs.)
400 mm2 Aluminum 125 2400 300,000
400 mm2 Copper 195 14,540 2,835,300
Grand total 3.13 million Rs.
Table 16. Total cost.
Cable Equipment Equipment price (Rs.) Grand total (Rs.)
1 Synchronization panel 1,000,000
Rs. 4.13 million
2 Cables 3,135,300
Table 17. Estimated savings.
Sr. # Saving in this month Grand total
March 441,575
Rs. 1.2 million
April 104,075
May 239,400
June 199,500
July 252,000
Table 18. Approximated savings.
Sr. # Savings Grand total
August (2013) 200,000
Rs. 3 million
September (2013) 250,000
October (2013) 300,000
November (2013) 300,000
December (2013) 300,000
January (2014) 300,000
February (2014) 300,000
March (2014) 300,000
April (2014) 100,000
May (2014) 200,000
June (2014) 100,000
July (2014) 200,000
[image:15.595.86.538.521.717.2]work is being installed in December 2013, the amount can be getting back in June 2015. Hence the payback period is approximately 18 months.
10. Conclusion
From the preceding analysis one can conclude that implementing parallel Synchronization technique can bring advantages in the form of power and cost saving. Total cost of the solution is 4.13 million and total annual ex-penses of old system is 3708100 Rs. Total approximated cost saving in 18 months is 4236550 Rs. with average monthly saving is 235363.9 Rs. Hence payback period of this solution is 18 months.
References
[1] http://kbreee.blogspot.com/2013/07/parallel-operation-of-two-alternators.html
[2] ADB (2010) Islamic Republic of Pakistan: Rental Power Review. Asian Development Bank. [3] Ahmad, M.B. (2010) Worsening Gas Crisis.
[4] Alternative Energy Development Board (2011) Power Sector Situation in Pakistan.
[5] Report Prepared by Alternative Energy Development Board in Collaboration with Deutsche Gesellschaftfür Tech-nische Zusammenarbelt (GTZ) GmbH, Islamabad.
[6] http://www.lesco.gov.pk/CustomerServices/3000063.asp
[7] http://www.usbr.gov/power/data/fist/fist1_4/vol1-4.pdf