An Adaptive Clustering Scheme for Mobile Ad-Hoc
Networks
Nayeema Sadeque
Institute for
Telecommunications Research
Adelaide, South Australia
Neva Agarwala
Electrical and Electronics
Engineering
Southeast University
Dhaka, Bangladesh
Mohammad Rashedul
Hasan
College of Computing and
Informatics
University of North Carolina,
Charlotte
ABSTRACT
While Mobile Ad-Hoc Networks (MANET) has many characteristics that are a challenge to manage, like bandwidth and power constraints, dynamic topology, etc adaptability is a key issue in the successful operation of a MANET. Unfortunately, this feature of MANET have not been investigated and optimized in great detail in the past. Hence, this provides an ideal opportunity and so forms the heart of this paper. It attempts to initiate such an adaptability study, by introducing a performance metric called Performance Factor (PF). The PF directly investigates the performance of a link by considering the bandwidth available to a link and distance between the Cluster head and the user node. An algorithm is proposed that utilizes this performance metric to ensure that all nodes receive optimum performance while ensuring an optimum number of clusters is maintained.
General Terms
Mobile Ad-hoc Networks, Clustering
Keywords
Clustering, MANET, Multi-hop, Performance Factor, Routing Protocols
1. INTRODUCTION
Ad-hoc networks are vastly becoming a lucrative research as well deployment issue since it can be setup as soon as it is needed. This is especially useful when the need of fast deployment of mobile users arises. Consequently, Mobile Ad-Hoc Networks (MANET) brings about numerous applications, such as emergency/rescue operations, disaster relief efforts, and military networks and all networks that do not rely on a centralized and organized connectivity [1, 2].
All MANETs have several prominent identifying characteristics such as dynamic topologies, bandwidth constraints, power constraints and limited security making this category of wireless networks a challenge to implement, manage and optimize.
Aside from designing algorithms that aim towards the ideal routing protocol, performance metrics can also be improved by utilizing the proper network topology. In this paper, we utilize hierarchical structure known as clustering and propose an adaptive algorithm that consistently provides a desired QoS to the participating nodes. Clustering selects a portion of nodes in a given area and constructs a control structure resembling a cellular structure. It involves portioning of the entire MANET into groups of nodes. Routing on top of clustered topologies provides increased scalability, reduced transmission overhead and reuse of resources. Nodes of non-
Neighboring disjoint clusters can use the same set of frequencies thus reusing resources and increasing system capacity. Disposability and accessibility is also increased as nodes belonging to the same cluster can also share other resources such as software, memory space, printers, etc. Additionally, reduced network state information need only to be kept and maintained by the cluster heads and not any nodes outside of the cluster.
With clustering providing some significant benefits, a new problem arises when we try to come up with simple but proficient algorithms to divide nodes into clusters. There are numerous ways of accomplishing this, but the different factors to consider can be overwhelming. Stability, load balancing, mobility, maximum cluster size, minimum number of clusters, variations in clusters, maximum number of hops to the cluster head, power control, bandwidth utilization and many more aspects needs to be optimized. Hence in the pool of clustering algorithms, each considers one or more of these aspects. All these algorithms focus on different problems and so they are suited to different environments and used for different applications. Examples include the Highest Connectivity clustering algorithm almost always ensures that the number of clusters formed is the minimum. The CLUSTERPOW algorithm uses power control to increase network capacity, decrease the contention of the link layer and save energy [3]. Bandwidth is another scarce resource that must be carefully managed in MANET. This was the focus of [4]. Here, in the Bandwidth Adaptive Clustering, bandwidth utilization is reduced and managed effectively by determining a forwarding probability based on the available bandwidth. Yet, another algorithm, which concentrates solely on minimizing the number of clusters have been proposed by Sheu and Wang in [5].
Most of these clustering approaches propose efficient algorithm for cluster formation and cluster maintenance. We will address the issue of adaptability with new nodes appearing or leaving the network. This feature is vital in the operation of a MANET and is also a measure of scalability of the network. Particular focus lies in how large as well as small number of new nodes are accommodated into the network, how the network will adapt to increasing number of node deaths and the issues that justifies the existence of a cluster.
2. THE PROPOSED ALGORITHM
2.1 Assumptions
The model assumed before designing the proposed algorithm has the following assumptions:
The network is assumed to be static and the average relative mobility is assumed to be 0. Hence mobility will not play a role in the algorithm and so a mobility model is not adopted.
New clusters need not be formed; the algorithm does not employ cluster splitting; only cluster merging is dealt with.
At several stages a predefined number of nodes are assumed to be in the network. Here the simulation usually begins with 20 nodes in the setup phase.
Area of Investigation equal to 10m x 10m.
All nodes that are active have packets to send.
Distances of nodes are used as a replacement fortransmission range. In real-life scenarios each node knows its transmission range and the use of GPRS is not needed.
2.2 Performance Factor (PF)
A metric has been devised based on which the algorithm is designed. The PF has been designed to monitor the QoS of a link. It comprises of the bandwidth available for the link and the distance between the node and its Clusterhead. Hence, the Performance Factor is a quantitative value that provides the quality of a link. Evidently, the higher the value of PF means the better the service.
From experience, it is understood that the higher the bandwidth the better the QoS. On the other hand, the lower the distance between the node and the Clusterhead results in a better QoS. Therefore, the Performance Factor can be deduced to be directly proportional to the bandwidth and inversely proportional to the distance. Hence,
Performance Factor (PF) = Baverage/Distance
where,
Baverage=Bavailable/number of nodes
The parameter Baverage is required because the bandwidth of a cluster is assumed to be assigned to the Clusterhead, since it is the Clusterhead that routes a packet from source to destination. Therefore, it is the Clusterhead that allocates the resources to each of its member nodes.
2.3 Description of the Proposed Algorithm
The proposed algorithm has been devised in the following three stages:
1. The Setup Phase describes the formation of the clusters.
2. Node Birth describes how the scheme adapts when new nodes joins the network.
3. Node Death describes how the scheme adapts when nodes leave the network.
2.3.1 The Setup Phase
The algorithm for the Setup Phase minimizes the number of clusters by electing those nodes having an optimum number of neighbors; this number is termed as D. The Setup Phase proceeds as follows:
All nodes transmit a HELLO packet with a Time to Live (TTL) value of 1. This HELLO packet will expire after traversing a distance of one-hop count, thus traveling to its immediate neighbors.
Upon receipt of these HELLO messages, nodes will reply with a HELLO_ACK packet.
By calculating the number of these packets received, a node can find the number of neighbors it has.
Nodes that determine its number of neighbors to be equal to D, will broadcast a CLUSTERHEAD(C_ID) packet. The Clusterhead ID is the same as the ID of the node.
Nodes receiving this packet can proceed to determine which Clusterhead to join with. They do so by calculating its distance from each of the Clusterhead.
The node joins with the Clusterhead that is closest to the node by sending a JOIN(N_ID) packet, registering with the Clusterhead, its ID.
The join is confirmed when the Clusterhead replies with a JOIN_ACK(C_ID, N_ID) packet. The C_ID, N_ID values are sent for verification purposes.
If the Clusterhead decides not to accept the node, it sends a JOIN_REJECT(C_ID, N_ID) packet. In such cases, the node will further attempt to join with the Clusterhead that is the next minimum distance away from it.
After this initiation, all Clusterheads determine the Performance Factor (PF) of each of its neighbors as outlined in Section 2.2.
The Clusterheads finally transmits the PF to its respective member nodes by sending a PERFORMANCE(C_ID, N_ID, PF). The nodes can now compare its received performance to its desired performance, if this facility is available at the user interface.
Thus, at the end of the Setup Phase, the appropriate Clusterhead have been decided, all nodes know which Clusterhead and ultimately which cluster it belong to, along with the level of performance it is going to receive.
2.3.2 Node Birth
After the Setup Phase, adaptability can now be modeled. As stated before, adaptability is investigated in terms of node birth and death in the system. The proposed algorithm adapts to node birth in the following ways:
The new nodes first send a broadcast packet SEARCH(N_ID) packet through the entire network.
Baverage=Bavailable/number of nodes already in the cluster
Performance Factor (PF) = Baverage/distance between the new node and the Clusterhead
Each of the new node attempts to join with the Clusterhead that offers the maximum PF by sending a JOIN (N_ID) packet.
The Clusterhead in turn replies with a JOIN_ACK(C_ID, N_ID) packet for confirmation or JOIN_REJECT(C_ID, N_ID), to reject the join operation.
In case of rejection, the node attempts to join with the Clusterhead that offers the next highest PF.
It is evident that with new nodes joining a cluster, the performance to previously existing nodes will be reduced, as the number of nodes increases. Hence, each Clusterhead should now recalculate the PF to all its member nodes according to the steps defined in Section 2.2.
It is seen that the add operation taking into account the bandwidth available to each Clusterhead as well as the distance, defines how new nodes should combine with the network.
2.3.3 Node Death
With the delete operation, the algorithm adapts to network dissolution. It specifically attends to two scenarios, by restricting the minimum cluster size, defined by MIN_SIZE. The deletion operation works as follows:
All nodes belonging to a cluster periodically transmit a HELLO message to its Clusterhead. This signifies that the member is existent in the cluster and receives service from its Clusterhead.
If a HELLO message is not received after the specific period of time expires, the Clusterhead assumes that the node has left the cluster and a node death has occurred.
The Clusterhead then determines whether the existence of the cluster is justifiable. It follows the following procedure:
If the number of nodes in the cluster is greater than MIN_SIZE, the Clusterhead simply recalculates the Performance Factor (PF) for the nodes that are left, since the number of nodes in the cluster has reduced.
If the number of nodes in the cluster is less than or equal to MIN_SIZE, the existence of this cluster is not justified and the following steps are followed. The algorithm corresponds to the one used in Section 2.3.1 and is outlined again for convenience:
Each of the remaining nodes sends a broadcast packet SEARCH(N_ID) packet through the entire network.
The other Clusterheads of the network replies sends a SEARCH_ACK(C_ID, PF). The PF in the SEARCH_ACK packet is calculated by each Clusterhead as follows:
Baverage=Bavailable/number of nodes already in the cluster
Performance Factor (PF) = Baverage/distance between the new node and the Clusterhead
Each of the remaining nodes attempts to join with the Clusterhead that offers the maximum PF by sending a JOIN (N_ID) packet.
The Clusterhead in turn replies with a JOIN_ACK(C_ID, N_ID) packet for confirmation or JOIN_REJECT(C_ID, N_ID), to reject the join operation.
In case of rejection, the node attempts to join with the Clusterhead that offers the next highest PF.
Finally, the Clusterhead with the new members recalculates the PF for each of its member nodes since the number of nodes in the cluster has increased.
The delete phase employs a minimum bound size to prevent too small clusters from occurring; otherwise bandwidth as well as other resources may be utilized inefficiently.
3. SIMULATION PARAMETERS
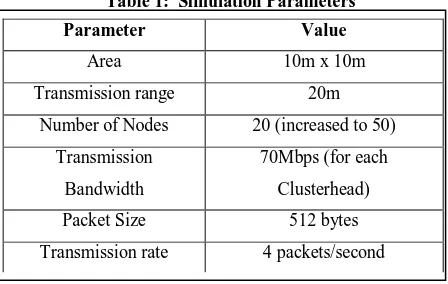
For implementation and obtaining the test data, several simulation parameters were used.
First of all, the initial number of nodes had to be specified and this was set to 20 nodes. Later as the investigation continued, the number of nodes was varied and the maximum number of nodes increased up to 50 nodes. Conversely, when the test data for the delete operation needed to be obtained, nodes were deleted in steps to a minimum of 35 nodes.
In the program as well as the algorithm, an one_hop count was used to determine the number of neighbors in each node. This hop_count is equivalent to the transmission range of the nodes whose average value is determined to be 20m, in an area of 10m x 10m.
The Performance Factor (PF) is comprised of the bandwidth available to a Cluster head. This bandwidth is assumed to be approximately 70Mbps to each Cluster head, with around 10Mbps allocated to each link, depending on the number of nodes in the cluster. The larger the number of nodes the less the bandwidth allocated to each link and therefore to each node. This value was chosen in accordance to the one used in [6].
A fixed simulation time was used so that the simulation mimics a more realistic scenario. It is assumed that between taking samples, the network is operating and packets are received and sent. Hence when taking a sample the bandwidth would have reduced and with a fixed simulation time, this varies only with the number of nodes in the cluster as follows:
Bused= 512(bytes/packet)*4(packets/s)*number of nodes in that cluster (1)
Bavailable= 70Mbps-Bused (2)
Where 512bytes is the average packet size and the 4 packets/second is the transmission rate [7].
Table 1: Simulation Parameters
4. PERFORMANCE ANALYSIS OF THE
PROPOSED ALGORITHM
A study was conducted on the proposed algorithm, to investigate its adaptability to node birth and node death. This investigation was done qualitatively, by examining how the Performance Factor (PF) varies with the three parameters. The following analyses were carried out:
Variation of Average Performance Factor (Avg PF) with the Number of Clusters
Variation of Total Performance Factor (TPF) with the Number of Nodes Births
Variation of Total Performance Factor (TPF) with the Number of Node Deaths (for Number of Node Deaths>MIN_SIZE)
Variation of Total Performance Factor (TPF) with the Number of Node Deaths (for Number of Node Deaths<=MIN_SIZE)
4.1 Variation of Average Performance Factor
(Avg PF) with the Number of Clusters
Test data were generated for fixed 20 nodes. A total of five samples were taken. Each time random nodes were generated and the number of clusters varied as a result. Depending on the number of clusters, the Performance Factor (PF) of each node, and hence each cluster also varied.
2 2.2 2.4 2.6 2.8 3 3.2 3.4 3.6 3.8 4 5
10 15 20
Number of clusters
A
v
e
ra
g
e
P
e
rf
o
rm
a
n
c
e
F
a
c
to
r
(A
v
g
-P
F
)
Variation of the Average Performance Factor (Avg PF) with the number of clusters (fixed at 20 nodes)
Figure1: Graph of Avg PF vs. Number of Clusters
As can be seen from Figure 1, Average Performance Factor (Avg PF) increases steeply as the number clusters increases. This is because an increased number of clusters contain a lesser number of nodes for a fixed number of nodes and a greater amount of Average Bandwidth is available to each node. However, in all cases too many cluster results in inefficient use of resources as small clusters will result. A tradeoff must be made.
4.2 Variation of Total Performance Factor
(TPF) with the Number of Nodes Births
5 10 15 20 25 30
15 16 17 18 19 20 21 22 23 24
Number of nodes added
T
o
ta
l
P
e
rf
o
rm
a
n
c
e
F
a
c
to
r
(T
P
F
)
[image:4.595.318.536.203.377.2]Variation of the Total Performance Factor (TPF) with the number of node births (Initial fixed at 20 nodes)
Figure 2: Graph of Total Performance Factor (TPF) vs.
Number of Node Births
Another relation that was investigated is the variation of the Performance Factor with the number of node births in the network. Although, it is evident that as more and more nodes join the network, the Performance Factor decreases, however, the analysis shows that the decrease is not steep. For a large number of nodes that join the network the aggregated PF does not significantly as shown in Figure 2.
The gradual decrease is of significant advantage provided by the algorithm as now more nodes can be accommodated into the network for a given PF. As before, the analysis is done on a network with an initial number of 20 nodes and incremented in steps of 5 nodes hereafter.
A critical evaluation of node deaths was carried out. Discussed before, a minimum cluster size is defined by using the variable MIN_SIZE. As nodes die, the Cluster head determined if the number of neighbors it has is equal to or less than MIN_SIZE. Depending on this value, two different approaches are adopted. One investigates and justifies the use of MIN_SIZE with node deaths and the other with node births. All analyses are based on the Performance Factor (PF).
4.3 Variation of Total Performance Factor
(TPF) with the Number of Node Deaths (for
Number of Node Deaths>MIN_SIZE)
As can be seen from Table 2, as the number of node deaths increases while remaining above MIN_SIZE, the PF rises significantly. This is because the number of nodes decreases while the numbers of clusters remain the same. It is deduced that such drastic increase in PF will result poor use of bandwidth, as now, too much bandwidth is now allocated to nodes that do not
Parameter Value
Area 10m x 10m
Transmission range 20m
Number of Nodes 20 (increased to 50)
Transmission
Bandwidth
70Mbps (for each
Clusterhead)
Packet Size 512 bytes
Transmission rate 4 packets/second
require such a high PF. It can be concluded that in such cases inefficient use of resources results.
Table 2: Variation of Total Performance Factor (TPF) with the Number of Node Deaths (for Number of Node Deaths>
MIN_SIZE)
4.4 Variation of Total Performance Factor
(TPF) with the Number of Node Deaths (for
Number of Node Deaths<=MIN_SIZE)
[image:5.595.56.291.153.389.2]In light of the hypothesis made above, it becomes necessary to investigate the variation of PF as node deaths decreases the cluster size to a value less than MIN_SIZE. This is done by reducing a specific cluster size to MIN_SIZE or below for varying number of initial nodes in the cluster. Hence, the initial cluster size was varied from 20 to 50 nodes and dissolution of a specific cluster was carried out after which the PF of the remaining clusters were determined. As seen from Table 3, as nodes from too small clusters join the remaining clusters, the PF of the remaining clusters decreases. However, unlike the preceding section, inefficient use of bandwidth does not take place here. This is an important aspect of the algorithm as ad-hoc networks by nature are extremely bandwidth constrained.
Table 3: Variation of Total Performance Factor (TPF) with the Number of Node Deaths (for Number of Node
Deaths<=MIN_SIZE)
1.
5.
DISCUSSIONS AND CONCLUSIONS
All through the algorithm description till the performance analysis, the concept of adaptability of the scheme to node births and deaths have been addressed and tackled. The simulation and analysis shows that this adaptive scheme effectively adjusts to varying number of nodes in the network by using a performance metric that comprises of the bandwidth available to a node and its distance from the Cluster head. The graphs and the tables in Section 4 are a proof of how an optimum performance can be received by the nodes as the network scales in size. As a result, the algorithm also provides a tradeoff between the Performance Factor (PF) available to the nodes and the use of bandwidth, a crucial resource of any ad-hoc network.
6.
FUTURE WORK
The concept of adaptability is a very important aspect of MANETs as well as other ad hoc networks and should be further explored. If adaptability can be efficiently tackled, it will provide with stronger grip on the randomness of MANETs, as a result of which the networks can be better managed. Even though, the proposed algorithm of this thesis effectively deals with the issue of adaptability, it can be enhanced to be more efficient. An important concern would be to design a scheme that decreases the performance factor after a small cluster joins its neighboring clusters, by an insignificant amount. Although merging to clusters prevents the misuse of bandwidth, a better trade off is needed so that PF of the existing cluster do not reduce drastically; in such cases, the users might experience undesired performance level. Hence, this leaves room for tackling such problems, which should be the focus of upcoming research.
7.
ACKNOWLEDGMENT
We would like to thank Mr. Rashedul Hasan for providing us with the opportunity to work on this project which was a great source to gain invaluable experience in MANETs as well as for his valuable time and advice during our project. The experience that we gathered is only possible due to his guidance and support.
8.
REFERENCES
[1] Abusalah, L. Khokhar, A. Guizani, M.,” A survey of secure mobile Ad Hoc routing protocols,” Univ. of Illinois at Chicago, Chicago, IL, USA, vol. 10, pp. 78-93, 2008.
[2] S.Mangai, A.Tamilarasi, “Evaluation of the Performance Metrics in Improved Location Aided Cluster based Routing Protocol for GPS Enabled MANETs,” European Journal of Scientific Research, Vol.46, , pp.296-308, 2010.
[3] R.Misra, C.R.Mandal, “Performance Comparison of AODV/DSR On Demand Routing Protocols for Ad Hoc Networks in Constrained Situation”, IEEE ICPWC, 2005.
[4] Project on Wireless Adhoc Networking and Clustering, http://www.cse.chalmers.se/~tsigas/Courses/DCDSeminar/ Files/adhocproject.pdf
[5] S. R. Das, R. Casta˜neda and J. Yan, R. Sengupta, “Comparative Performance Evaluation of Routing Protocols for Mobile, Ad hoc Networks,” LA , pp. 153- 161, October 1998.
[6] P. Basu, N. Khan and T.D.C Little, “A Mobility Based Metric for Clustering in Mobile Ad hoc Network,” Boston University, MCL Technical Report No. 01-15-2001.
Number of
Node Deaths Performance Factor (PF) Total PF
5 4.53 22.787
7.77
10.487
10 6.1 24.5818
8.2276
10.2542
13 4.891 26.53
8.249
13.39
15 4.62 28.24
10.02
13.6
Test Nodes Performance Factor (PF) Total PF
20 3.2537 8.7101
5.4564
30 3.7983 12.0493
8.251
40 3.551 11.533
7.982
[7] P. Chenna Reddy, Dr. P. Chandrasekhar Reddy, “Performance Analysis of Ad-hoc Routing protocols,” American Open Internet Journal, Vol. 17, 2006.
[8] B. Awerbuch et al., “An On-Demand Secure Routing Resilient to Byzantine Failures,” Proc. ACM Wksp. Wireless Security 2002, Sept. 2002, pp.21–30.
[9] B. Bhargava et al., “Trust, Privacy, and security. Summary of Workshop Breakout session,” NSF Information and
DATA Management (IDM) Wksp. held in Sept. 2003 in Seattle, Technical Report, CERIAS, Purdue University, West Lafayettte, IN, Dec. 2003.