Performance Evaluation of AQM Techniques in PIM-DM
Multicast Network for SRM Protocol
Shaveta
Dr. B R Ambedkar National Institute of Technology
Jalandhar Punjab, India
Harsh K Verma
Dr. B R Ambedkar National Institute of Technology
Jalandhar Punjab, India
Ashish Kumar
Dr. B R Ambedkar National Institute of Technology
Jalandhar Punjab, India
ABSTRACT
The focus of this work is to study the behavior of various queue management algorithms, including RED (Random Early Detection), RIO (RED IN/OUT), SRR, SFB (Stochastic Fair Blue) and BLUE. The performance metrics of the comparison are Throughput (Quantity of Service), end–to–end delay (Quality of Service) and drop of packets. The simulation is done using NS-2. In this paper we have illustrated the different behavior of RED, RIO, SFB, SRR and BLUE, which use the queue length as the indicator of the grimness of congestion. Thus SFB achieve significant better performance in terms of packet loss rates and throughput in the Network.
Keywords
Congestion Control, SRR, RED, RIO, BLUE, SFB, packet loss rates, buffer size, throughput.
1.
INTRODUCTION
As the usage of Internet increases, number of users increasing. It is important to adapt mechanisms which decrease packet loss. As a result, TCP (Transmission Control Protocol) congestion control has been used to control the rates of individual network links over the last decade. A solution for queue management is use of Drop Tail. However, current TCP still experiences high packet loss, even though it also uses other techniques such as congestion avoidance, slow start, fast retransmit and fast recovery mechanism. This leads the use of dynamic queue managements. A typical dynamic queue management is RED (Random Early Detection), which was recommended by the IETF for deployment in IP routers/networks and is supported by many routers. It is now widely believed that a RED-controlled queue performs better than a drop-tail queue. The probability is changed according the utilization ratio of the link. The simulation results show better performances on packet loss rate, delay and throughput. [1]
Multicasting is a widely used service in today’s computer networking system; it is mostly used in Streaming media, Internet television, video conferencing and net meeting etc. Routers involved in multicasting packets need a better management over stacking system of packets to be multicast [2].The paper is organized as follows. Section 2 describes system topology, multicasting, CM, DM, DVMRP and the descriptions of the different queue management algorithms like SRR, RED, RIO, SFB, and BLUE. Section 3 describes Simulation results.
2.
SYSTEM DESCRIPTION
2.1
Topology
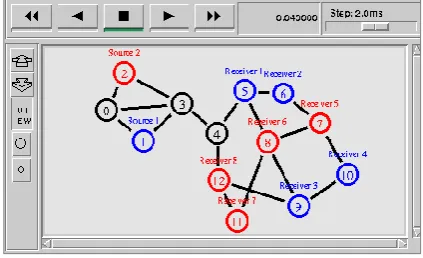
[image:1.595.322.534.436.565.2]A network of thirteen nodes is created with two senders and eight receivers. PGM and UDP are used as Transport layer protocols. PGM uses constant bit rate (CBR) traffic and UDP uses Pareto traffic. There are two sources i.e. senders; Node 1 and Node 2 in the network. Node 5, 6, 7, 8, 9, 10, 11 and 12 are the receiver nodes in the group communication. Node 5, 6, 9 and 10 are PGM receivers and node 7, 8, 11 and 12 are UDP receivers. Bandwidth is 1.544Mbps between node (3 – 4), 1 Mbps between node (2 – 3) and node (1 – 3), and all other links have a bandwidth of 2Mbps. The delay of link between nodes (3 – 4) is 20ms and 10ms for all the other links. Node 1 and node 2 starts transmission at 0.4s and 0.0s respectively; receiver nodes 5, 6, 9 and 10 will be effective at 0.5s, 0.9s, 0.0s, and 2.0s respectively; node 7, 8, 11 and 12 will be effective at 0.3s, 0.5s, 1.0s, and 0.0s respectively.
Fig 1: Topology Design
#Topology
$ns duplex-link $n7 $n8 2Mb 10ms DropTail $ns duplex-link $n7 $n10 2Mb 10ms DropTail $ns duplex-link $n8 $n9 2Mb 10ms DropTail $ns duplex-link $n9 $n10 2Mb 10ms DropTail $ns duplex-link $n11 $n8 2Mb 10ms DropTail $ns duplex-link $n11 $n12 2Mb 10ms DropTail $ns duplex-link $n12 $n9 2Mb 10ms DropTail $ns duplex-link $n12 $n4 2Mb 10ms DropTail
# Group Events
$ns at 0.5 "$n5 join-group $srm1 $group1" $ns at 0.9 "$n6 join-group $srm2 $group1" $ns at 2.0 "$n10 join-group $srm3 $group1" $ns at 9.0 "$n5 leave-group $srm1 $group1" $ns at 8.7 "$n6 leave-group $srm2 $group1" $ns at 9.5 "$n10 leave-group $srm3 $group1" $ns at 9.6 "$n9 leave-group $srmsink0 $group1" $ns at 0.3 "$n7 join-group $udp1 $group2" $ns at 0.5 "$n8 join-group $udp2 $group2" $ns at 1.0 "$n11 join-group $udp3 $group2" $ns at 8.0 "$n7 leave-group $udp1 $group2" $ns at 8.0 "$n8 leave-group $udp2 $group2" $ns at 9.5 "$n11 leave-group $udp3 $group2" $ns at 0.0 "$n12 join-group $udpsink0 $group2" $ns at 9.7 "$n12 leave-group $udpsink0 $group2"
Node 5, 6 and 10 will leave the group communication at 9.0s, 8.7s and 9.5s respectively whereas node 9 stays active throughout the communication period as PGM receiver. Node 7, 8 and 11 will leave the group communication at 8.0s, 8.0s and 9.5s respectively but node 12 stays active throughout the communication period as UDP receiver. Data rate for both senders is 832Kb. Queuing technique used on all the link except (3 – 4) is Drop Tail. The network is simulated for 10s.
2.2
PIM-DM (Dense Mode)
The Dense Mode protocol is an implementation of a dense-mode-like protocol. Depending on the value of DM class variable CacheMissMode it can run in one of two modes[3]. If CacheMissMode is set to PIM-DM (default), PIM-DM forwarding rules will be used. It assumes that when a source starts sending datagrams, members in the network want to receive multicast datagram’s. At the beginning multicast datagram’s are flooded to whole network. PIM-DM uses RPF (Reverse path forwarding) to prevent looping of multicast datagram’s while flooding and if some areas of the network do not have group members, PIM-DM will prune off the forwarding branch by detecting prune state.
The prune message has a life time set with it. Once the lifetime expires, multicast datagram will be forwarded again to the previously removed/pruned branches. Graft messages are used when a new member for a group appears in a pruned area. The router sends a graft message towards the source for the group to turn the pruned branch back into a forwarding branch for broadcast messages.
The method of enabling centralized multicast routing in a simulation is:
set mproto DM
set mrthandle [$ns mrtproto $mproto {}] set group1 [Node allocaddr]
set group2 [Node allocaddr]
2.3
SRM (Scalable Reliable Multicast)
Scalable Reliable Multicast [4] protocol which solves the buffer management problem, by spreading the required packets between the repair node and some selected receivers which already received these packets. This spreading
decreases the number of packets saved in the buffer of the repair node, thereby solves the congestion problem and increases the network throughput, the suggested method reduces the overhead in repair node by easing the burden of retransmit lost packets among the selective receivers, thereby increases the number of receivers that can be served by the repair node, which increases the scalability.
# SRM Agent
set srm0 [new Agent/SRM] $srm0 set dst_addr_ $group1 $srm0 set fid_ 1
$ns attach-agent $n1 $srm0
# Create a CBR traffic source set cbr0 [new Application/Traffic/CBR] $cbr0 attach-agent $srm0
$cbr0 set fid_ 1 set packetSize 210
$cbr0 set packetSize_ $packetSize $cbr0 set burst_time_ 500ms $cbr0 set idle_time_ 500ms $cbr0 set rate_ 832kb $srm0 set tg_ $cbr0 $srm0 set app_fid_ 0
$srm0 set packetSize_ $packetSize
3.
QUEUE MANAGEMENT
ALGORITHMS
In this section, we focus on SRR, RED, RIO, BLUE and SFB, and briefly explain them in each of the sub section. The main idea of this work is to compare these typical dynamic queuing algorithms instead of exhaustively reviewing the existing ones. This will be used in performance comparison.
3.1
RED
The RED algorithm [5] detects congestion in the buffer and measures the traffic load in the queue using the average queue size avg. This is calculated by using an exponentially weighted moving average filter and can be expressed as
avg ¨ (1 – wq) ◊ avg + wq ◊ q,
where wq is filter weight. When the average queue size is smaller than a minimum threshold minth, zero packets are dropped. When the average queue size transcend the minimum threshold, the router randomly drops arriving packets with a given drop probability. The probability that a packet arriving at the queue is dropped depends on the average queue length, the time elapsed since the last packet was dropped, and the maximum drop probability parameter maxp. If the average queue size is larger than a maximum threshold maxth, all arriving packets are dropped. It is shown in [6] that the average queue length avg increases with the number of active connections N (actually proportional to N2/3) in the system until maxth is reached when all incoming packets are dropped. We also observe that there is always an N where maxth will be transcended. Since most existing routers operate with limited amounts of buffering, maxth is small and can easily be transcended even with small N. Dropping of all incoming packets may turn out in global synchronization, which is usually followed by a sustained period of low link utilization.
3.2
RIO
combination of two RED algorithms for in and out with different dropping frequencies, which is given to one group of packets according to preference. For OUT packets, if average queue size is less than minth_out zero packets will be dropped. If the average queue size exceeds this, arriving packets are dropped with a probability that increases it linearly from 0 to maxp_out. If the average queue size exceeds maxth_out, all OUT packets are dropped. Note that the average queue size is based on the total number of packets in the queue, regardless of their marking. For IN packets, the average queue size is based on the number of IN packets present in the queue and the parameters are set differently in orders to start dropping OUTs well before any INs are discarded. If we choose proper parameters for IN and OUT, traffic can be controlled before the queue reaches to the point that any "in" traffic is dropped.
3.3
SFB
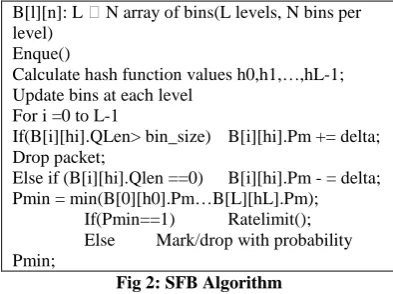
Based on BLUE, Stochastic Fair Blue (SFB) [8] is a new technique that shields TCP flows against non-responsive flows. SFB is a FIFO queuing algorithm that identifies and rate-limits non-responsive flows based on accounting mechanisms similar to those used with BLUE. SFB maintains accounting bins. The bins are organized in L levels with N bins in each level. In addition, SFB maintains L independent hash functions, each associated with one level of the accounting bins. Each hash function maps a flow into one of the accounting bins in that level. The accounting bins are used to keep track of queue occupancy statistics of packets belonging to a particular bin. As a packet arrives at the queue, it is hashed into one of the N bins in each of the L levels. If the number of packets mapped to a bin goes above a certain threshold (i.e., the size of the bin), the packet dropping probability Pm for that bin is increased. If the number of packets in that bin drops to zero, Pm is decreased. The observation is that a non-responsive flow quickly drives Pm to 1 in all of the L bins it is hashed into. Responsive flows may share one or two bins with non-responsive flows, however, unless the number of non-responsive flows is extremely large compared to the number of bins, a responsive flow is likely to be hashed into at least one bin that is not polluted with non-responsive flows and thus has a normal value. The decision to mark a packet is based on Pmin the minimum Pm value of all bins to which the flow is mapped into. If Pmin is 1, the packet is identified as belonging to a non-responsive flow and is then rate-limited.
B[l][n]: L N array of bins(L levels, N bins per level)
Enque()
Calculate hash function values h0,h1,…,hL-1; Update bins at each level
For i =0 to L-1
If(B[i][hi].QLen> bin_size) B[i][hi].Pm += delta; Drop packet;
Else if (B[i][hi].Qlen ==0) B[i][hi].Pm - = delta; Pmin = min(B[0][h0].Pm…B[L][hL].Pm);
[image:3.595.316.542.392.462.2]If(Pmin==1) Ratelimit(); Else Mark/drop with probability Pmin;
Fig 2: SFB Algorithm
The typical parameters of SFB algorithm are QLen, Bin_Size, d1, d2, freeze_time, N, L, Boxtime, Hinterval. Bin_Size is the buffer space of each bin. Qlen is the actual queue length of each bin. For each bin, d1, d2 and freeze_time have the same meaning as that in BLUE. Besides, N and L are related to the size of the accounting bins, for the bins are organized in L
levels with N bins in each level. Boxtime is used by penalty box of SFB as a time interval used to control how much bandwidth those non-responsive flows could take from bottleneck links. Hinterval is the time interval used to change hashing functions in our implementation for the double buffered moving hashing. Based on those parameters, the basic SFB queue management algorithm is shown in the above table.
3.4
BLUE
BLUE is an active queue management algorithm control by packet loss and link utilization history instead of queue occupancy. BLUE maintains a single probability, Pm, to mark (or drop) packets. If the queue is continually dropping packets due to buffer overflow, BLUE increases Pm, thus increasing the rate at which it sends back congestion notification or dropping packets. Conversely, if the queue becomes empty or if the link is idle, BLUE decreases its marking probability. This effectively allows BLUE to “learn” the correct rate it needs to send back congestion notification or dropping packets.
The typical parameters of BLUE are d1, d2, and freeze_time. d1determines the amount by which Pm is increased when the queue overflows, while d2 determines the amount by which Pm is decreased when the link is idle. freeze_time is an important parameter that determines the minimum time interval between two successive updates of Pm. This allows the changes in the marking probability to take effect before the value is updated again. Based on those parameters. The basic blue algorithms can be summarized as following: [9]
Upon link idle event: if
((now-last_update)>freeze_time) Pm = Pm-d2; Last_update = now;
Upon packet loss event: if ((now–
last_updatte)>freeze_time) Pm = Pm+d1; last_update = now;
Fig 3: BLUE Algorithm
3.5
SRR
Smoothed Round Robin, or SRR, is a work-conserving packet scheduling algorithm that attempts to provide maximum fairness while maintaining only O (1) time complexity [10].
In SRR two novel data structures, the weightmatrix (WM) and the weight spread sequence (WSS) are introduced to lessen the problems of packet burstiness and fairness associated to ordinary RR-based schedulers with large number of sessions. The WM stores the bitwise weight representation associated to each backlogged session while the WSS provides the sequence order of sessions to service. For each x in the WSS visit the xth column of WM in a top-to-bottom manner and service the session containing the element 1. At the termination of WSS, repeat the servicing procedure by beginning with the first element of WSS. Since the WSS is predefined before any packet selection is made, only a constant time operation is required to obtain the next value from WSS. This gives SRR its O (1) time complexity [11].
4.
SIMULATION RESULTS
The bottle neck link (3 – 4) is configured with one of the five queuing protocols discussed above each time. There are three parameters used for comparison; Throughput, Drop of Packets and End to End Delay.
4.1
Throughput
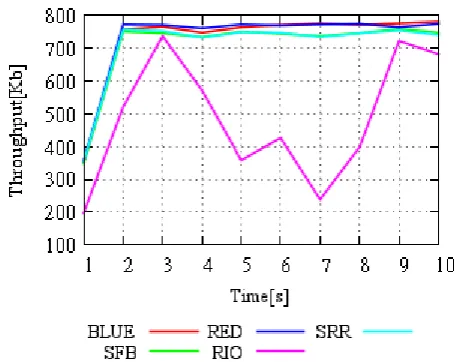
[image:3.595.67.264.553.700.2]728.952Kb/s whereas maximum throughput in case of RED queuing technique is 774.48Kb/s. RIO queuing algorithm provides minimum average throughput of 485.184K/s. 781.2Kb/s is the maximum throughput value in case of Blue algorithm, 737.52Kb/s in case of RIO and 759.36Kb/s in case of SFB, and 757.68Kb/s in SRR queuing algorithm. We can analyze from that all the algorithms initially start with lesser throughput of about 350Kb/s. The required throughput is 832Kb/s which is closely achieved in case of RED queuing algorithm.
Fig 4: Throughput of bottleneck link (3–4) for CBR Traffic
Figure 5 show the throughput graph for Pareto traffic of link (3 – 4). SRR provides average maximum throughput of 765.912Kb/s whereas maximum throughput in case of SRR queuing technique is 811.44Kb/s. RIO queuing algorithm provides minimum average throughput of 477.792K/s. 796.32Kb/s is the maximum throughput value in case of Blue algorithm, 641.76Kb/s in case of RIO and 804.72Kb/s in case of SFB, and 781.2Kb/s in RED queuing algorithm. We can analyze from that all the algorithms initially start with lesser throughput of about 450Kb/s. The required throughput is 832Kb/s which can be closely achieved by SRR queuing algorithm.
Fig 5: Throughput of bottleneck link (3–4) for Pareto Traffic
4.2
Drop of Packets
[image:4.595.321.542.156.299.2]Figure 6 shows For CBR Traffic Maximum Drop of packets is 482 given by SFB queuing algorithm while Minimum Drop of packets is 337 by RED. For Pareto Traffic Maximum Drop of Packets is 305 for BLUE while Minimum Drop of Packets is 179 for RIO and SRR. RED and BLUE drops significantly same amount of Packets for CBR and Pareto Traffic.
Fig 6: Number of Dropped packets at Node 3
4.3
End to End Delay
[image:4.595.55.283.188.369.2]Figure 7 shows the end to end delay graph for CBR and Pareto Traffic. Graph has been plotted against Type of Traffic on x-axis and average end to end Delay on y-axis.RIO shows maximum average end to end delay for CBR and Pareto i.e. 0.108456s and 0.095924s respectively. SFB shows minimum average end to end delay for CBR and Pareto Traffic i.e. 0.062226s and 0.050322s respectively.
Fig 7: Average end-to-end delay for PGM and Pareto traffic
Table 1 shows the average end to end delay for BLUE, RED, RIO, SFB and SRR queuing algorithms.
Table 1. Average end-to-end delay for PGM and Pareto
AQM Delay(s)
CBR(Node 9) PARETO(Node 12)
BLUE 0.103248 0.090909
RED 0.070354 0.058474
RIO 0.108456 0.095924
SFB 0.062226 0.050322
[image:4.595.322.541.422.566.2] [image:4.595.55.282.547.725.2] [image:4.595.325.539.641.762.2]5.
CONCLUSIONS
We have compared the performance of BLUE, RED, RIO, SFB and SRR with a standard parameter setting such as bandwidth for source to receiver link is 1.544 Mb/s. Performance metrics are Throughput, average queuing delay and the Packet Drop.
Our main findings are:
RED provides maximum throughput for CBR traffic while SRR provides maximum traffic for Pareto Traffic.
RIO and SRR shows significantly lesser number of Drop of Packets for Pareto Traffic while RED shows minimum Drop of Packets for CBR Traffic. These AQM techniques are best suited because users are sensitive for delay.
SFB shows minimum average end to end Delay for CBR and Pareto Traffic.
SRR shows maximum throughput and minimum number of packet drops for Pareto Traffic and RED shows maximum throughput and minimum number of drops for Pareto Traffic.
SRR and RED show significantly better performance above all other AQM techniques in case of DM-SRM multicast network.
6.
REFERENCES
[1] Mengke Li, Huili Wang, Computer Science and Engineering, “Study of Active Queue Management Algorithms----Towards stabilize and high link utilization” in Communications Magazine, IEEE, June 2002.
[2] Ashish Kumar, Ajay K Sharma, Arun Singh, “Performance Evaluation of Centralized Multicasting Network over ICMP Ping Flood for DDoS,” International Journal of Computer Applications (0975 – 8887) Volume 37– No.10, January 2011.
[3] Ashish Kumar, Ajay K Sharma, Arun Singh “Comparison and Analysis of PIM-DM and BST
Multicasting Network over Drop Tail Queuing Technology”, International Journal of Computer Applications (0975 – 8887) Volume 22– No.6, May 2011.
[4] Adznan b. Jantan, Sakher A. Hatem, Ali Alsayh, Sabira Khatun, Mohd. Fadlee, A.Rasid “A New Scalable Reliable Multicast Transport Protocol Using Perfect Buffer Management” Department of Computer and Communication Engineering, UPM, Malaysia Faculty of Computer Science, Sana’a University.
[5] S. Floyd and V. Jacobson, “Random Early Detection Gateways for Congestion Avoidance,” IEEE/ACM Trans. Net., vol. 1, no. 4, Aug. 1993, pp. 397–413.
[6] R. Morris, “Scalable TCP Congestion Control,” Proc. IEEE INFOCOM 2000, Tel Aviv, Israel, Mar. 26–30, 2000, pp.1176–83.
[7] “Recommendations on Queue Management and Congestion Avoidance in the Internet” http://tools.ietf.org/html/draft-ibanez-diffserv-assured-eval-00.
[8] Wu-chang Feng Dilip D. Kandlur Debanjan Saha Kang G. Shin “Stochastic Fair Blue: A Queue Management Algorithm for Enforcing Fairness”.
[9] “The BLUE Active Queue Management Algorithms” Wu-chang Feng, Kang G. Shin, Fellow, IEEE, Dilip D. Kandlur, Member, IEEE, and Debanjan Saha, Member, IEEE
[10] “The Smoothed Round-Robin Scheduler Paul” Southerington, Member, IEEE.