71
A Qualitative and Quantitative Frame Work for
effective Website Design
G. Sreedhar
1Sr. Lecturer
Dept. of Computer Science
Rashtriya Sanskrit Vidyapeetha
(Deemed University)
Tirupati
Dr. A.A. Chari
2Professor
Dept. of OR & SQC
Rayalaseema University
Kurnool
Dr.V.V.Venkata Ramana
3Scientist-E
National Informatics Centre
Hyderabad
Abstract:
The primary goal of this paper is to investigate various elements of website and evaluate quality of website design. The quality of website depends on various components such as download time, website size, broken links and website structure. The quality of website structure is based on its navigability, average number of clicks and structural complexity. Different kinds of tools are used to examine the components of website. These tools include: W3C Link Checker, W3C Markup Validation Service, Webpage Analyzer and Website Extractor. The W3C Link checker accepts URL address of Web page and parses each and every hyperlink to find broken links in the page. The W3C Markup Validation Service finds the errors regarding HTML tags’, usage errors, properties of Web page and standards of the Web page mentioned by W3C Consortium. The errors of each web site are grouped into major and minor errors. A set of qualitative measures are identified based on these errors. The web tool PowerMapper is used to establish the sitemap for the website and path length metric is used to evaluate average number of clicks to get desired web page and web site structural complexity is determined with cyclomatic complexity. The quality of website design is measured in 10-point scale and the value suggests the improvement of the site design.Key words:major errors, minor errors, qualitative measures, website structure and navigability
1. INTRODUCTION
A Website is a collection of Web pages containing text, images, audio and video etc. Thus Web is a vast collection of completely uncontrolled documents. Today, Web is not only an information resource but also becoming an automated tool in various applications. Due to the increasing popularity of Web, one can be very cautious in designing the Website. Poor and careless web design leads to hard ship to public utility and does not serve the purpose. To design a Website with high quality, one has to follow certain guidelines for achieving the quality Web design.
Despite of many recommendations, ideas and guidelines, designing a quality Website is still burning problem. It [1] [2] is suggested that always Web design is continuous process. The authors Flanders, Vincent and Michel Wills [1] insist that always design should be improved into good by looking from a bad design. Navigation plays a crucial role in the design of website structure
because it determines the path to be traveled to reach a required web page. Normally a website structure resembles tree like structure starting from home page as root. The home page of website must be designed in such a way that it should not be too much crowded with links and also not be too much empty. It was stated that number of links on each page should not exceed 20 [3] and average number of clicks should not be more than 4 clicks to get a required page. Thus in this paper it is attempted to find various qualitative measures for various elements of website design.
2. RELATED WORK.
The quality of website can be assessed mainly in functionality and usability. World Wide Web Consortium (W3C) [11] defines a set of guidelines for quality of Web design. Every guideline provides a technique for accessing the content of Website. The qualitative measures [4], [5] are used to achieve quality in functionality of website. The notion of usability is a key factor to interact a website. The efficiency of usability is depended on website structure. The structure of website [6] should be in such a way that user can easily interact website without any formal training. An effective web design [7] is one that makes it easier for users to navigate through the different pages on the site. The website structure [8] is represented by directed graph where each node represents a web page and edges represent link to corresponding web pages. It is already investigated that web link structure can also be used for page ranking [9] and web page classification [10]. These works stress on the navigational relationship among web pages. The present work focuses on discovering key elements to affect quality website design.
3. METHODOLOGY
72
3.1
Extracting components of web
All the components of website are extracted using a web tool viz., Website Extractor [12]. In the web program, a web tool namely Web Page Analyzer [13] finds the number of objects used in each web page, web page size and download time of all objects. It accepts URL address of each web page and generates a report containing details like number of image files, number of HTML files, number of script files and their download time of each web page.
3.2 W3C Markup Validation Service
A web tool i.e., W3C Markup Validation Service [14] finds the errors related to the HTML pages. It validates the web page regarding errors in HTML tags, properties of web page and standards of web page mentioned by W3C organization and all errors and their details are stored in files.
3.3 Identifying Broken Links
All the broken links and error links are identified in a web program using a web tool namely W3C Link Checker [15]. It accepts the URL address of web program and parses each and every hyperlink in the website. It finds the status code of each link and based on it generates a report about broken links. All broken link errors are stored in files for further usage in the study.
3.4 Creating Site Map
Every website must have sitemap to know the organization of web pages in the website structure. The sitemap shows all web pages in a hierarchical tree with home page as root of the tree. A web tool PowerMapper is used in the web program to construct a sitemap for the website. It selects URL address of website and generates the tree structure for all web pages of website. In this process only markup files (html, asp, php, xml, etc.,) are considered and remaining components like graphic files script files, etc., are not included because these files do not have any significance in website structure. The sitemap of a website may be organized into various levels depending on its
design. Some websites have one or two levels and some may have three or more levels.
3.5 Calculating Structural Complexity
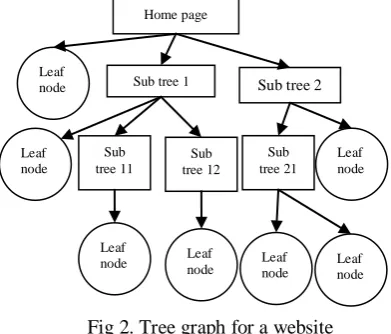
The structural complexity of website is determined with Mc. Cab’s cyclomatic complexity metric [16]. This metric is used to know navigation path for a desired web page. The cyclomatic complexity metric is derived in graph theory as follows. A tree graph is constructed with home page as root. The tree consists of various sub trees and leaf nodes. An example tree is shown in figure 2. A tree graph is constructed for a website by considering various hyperlinks in the website. Each sub tree of the graph represents a web page which has further hyperlinks to the next web pages and leaf node represent a web page which do not have any further links to the web pages.
In tree graph, at each level all web pages that do not have further links are represented with one leaf node at that level and a sub tree at each level consists of links to the web pages to the next level. The structural complexity is computed using cyclomatic complexity and it is calculated using equation (1). According McCabe value of Cyclomatic Complexity Metric (CCMetric) should not exceed 10.
CC
Metric= (e-n+d+1)/n
(1)
Where
e is the number of web page links,
n is the number of nodes in the graph d is the number of leaf nodes in the graph.The structural complexity also depends on average number of clicks per page and broken link errors involved in website
3.5.1 Evaluating Path length metric
A path length is used to find average number of clicks per page. The path length of the tree is the sum of the depths of all nodes in the tree. It can be computed as a weighted sum, weighting each level with its number of nodes or each node by its level using equation (2). The average number of clicks (AvgClicks) is computed using equation (3). The
Home page
Sub tree 11
Sub tree 12
Sub tree 2
Sub tree 21 Sub tree 1
Leaf node Leaf node Leaf node Leaf
node Leaf node Leaf
node Leaf
[image:2.595.91.292.69.265.2]node
Fig 2. Tree graph for a website
Web Tools Web Program Website extracto r HTML validati on Link checker Creating a sitemap Structur al complex ity Web Pages HTML errors Broke n links
[image:2.595.319.515.268.435.2]Sitemap Cyclomatic complexity
73
width of a tree is the size of its largest level and the height of a tree is the length of its longest root path.
Path length = ∑ l
i.m
i(2)
AvgClicks = path length/n (3)
Where
l
iis the level number
m
iis the number of nodes at level l
in is the number of nodes in the tree.
An example tree is shown in figure 1.
Path length = 0*1 + 1*3 + 2*3 + 3*6 = 27
AvgClicks = 27/13 = 2.07
3.5.2. Broken link calculation
In a website structure, navigation problem raised due to broken links. The broken link may involve at various levels of web site structure. Broken links are identified in sitemap by the PowerMapper web tool. In a sitemap of website, broken links are counted at various levels and broken error index is calculated based on percentage of broken links involved in sitemap tree. The percentage of broken links is calculated using equation (4).
Percentage of Broken links (PBL)
= (number of broken links / number of web
pages)* 100
(4)
4. EVALUATION
The websites of 10 Indian universities and approximately 1000 web pages are considered in the evaluation process. The Web program consists of various web tools was used to study each university’s Website and all components of universities’ websites are shown in table 1. The Web page errors that are generated using Web program are considered to identify the measures for quality of Website design. These errors are further divided into major and minor errors using statistical techniques.
4.1 Major Errors
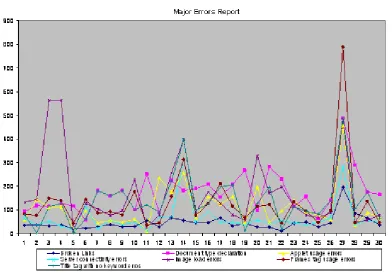
The major errors directly affect the quality of Web site design and developers must concentrate on this category of errors and these should be eliminated. The major errors include: broken links,
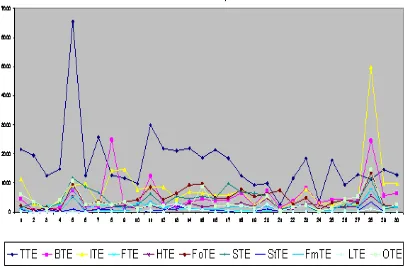
document type declaration errors, applet usage errors, server connectivity errors, image load errors, frames tag usage errors and title tag with no keyword errors. The major errors are proportional to the down load time of the Web pages. If major errors are minimized then down load time will be automatically reduced and hence it leads to the better quality. The figure 4 shows the graph that depicts different major errors and their effect on Website design.
4.2 Minor Errors
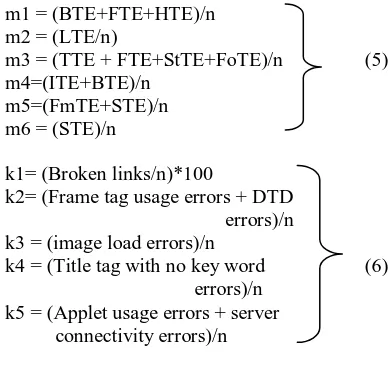
The minor errors are HTML tag errors and these may cause incorrect display of some components of Web pages. The minor errors include: table tag errors, body tag errors, image tag errors, head tag errors, font tag errors, script tag errors, style tag errors, form tag errors, link tag errors and other tag errors. The developers must be attentive so that Web pages can be properly designed with appropriate HTML tags. The graph in figure 5 shows various minor errors of various universities’ Websites. The errors that are found in Websites’ of various universities lead to the necessity of qualitative measures for effective Website design. The head tag errors (HTE), font tag errors (FoTE) and body tag errors (BTE) identify the problems in the text elements of we page. Thus Text formatting measures are to be evaluated. The image tag error (ITE), body tag errors (BTE) and image load errors related to image identifies the errors in display of images and hence Graphic element measures to be evaluated. The table tag errors (TTE), frame tag errors (FTE), style tag errors (StTE), font tag errors (FoTE), frame tag usage errors and document type declaration errors cause the invention of page formatting measures. Link Tag Errors (LTE) and broken links identify the need of link formatting measures. The form tag errors (FmTE), script tag errors (STE) and title tag with no keyword errors identify the need of page performance measure. The script tag errors (STE), applet usage errors, server connectivity errors, down load time of Website and broken link errors contribute the need of Website architecture measure. All these measures are shown in table 2. Each qualitative measure is evaluated based on 10-point scale. Formula for each measure is determined based on consideration of minor and major errors and each formula is shown in table 3.
m1 = (BTE+FTE+HTE)/n
m2 = (LTE/n)
m3 = (TTE + FTE+StTE+FoTE)/n
(5)
m4=(ITE+BTE)/n
m5=(FmTE+STE)/n
m6 = (STE)/n
k1= (Broken links/n)*100
k2= (Frame tag usage errors + DTD
errors)/n
k3 = (image load errors)/n
k4 = (Title tag with no key word
(6)
errors)/n
[image:3.595.313.507.594.777.2]k5 = (Applet usage errors + server
connectivity errors)/n
Figure 3. A tree with 3 levels
Level 0
Level 1
Level 2
74
where n is number of web pages in a website. Each qualitative measure is evaluated using equations (5) and (6) in 10-point scale. The value 0 indicates lowest value and value 10 indicates the highest value in the scale. The qualitative measure the value 10 in the 10-point scale indicates maximum quality of the website design and the value 0 indicates the very low quality website design. The 10-point scale value description is shown in table 3.
Table 4 shows the values of various qualitative measures in the scale for various universities’ web sites in India.
The web program accepts address of each university’s website and generates sitemap using PowerMapper web tool. The sitemap consists of all web pages of the website and displays in hierarchical tree structure in various levels. The average number of clicks needed to access a web page is computed with path length metric using equation (1) and (2). The cyclomatic complexity value is computed for the web site structure using equation (3). The percentage of broken links is calculated at each level in the sitemap using equation (4).
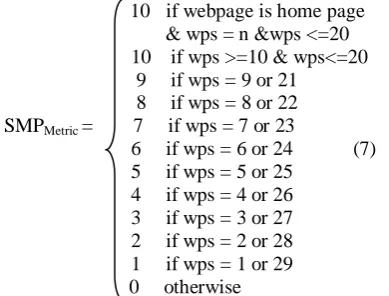
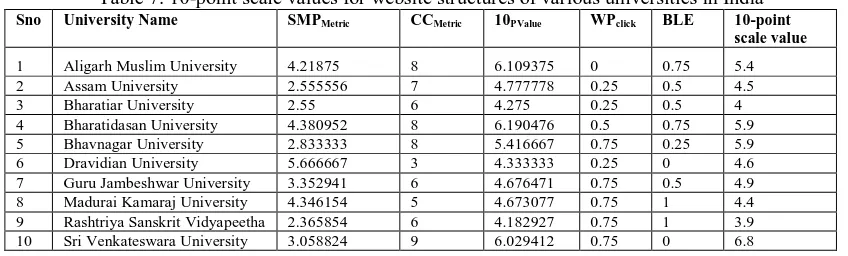
The quality of website structure for each university is evaluated in 10-point scale. The 10-point scale value for each university is based on organization of web pages in sitemap structure, cyclomatic complexity of website, average number of clicks and broken link error index. The 10-point scale value for sitemap structure is evaluated using SMPMetric shown in equation (7).
10
if webpage is home page
& wps = n &wps <=20
10 if wps >=10 & wps<=20
9 if wps = 9 or 21
8 if wps = 8 or 22
SMP
Metric= 7 if wps = 7 or 23
6 if wps = 6 or 24 (7)
5 if wps = 5 or 25
4 if wps = 4 or 26
3 if wps = 3 or 27
2 if wps = 2 or 28
1 if wps = 1 or 29
0 otherwise
Where wps is the number of web page links in a sub tree of sitemap. The 10-point scale value for structural complexity of website is calculated using equation (8) and (9).
10
if CC<=1
9
if CC<=2
8
if CC<=3
7
if CC<=4
6
if CC<=5
CC
Metric=
5
if CC<=6 (8)
4
if CC<=7
3
if CC<=8
2
if CC<=9
1
if CC<=10
0
otherwise
10
PValue= Avg (SMP
Metric+ CC
Metric) (9)
The Web Page Click (WP
Click) value is
determined using equation (10) and 10-point
scale value is adjusted according to WP
Clickvalue using equation (11)
0.75 if AvgClicks <= 2.5
WP
Click= 0.5 if AvgClicks <= 4 (10)
0.25 if AvgClicks <= 5
10
PValue= 10
PValue+ WP
click(11)
The Broken Link Error Index (BLE) is calculated to determine the errors in sitemap structure and it is determined using equation (12) and its value is deducted from the value of 10-point scale using equation (13).
1
if PBL >=10
BLE = 0.75 if PBL >=5
(12)
0.5
if PBL >= 2
0.25 if PBL > 0
10
PValue= 10
PValue– BLE (13)
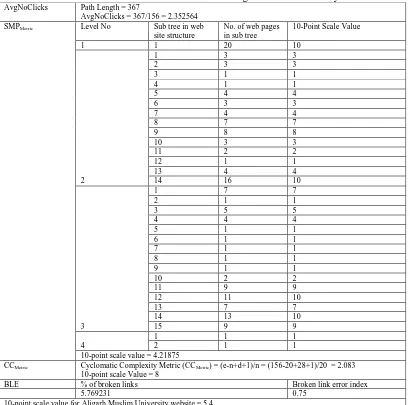
As an example, the evaluation of value of 10-Point Scale value for Aligarh Muslim University website is shown in table 5. Similarly 10-point scale values for 10 universities are shown in table 6.
5. CONCLUSION
[image:4.595.88.283.437.585.2]
75
of the Website. We can further extend this work to identify other components of web site design for quality assessment which would further enable to improve the design as a part of the ideology of
[image:5.595.98.491.154.427.2]TQM which emphasizes the continuous improvement of Design aspect and promote Excellence of Web Design.
76
[image:6.595.83.505.476.727.2]Fig. 5. Minor errors of websites of Universities
Table 1: Universities’ Website Report
Sno University Name Web Site address No.
of
Web
pages
Total
Web
pages
size
Total no.
of web
page
errors in
web site
Average
no. of
errors in
each page
Downloa
d time at
28 Kbps
1 Aligarh Muslim
University www.amu.ac.in 156 9761483 3839 24.60897 1498
2
Assam University www.assamuniversity.in 79 3197361 3689 63.60345 885 3 Bharatiar
University www.b-u.ac.in 182 7571965 5568 30.59341 2096
4 Bharathidasan
University www.bdu.ac.in 159 7263910 4596 28.90566 2011
5 Bhavnagar
University http://www.bhavuni.edu 122 3314715 3154 25.85246 1287
6 Dravidian
University www.dravidianuniversity.ac.in 45 1252639 1275 28.33333 1109 7 Guru Jambeshwar
University www.gju.ernet.in 101 5112758 4685 46.38614 1415
8
M.K. University www.mkuniversity.org 200 4424290 4995 24.97541 1598 9 Rashtriya Sanskrit
Vidyapeetha http://rsvidyapeetha.ac.in 201 3287466 2407 38.20635 910 10
77
[image:7.595.87.502.329.708.2]Table 2: Errors considered in qualitative measures
Table 3: 10-point scale value description
0 to 4
5 to 6
7
8
9
10
Very Poor
Poor
Needs
Improvement
Needs minor changes
Good
Very good
Table 4: The 10-Point Scale formula for various qualitative measures
Sno Measures to be evaluated Errors considered
Minor errors Major errors
1 Text formatting measures BTE, FTE, THE
2 Link formatting measures LTE Broken links 3 Page formatting measures TTE, FTE, StTE,
FoTE
Frame tag usage errors, document type usage errors
4 Graphics element measures ITE, BTE Image load errors
5 Page performance measures FmTE, STE, Title tag with no keyword errors
6 Site architecture measures STE Applet usage errors, server connectivity errors, broken links
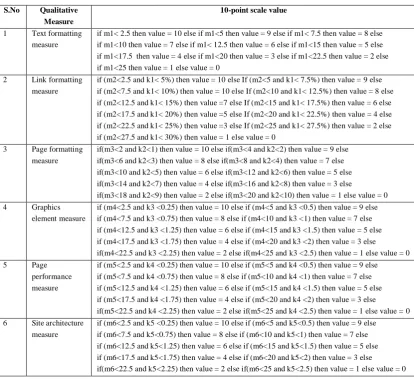
S.No Qualitative
Measure
10-point scale value
1 Text formatting measure
if m1< 2.5 then value = 10 else if m1<5 then value = 9 else if m1< 7.5 then value = 8 else if m1<10 then value = 7 else if m1< 12.5 then value = 6 else if m1<15 then value = 5 else if m1<17.5 then value = 4 else if m1<20 then value = 3 else if m1<22.5 then value = 2 else if m1<25 then value = 1 else value = 0
2 Link formatting measure
if (m2<2.5 and k1< 5%) then value = 10 else If (m2<5 and k1< 7.5%) then value = 9 else if (m2<7.5 and k1< 10%) then value = 10 else If (m2<10 and k1< 12.5%) then value = 8 else if (m2<12.5 and k1< 15%) then value =7 else If (m2<15 and k1< 17.5%) then value = 6 else if (m2<17.5 and k1< 20%) then value =5 else If (m2<20 and k1< 22.5%) then value = 4 else if (m2<22.5 and k1< 25%) then value =3 else If (m2<25 and k1< 27.5%) then value = 2 else if (m2<27.5 and k1< 30%) then value = 1 else value = 0
3 Page formatting measure
if(m3<2 and k2<1) then value = 10 else if(m3<4 and k2<2) then value = 9 else if(m3<6 and k2<3) then value = 8 else if(m3<8 and k2<4) then value = 7 else if(m3<10 and k2<5) then value = 6 else if(m3<12 and k2<6) then value = 5 else if(m3<14 and k2<7) then value = 4 else if(m3<16 and k2<8) then value = 3 else
if(m3<18 and k2<9) then value = 2 else if(m3<20 and k2<10) then value = 1 else value = 0 4 Graphics
element measure
if (m4<2.5 and k3 <0.25) then value = 10 else if (m4<5 and k3 <0.5) then value = 9 else if (m4<7.5 and k3 <0.75) then value = 8 else if (m4<10 and k3 <1) then value = 7 else if (m4<12.5 and k3 <1.25) then value = 6 else if (m4<15 and k3 <1.5) then value = 5 else if (m4<17.5 and k3 <1.75) then value = 4 else if (m4<20 and k3 <2) then value = 3 else
if(m4<22.5 and k3 <2.25) then value = 2 else if(m4<25 and k3 <2.5) then value = 1 else value = 0 5 Page
performance measure
if (m5<2.5 and k4 <0.25) then value = 10 else if (m5<5 and k4 <0.5) then value = 9 else if (m5<7.5 and k4 <0.75) then value = 8 else if (m5<10 and k4 <1) then value = 7 else if (m5<12.5 and k4 <1.25) then value = 6 else if (m5<15 and k4 <1.5) then value = 5 else if (m5<17.5 and k4 <1.75) then value = 4 else if (m5<20 and k4 <2) then value = 3 else
if(m5<22.5 and k4 <2.25) then value = 2 else if(m5<25 and k4 <2.5) then value = 1 else value = 0 6 Site architecture
measure
if (m6<2.5 and k5 <0.25) then value = 10 else if (m6<5 and k5<0.5) then value = 9 else if (m6<7.5 and k5<0.75) then value = 8 else if (m6<10 and k5<1) then value = 7 else if (m6<12.5 and k5<1.25) then value = 6 else if (m6<15 and k5<1.5) then value = 5 else if (m6<17.5 and k5<1.75) then value = 4 else if (m6<20 and k5<2) then value = 3 else
78
[image:8.595.86.496.309.714.2]Table 5: 10-point scale value for qualitative measures of various universities’ websites in India
Table 6: 10-Point Scale value calculation for Aligarh Muslim University Website
AvgNoClicks Path Length = 367
AvgNoClicks = 367/156 = 2.352564
SMPMetric Level No Sub tree in web
site structure
No. of web pages in sub tree
10-Point Scale Value
1 1 20 10
2
1 3 3
2 3 3
3 1 1
4 1 1
5 4 4
6 3 3
7 4 4
8 7 7
9 8 8
10 3 3
11 2 2
12 1 1
13 4 4
14 16 10
3
1 7 7
2 1 1
3 5 5
4 4 4
5 1 1
6 1 1
7 1 1
8 1 1
9 1 1
10 2 2
11 9 9
12 11 10
13 7 7
14 13 10
15 9 9
4
1 1 1
2 1 1
10-point scale value = 4.21875
CCMetric Cyclomatic Complexity Metric (CCMetric) = (e-n+d+1)/n = (156-20+28+1)/20 = 2.083
10-point scale Value = 8
BLE % of broken links Broken link error index
5.769231 0.75
10-point scale value for Aligarh Muslim University website = 5.4
Sno University text
formatting measure
Link formatting
measure
page formatting
measure
graphics element measure
page performance
measure
site architecture
measure
Average (Qualitative
measure)
1 Aligarh Muslim University 4 7 5 4 5 4 4.8
2 Assam University 7 0 0 0 1 0 1.3
3 Bharatiar University 9 5 3 7 5 9 6.3
4 Bharathidasan University 9 5 5 7 5 5 6
5 Bhavnagar University 3 4 4 3 5 1 3.3
6 Dravidian University 5 6 5 3 4 1 4
7 Guru Jambeshwar University
0 0 1 0 1 2 0.7
8 M.K. University 1 0 3 1 5 3 2.1
9 Rashtriya Sanskrit Vidyapeetha
3 2 1 2 3 2 2.2
10 Sri Venkateswara University
79
Table 7: 10-point scale values for website structures of various universities in India
Sno University Name SMPMetric CCMetric 10PValue WPclick BLE 10-point
scale value
1 Aligarh Muslim University 4.21875 8 6.109375 0 0.75 5.4
2 Assam University 2.555556 7 4.777778 0.25 0.5 4.5
3 Bharatiar University 2.55 6 4.275 0.25 0.5 4
4 Bharatidasan University 4.380952 8 6.190476 0.5 0.75 5.9
5 Bhavnagar University 2.833333 8 5.416667 0.75 0.25 5.9
6 Dravidian University 5.666667 3 4.333333 0.25 0 4.6
7 Guru Jambeshwar University 3.352941 6 4.676471 0.75 0.5 4.9
8 Madurai Kamaraj University 4.346154 5 4.673077 0.75 1 4.4
9 Rashtriya Sanskrit Vidyapeetha 2.365854 6 4.182927 0.75 1 3.9 10 Sri Venkateswara University 3.058824 9 6.029412 0.75 0 6.8
REFERENCES
[1]. Folders, Vincent And Michel Will, “Web
Pages that suck: Learn Good Design by looking at Bad Design”, SanFrancisco, CA, SYBEX.
[2]. Yogesh Deshpande, San Murugesan Arthla Ginige, Steve Hanse, Daniel Schwabe, Martin Gaedke, Bebo White, “Web Engineering”, Journal of Web Engineering, Vol.1. No.1 (2002) 003-017.
[3]. Benjamin Yen, Paul Jen-Hwa Hu, May Wang, “Toward and analytical approach for effective Website design: A frame work for modeling, evaluation and enhancement”, Electronic Commerce Research and Applications 6 (2007), 159-170.
[4]. G. Sreedhar and A.A. Chari, “An experimental
Study to Identify Qualitative Measures for Website Design”, Global Journal of Computer Science and Technology, University of Wisconsin, USA, September, 2009, pp.12.
[5]. G. Sreedhar, A.A. Chari and V.V.Venkata Ramana, “Evaluating Qualitative Measures for Effective Website Design”, International Journal on Computer Science and Engineering, vol.02, No.01S, 2010, pp.61-68.
[6]. Benbunan-Fich, R, “Using Protocol Analysis to evaluate the usability of a Commercial Website, Information and Management, 39, 151-163, 2001.
[7]. Ali Azad, “Elements of Effective Web Page
Design”, Global Competitiveness, January, 2001.
[8]. Zheng Chen, Shengping Liu, Liu Wenyin, Geguang Pu, Wei-Ying Ma, “Building a Web Thesaurus form Web Link Structure”, SIGIR 2003, July 28 – August 1, 2003, Toronto, Canada.
[9]. L. Page, S. Brin, R. Motwani and T. Winograd, “The PageRank Citation Ranking: Bring Order to the Web”, Technical Report, Stanford University, 1998.
[10].E. Glover, K. Tsioutisiouliklis, S. Lawrence, D.Pennock, G. Flake, “Using Web Structure for Classifying and Describing Web Pages”, in Proceedings of WWW2002, Hawaii, May 2002.
[11].Techniques for Web Content Accessibility Guidelines by W3C, http://w3.org.
[12].Website Extractor 9.80, http:// wareseeker.com/ screenshot/ Website-extractor-9.80.exe/420871
[13].Web Page Analyzer - 0.98 - Website
Optimization (Free Website Performance Tool and Web Page Speed Analysis)
www.Websiteoptimization.com /services/analyze
[14].W3C Markup Validation Service,
http://validator.w3.org/
[15].W3C Link Checker, http://w3.org/checklink
[16].Yanlong Zhang, Hong Zhu and Sue