Technology (IJRASET)
Process Parameter Optimization of Electric
Discharge Machining By Response Surface
Methodology
S.A. Sayyad1, A.N. Chapgaon21
PG Student, Department of Mechanical Engineering, Ashokrao Mane Group of Institutions,ShivajiUniversity. 2
Department of Mechanical Engineering, Ashokrao Mane Group of Institutions, Shivaji University
Abstract: Electrical Discharge Machining (EDM) is a modern manufacturing process machining process, where electrically conductive material is removed by controlled erosion through a series of electric sparks of short duration and high current density between the electrode and the work piece were both are submerged in a dielectric bath, containing kerosene or distilled water . During this process thousands of sparks per second are generated, and each spark produces a tiny crater in the material along the cutting path by melting and vaporization. Generally the material is removed by erosion process. The top surface of the work piece subsequently resolidifies and cools at a very high rate. The application of this process is mostly found in press tools and dies, plastic moulds, forging dies, die castings, aerospace, automotive, surgical components manufacturing industries etc. This process is not restricted by the physical and metallurgical properties of the work material as there is no physical contact due to high energy electrothermal erosion between the tool and the work piece.
Keywords— EDM, Machining Process, MRR, TWR, SR, Discharge current, Spark on time, RSM.
I. INTRODUCTION
Electric discharge machining is a thermo-electric non-traditional machining process. Material is removed from the work piece through localized melting and vaporization of material. Electric sparks are generated between two electrodes when the electrodes are held at a small distance from each other in a dielectric medium and a high potential difference is applied across them. Localized regions of high temperatures are formed due to the sparks occurring between the two electrode surfaces. Work piece material in this localized zone melts and vaporizes. Most of the molten and vaporized material is carried away from the inter-electrode gap by the dielectric flow in the form of debris particles. To prevent excessive heating, electric power is supplied in the form of short pulses. Spark occurs wherever the gap between the tool and the work piece surface is smallest. After material is removed due to a spark, this gap increases and the location of the next spark shifts to a different point on the work piece surface. In this way several sparks occur at various locations over the entire surface of the work piece corresponding to the work piece-tool gap. Because of the material removal due to sparks, after some time a uniform gap distance is formed throughout the gap between the tool and the work piece.
II. LITERATURE REVIEW
Mohan Kumar Pradhan et al. [1] inthis study, Response surface methodology was used to investigate the relationships and parametric interactions between the three controllable variables on the material removal rate (MRR). Experiments are conducted on AISI D2 tool steel with copper electrode and three process variables (factors) as discharge current, pulse duration, and pulse off time. To study the proposed second-order polynomial mode for MRR, we used the central composite experimental design to estimation the model coefficients of the three factors, which are believed to influence the MRR in EDM process. The response was modelled using a response surface model based on experimental results. The significant coefficients were obtained by performing analysis of variance (ANOVA) at 5% level of significance. It was found that discharge current, pulse duration, and pulse off time significant effect on the MRR. This methodology is very effectual, needs only 20 experiments to assess the conditions, and model sufficiency was very satisfactory as the coefficient of determination was 0.962.
Technology (IJRASET)
above responses using response surface methodology (RSM).The results reveals that MRR is more influenced by peak current, duty factor. Finally, the parameters were optimized for maximum MRR with the desired surface roughness.
Sanchez et al. [3] have presented a study attempts to model based on the least squares theory, which involves establishing the values of the EDM input parameters namely peak current level, pulse-on time and pulse-off time to ensure the simultaneous fulfillment of material removal rate (MRR), electrode wear ratio (EWR) and surface roughness (SR). The inversion model was constructed from a set of experiments and the equations formulated in the forward model and In this forward model, the well-known ANOVA and regression models were used to predict the EDM output performance characteristics, such as MRR, EWR and SR in the EDM process for AISI 1045 steel with respect to a set of EDM input parameters.
Habib [4] presented an investigation on EDM process to form a mathematical modeled equation for material removal rate (MRR), electrode wear ratio (EWR), gap size (GS) and surface roughness (Ra). The adequacy of the modeled equation has been checked by using ANOVA (Analysis of variance). The input parameters were taken as pulse on-time, peak current, gap voltage and SiC particles percentage. He concluded that MRR increases with the increase of pulse on-time, peak current and with gap voltage and it decreases with the decrease of SiC percentage. He modeled equations for the four responses by using RSM methodology.
Joshi and Pande [5] reported an intelligent approach for modeling and optimization of electrical discharge machining (EDM) using finite element method (FEM) has been integrated with the soft computing techniques like artificial neural networks (ANN) and genetic algorithm (GA) to improve prediction accuracy of the model with less dependency on the experimental data. Comprehensive thermo-physical analysis of EDM process was carried out using two-dimensional axi-symmetric non-linear transient FEM model etc. to predict the shape of crater, material removal rate (MRR) and tool wear rate (TWR).
Lin et al. [6] has presented the use of grey relational analysis based on an orthogonal array and the fuzzy-based Taguchi method for the optimization of the electrical discharge machining process with multiple process responses. Both the grey relational analysis method without using the S/N ratio and fuzzy logic analysis are used in an orthogonal array table in carrying out experiments. Tzeng and Chen [7] analyzed a hybrid method including a back-propagation neural network (BPNN), a genetic algorithm (GA) and response surface methodology (RSM) to determine optimal parameter settings of the EDM process. Material removal rate, electrode wear ratio and work-piece surface finish on process parameters during the manufacture of SKD61 by electrical discharge machining (EDM).
Panda and Bhoi [8] have applied ANN to model is checked with the experimental data. Selection of process parameters as the inputs of the neural network is based on factorial design of experiment, which enhances the capability of the neural network because only significant process parameters are considered as the input to the neural network model. The mathematical consideration of all these complex phenomena like growth of the plasma channel, energy sharing between electrodes, process of vaporization, and formation of recast layer, plasma-flushing efficiency and temperature sensitivity of thermal properties of the work material are a few physical phenomena that render the machining process highly difficult and stochastic.
Bhattacharyya et al. [9] has developed mathematical models for surface roughness, white layer thickness and surface crack density based on response surface methodology (RSM) approach utilizing experimental data. It emphasizes the features of the development of comprehensive models for correlating the interactive and higher-order influences of major machining parameters i.e. peak current and pulse-on duration on different aspects of surface integrity of M2 Die Steel machined through EDM.
B. C. Routara et al. [10] The objective of this paper is to study the influence of machining parameters of EDM for machining of EN31 (WC) using electrolyte copper of negative polarity on machining characteristics. The second order mathematical models in terms of machining parameters were developed for surface roughness prediction using response surface methodology (RSM) on the basis of experimental results. All the experiments are conducted on the basis of design of experiments having facedcentered central composite designs. RSM is used to determine the cause and effect relationship between mean responses and input control variables. The model selected for optimization has been validated with F-test. The adequacy of the models on response parameters have been established with Analysis of Variance (ANOVA).An attempt has been taken to optimize process parameters using RSM optimization.
Mandal et al. [11] made an attempt to model and optimize the complex electrical discharge machining (EDM) process using soft computing techniques. Artificial neural network (ANN) with back propagation algorithm is used to model the process. A large number of experiments have been conducted with a wide range of current, pulse on time and pulse off time. The MRR and tool wear have been measured for each setting of current, pulse on time and pulse off time.
Technology (IJRASET)
of the silicon powder added into the dielectric fluid of EDM were chosen as variables to study the process performance in terms of material removal rate and surface roughness.
M.K. Pradhan et al. [13] In this investigation, response surface methodology (RSM) is used to investigate the effect of four controllable input variables namely: discharge current, pulse duration, pulse off time and gape voltage on surface roughness (Ra). A face centred central composite design matrix is used to conduct the experiments on AISI D2 tool steel with copper electrode. The response is modelled using RSM on experimental data. The significant coefficients are obtained by performing analysis of variance (ANOVA) at 95% confidence level. It is found that discharge current and pulse duration are significant factors. RSM is a precision methodology that needs only 30 experiments to assess the conditions and is very effectual. The model sufficiency is very satisfactory as the coefficient of determination is found to be 98.1%. The electro discharge machined surface morphology was examined with a scanning electron microscope (SEM). It is observed from the SEM micrographs that there is a clear deterioration of surface with increase in discharge current.
George et al. [14] have established an empirical models correlating process variables that are pulse current, pulse on time and gap voltage and their interactions with the said response functions named relative circularity of hole represented by the ratio of standard deviations, overcut, electrode wear rate (EWR) and material removal rate (MRR) while machining variables. The Experiments are conducted on the basis of Response surface methodology (RSM) technique. The models developed reveal that pulse current is the most significant machining parameter on the response functions followed by gap voltage and pulse on time. These models can be used for selecting the values of process variables to get the desired values of the response parameters.
Chiang [15] proposed the mathematical modeling and analysis of machining parameters on the performance in EDM process of Al2O3+ TiC mixed ceramic through RSM to explore the influence of four input parameters. The input parameters were taken as discharge current, pulse on time, open discharge voltage and duty factor and the output parameters as MRR (material removal rate), EWR (electrode wear ratio), and SR (surface roughness). ANOVA has been used for investigating the influence of interaction between the factors.
Caydas and Hascalik[16] studied the case of die sinking EDM process in which he has taken pulse on-time, pulse off-time and pulse current as input parameters with five levels. Central composite design (CCD) was used to design the experiments. Here, modeling of electrode wear (EW) and recast layer thickness (WLT) using response surface methodology (RSM). ANOVA have been used in study the adequacy of the modeled equation for the electrode wear and recast layer thickness. They concluded that the predicted value for EW and WLT are 0.99 and 0.97 respectively. For both EW and WLT pulse current as found to be most significant factor rather than pulse off-time.
Tzeng et al. [17] had proposed an effective process parameter optimization approach that integrates Taguchi’s parameter design method, response surface methodology (RSM), a back-propagation neural network (BPNN), and a genetic algorithm (GA) on engineering optimization concepts to determine optimal parameter settings of the WEDM process under consideration of multiple responses. Material removal rate and work-piece surface finish on process parameters during the manufacture of pure tungsten profiles by wire electrical discharge machining (WEDM).
Sohani et al. [18] investigated the effect of process parameters like pulse on time, discharge current, pulse off time and tool area through the RSM methodology for effect of tool shape such as triangle, square, rectangle and circular. The mathematical model was developed for MRR (material removal rate) and TWR (tool wear rate) using CCD in RSM. The ANOVA has been used for testing the adequacy of model for the responses. It also resulted that circular tool shape was best followed by triangular, rectangular and square cross sections. Interaction between discharge current and pulse on time was highly effective term for both TWR and MRR.
Rao et al. [19] conducted the experiments by considering the simultaneous effect of various input parameters varying the peak current and voltage to optimizing the metal removal rate on the Die sinking electrical discharge machining (EDM). The experiments were carried out on Ti6Al4V, HE15, 15CDV6 and M-250.
III. OBJECTIVE OF PRESENT WORK
Technology (IJRASET)
little work is done on material En31, I considered this material for my work. The machining is done by using copper tool. RSM method is used for design of experiments and optimization of process parameters. The results obtained are analyzed and the models are produced by using MINITAB software. The objective of this work is to enhance the material removal rate with high surface quality and minimum tool wear rate
IV. EXPERIMENTAL PROCEDURE
For this experiment the whole work is done by using Electric Discharge Machine, model,Knuth ZNC 435 L having provision of programming in the Z-vertical axis and manually operated X and Y axes. The tool is made of cathode and the work piece as anode. Commercial grade EDM oil (specific gravity= 0.763 kg/ m3), freezing point= 94°C) was used as dielectric fluid with lateral flushing (pressure of 0.3 kgf/cm2) system for effective flushing of machining debris from working gap region. The pulsed discharge current was applied in various steps in positive mode.
SELECTION OF PROCESS PARAMETERS
Table 1.1 Levels of process parameters
V. DESIGN OF EXPERIMENT
Design of Experiments (DOE) refers to planning, designing and analyzing an experiment so that valid and objective conclusions can be drawn effectively and efficiently. In performing a designed experiment, changes are made to the input variables and the corresponding changes in the output variables are observed. The input variables are called resources and the output variables are called response. Resources may be either qualitative or quantitative. Qualitative factors are discrete in nature (such as type of material, color of sample). Each factor can take several values during the experiment. Each such value of the factor is called a level. A trial or run is a certain combination of factor levels whose effect on the output is of interest. It is convenient to represent the high level value of a factor as +1 and the low level value as -1, and transforming all the factors into the same [-1 1] coded range. It is essential to incorporate statistical data analysis methods in the experimental design in order to draw statistically sound conclusions from the experiment.
Before starting the experiments, several things needed to be done in order to run the experiments smoothly and accurately. Basically, there are five general steps that had been set so that the utilization of DOE tools can be hold efficiently.
The five general steps are Plan the experiment, Design the experiment, conducting the experiment, analyze the data from the experiment & Confirmation of experiment
A. Input variables
1) Discharge current (Ip)
2) Spark on time (Ton)
3) Voltage (V)
B. Response Variables
1) Material removal rate(MRR)
2) Surface Roughness (Ra)
3) Tool wear rate (TWR)
VI. RESPONSE SURFACE METHODOLOGY
Response surface methodology (RSM) is a collection of mathematical and statistical techniques that are useful for modelling and analysis of problems in which output or response influenced by several variables and the goal is to find the correlation between the response and the variables. It can be used for optimizing the response. It is an empirical modelization technique devoted to the evaluation of relations existing between a group of controlled experimental factors and the observed results of one or more selected criteria. A prior knowledge of the studied process is thus necessary to achieve a realistic model. We selected only three experimental factors capable of influencing the studied process yield: three factors discharge current (Ip), pulse duration (Ton) and voltage (V).
Machining parameter Symbol Unit Levels with coding
Low level [ -1] High level [+1]
Discharge current Ip A 4 20
Spark on time Ton μs 10 40
Technology (IJRASET)
The first step of RSM is to define the limits of the experimental domain to be explored. These limits are made as wide as possible to obtain a clear response from the model. The Discharge current (Ip), pulse duration (Ton) and voltage (V) are the machining variable, selected for our investigation. The different levels retained for this study are depicted in Table 1.1
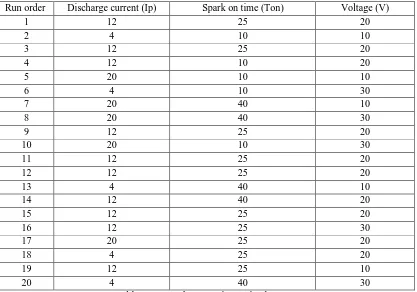
In the next step, the planning to accomplish the experiments by means of response surface methodology (RSM) using a Central Composite Design (CCD) with three variables. Total numbers of experiments conducted with the combination of machining parameter are presented in Table 3.2. The central composite design used since it gives a comparatively accurate prediction of all response variable averages related to quantities measured during experimentation .CCD offers the advantage that certain level adjustments are allowed and can be used in two-step chronological response surface methods. In these methods, there is a possibility that the experiments will stop with fairly few runs and decide that the prediction model is satisfactory. Experiments have been carried out on the EDM set up shown in Fig. and the data were collected with respect to the influence of the predominant process parameters on MRR. The 20 number of runs was conducted as per the conditions of run are depicted in the Table 1.2.
The mathematical model is then developed that illustrate the relationship between the process variable and response. The behavior of the system is explained by the following empirical second-order polynomial model.
VII. CENTRAL COMPOSITE DESIGN
The central composite design (CCD) is one of the most popular classes of designs used for a second-order model. CCD designs comprise a set of two-level factorial points, axial points and center runs. The factorial points contribute to the estimation of linear terms and two-factor interactions. Factorial points are the only points which contribute to estimation of the interaction terms. The axial points contribute to the estimation of quadratic terms. In the absence of axial points, only the sum of the quadratic terms can be estimated. The center runs provide an internal estimate of pure error and contribute towards the estimation of quadratic terms. The number of factorial runs depends on the type of factorial design used and the number of factors. A minimum design resolution of V is required for the factorial fraction. For a full factorial, there are 2k factorial points. The number of axial points is 2k and the number of center runs depends on the number of factors.
Central Composite Design for experimentation
Run order Discharge current (Ip) Spark on time (Ton) Voltage (V)
1 12 25 20
2 4 10 10
3 12 25 20
4 12 10 20
5 20 10 10
6 4 10 30
7 20 40 10
8 20 40 30
9 12 25 20
10 20 10 30
11 12 25 20
12 12 25 20
13 4 40 10
14 12 40 20
15 12 25 20
16 12 25 30
17 20 25 20
18 4 25 20
19 12 25 10
[image:6.612.99.516.422.714.2]20 4 40 30
Technology (IJRASET)
VIII. TOOL ELECTRODE SELECTION A cylindrical shaped pure copper of diameter 8 mm is used for machining of EN31 material.IX. WORK PIECE SELECTION
Depending upon the literature survey, I came to know that very little work has been completed on EN31 material. Hence I have selected the above said material as work piece for experimental work.
Composition of EN31 material
Element Composition weight (%)
C 0.36-0.44
SI 0.10-0.35
MN 0.45-0.70
S 0.040 max
P 0.035 max
Cr 1.00-1.40
Mo 0.20-0.35
Ni 1.30-1.70
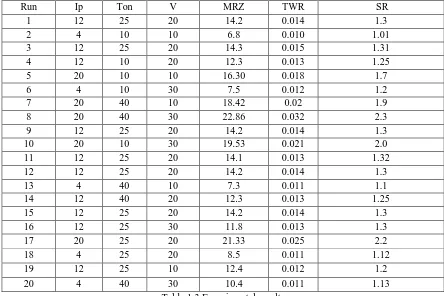
X. EXPERIMENTAL RESULTS
The density of the material is 0.0072 gm/mm3. And machining time in each run is 5 min.
Run Ip Ton V MRZ TWR SR
1 12 25 20 14.2 0.014 1.3
2 4 10 10 6.8 0.010 1.01
3 12 25 20 14.3 0.015 1.31
4 12 10 20 12.3 0.013 1.25
5 20 10 10 16.30 0.018 1.7
6 4 10 30 7.5 0.012 1.2
7 20 40 10 18.42 0.02 1.9
8 20 40 30 22.86 0.032 2.3
9 12 25 20 14.2 0.014 1.3
10 20 10 30 19.53 0.021 2.0
11 12 25 20 14.1 0.013 1.32
12 12 25 20 14.2 0.014 1.3
13 4 40 10 7.3 0.011 1.1
14 12 40 20 12.3 0.013 1.25
15 12 25 20 14.2 0.014 1.3
16 12 25 30 11.8 0.013 1.3
17 20 25 20 21.33 0.025 2.2
18 4 25 20 8.5 0.011 1.12
19 12 25 10 12.4 0.012 1.2
[image:7.612.83.527.331.627.2]20 4 40 30 10.4 0.011 1.13
Table 1.3 Experimental results
XI. ANALYSIS FOR MRR The regression equation is
Technology (IJRASET)
Predicator Coefficient SE Coefficient T P
Constant 1.307 1.230 1.06 0.304
Ip 0.72425 0.04983 14.54 0.000
Ton 0.05900 0.02657 2.22 0.041
V 0.10870 0.03986 2.73 0.015
S = 1.26049 R-Sq = 93.3% R-Sq(adj) = 92.1%
A. Analysis of Variance
Source DF SS MS F P
Regression 3 355.35 118.45 74.55 0.000
Residual error 16 25.42 1.59
Total 19 380.77
Source DF Seq. SS
Ip 1 335.70
Ton 1 7.83
V 1 11.82
XII. ANALYSIS FOR TWR The regression equation is
TWR = 0.00038 + 0.000762 Ip + 0.000087 Ton + 0.000180 V
Predicator Coefficient SE Coefficient T P
Constant 0.000383 0.002957 0.13 0.898
Ip 0.0007625 0.0001197 6.37 0.000
Ton 0.00008667 0.00006386 1.36 0.194
V 0.00018000 0.00009579 1.88 0.079
S = 0.00302903 R-Sq = 74.2% R-Sq(adj) = 69.3%
A. Analysis of Variance
Source DF SS MS F P
Regression 3 0.0004214 0.00014047 74.55 0.000
Residual error 16 0.0001468 0.00000918 15.31
Technology (IJRASET)
Source DF Seq. SS
Ip 1 0.0003721
Ton 1 0.0000169
V 1 0.0000324
XIII. ANALYSIS FOR SR The regression equation is
SR = 0.453 + 0.0568 Ip + 0.00347 Ton + 0.0102 V
Predicator Coefficient SE Coefficient T P
Constant 0.4528 0.1774 2.55 0.021
Ip 0.056750 0.007185 7.90 0.000
Ton 0.003467 0.003832 0.90 0.379
V 0.010200 0.005748 1.77 0.095
S = 0.181772 R-Sq = 80.6% R-Sq(adj) = 76.9%
A. Analysis of Variance
Source DF SS MS F P
Regression 3 2.19224 0.73075 22.12 0.000
Residual error 16 0.52866 0.03304
Total 19 2.72090
Source DF Seq. SS
Ip 1 2.06116
Ton 1 0.02704
V 1 0.10404
XIV. MULTI-OBJECTIVE RESPONSE OPTIMIZATION FOR MATERIAL EN31
Response Goal Lower Target Upper
MRR Maximum 6.8 22.86 22.86
TWR Minimum 0.010 0.010 0.032
Technology (IJRASET)
Graph 1.1 D- Optimality plot
From this graph we can predict the optimum values of process parameters for MRR, TWR and SR as follows.
Process parameters units Optimum values
Discharge current (Ip) A 7.3
Spark on time (Ton) µs 21.28
Voltage (V) volt 10
XV. CONFIRMATION TEST
A. Confirmation test for MRR
Trial No.
Optimum conditions
MRR % Error
Experimental Predicted 01 Ip=7.3A,Ton =21.28µs,
V= 10 volt
8.63 8.94 3.46
02 Ip=7.3A,Ton =21.28µs, V= 10 volt
8.72 8.94 2.46
B. Confirmation test for TWR
Trial No.
Optimum conditions
TWR % Error
Experimental Predicted 01 Ip=7.3A,Ton =21.28µs,
V= 10 volt
0.01 0.0096 4.0
02 Ip=7.3A,Ton =21.28µs, V= 10 volt
0.01 0.0096 4.0
Hi Lo 0.50930 D Optimal Cur
d = 0.98689 Minimum
SR d = 0.99891
Minimum TWR d = 0.13400
Maximum MRR
y = 1.0269 y = 0.0100 y = 8.9521
10.0 30.0 10.0 40.0 4.0 20.0 Ton V Ip
Technology (IJRASET)
C. Confirmation test for SR
Trial No.
Optimum conditions
SR % Error
Experimental Predicted 01 Ip=7.3A,Ton =21.28µs,
V= 10 volt
1.08 1.043 3.42
02 Ip=7.3A,Ton =21.28µs, V= 10 volt
1.09 1.043 4.31
The trials for the optimum values are tabulated in the above tables. The percentage error in between the experimental and predicted values is less than 5 %. This shows the validation or confirmation for the obtained optimum values for 95 % confidence level
XVI. CONCLUSIONS
In the present study the effect of machining parameters on MRR for EN31 using the cylindrical shaped copper tool with side flushing system have investigated for EDM process. The experiments were conducted under various parameters setting of Discharge Current (Ip), Pulse On time (Ton), voltage (V). CCD Response surface methodology was used for experimentation. MINITAB software was used for DOE and analysis of the experimental result and the response was validated experimentally. From this experimentation we conclude that-
Discharge current is the most influencing factor than voltage and Pulse duration time. MRR increases with the increase in discharge current (Ip) and voltage (V).
The obtained optimum values for the selected parameters are: Ip=7.3A, Ton =21.28µs, V= 10 volt
While machining the material EN31, the industrialist can directly use the optimum values so that the material removal rate will be maximum and tool wear rate and surface roughness will be minimum.
This will save the time required for machining, improve surface roughness, avoid excess tool wear, save the electrical power consumption, reduce labour cost, etc
REFERENCES
[1] Mohan Kumar Pradhan and Chandan Kumar Biswas, “Modelling of machining parameters for MRR in EDM using response surface methodology”, Proceedings of NCMSTA’08 Conference National Conference on Mechanism Science and Technology: from Theory to Application November 13-14, 2008 National Institute of Technology, Hamirpur
[2] Manish Vishwakarma, V.K.Khare, Vishal Parashar,“Response surface approach for optimization of Sinker Electric Discharge Machine process parameters on AISI 4140 alloy steel”;International Journal of Engineering Research and Applications (IJERA)ISSN: 2248-9622 www.ijera.com, Vol. 2, Issue 4, July-August 2012, pp.185-189.
[3] Sánchez H.K., Estrems M. and Faura F., Development of an inversion model for establishing EDM input parameters to satisfy material removal rate, electrode wear ratio and surface roughness , International Journal of Advance Manufacturing Technology, 57(2011), pp.189–201.
[4] Habib S.S., Study of the parameters in electrical discharge machining through response surface methodology approach, Applied Mathematical Modelling, 33 (2009), pp.4397–4407.
[5] Joshi S.N. and Pande S.S., Intelligent process modeling and optimization of die-sinking electric discharge machining, Applied Soft Computing, 11(2011), pp. 2743–2755.
[6] Lin C.L., Lin J. L. and Ko T.C., Optimization of the EDM process based on the orthogonal array with fuzzy logic and grey relational analysis method, International Journal of Advance Manufacturing Technology, 19(2002), pp. 271–277.
[7] Tzeng C.J. and Chen R.Y., Optimization of electric discharge machining process using the response surface methodology and genetic algorithm approach, International Journal of Precision Engineering and Manufacturing, 14 (2013), pp. 709-717.
[8] Panda D.K. and Bhoi R.K., Artificial neural network prediction of material removal rate in electro discharge machining, Materials and Manufacturing Processes, 20 (2005), pp. 645-672.
[9] Bhattacharyya B., Gangopadhyay S. and Sarkar B.R., Modelling and analysis of EDMED job surface integrity, Journal of Materials Processing Technology, 189 (2007), pp. 169–177.
[10] B. C. Routara, P. Sahoo, A. Bandyopadhyay, “Application of response surface method for modelling of statistical roughness parameters on Electric Discharge Machining”, Proceedings of the International Conference on Mechanical Engineering 2007 (ICME2007) 29- 31 December 2007, Dhaka, Bangladesh ICME2007-AM-17.
[11] Mandal D., Pal S.K. and Saha P., Modeling of electrical discharge machining process using back propagation neural network and multi-objective optimization using non-dominating sorting genetic algorithm-II, Journal of Materials Processing Technology, 186 (2007), pp. 154–162.
[12] Kansal H.K., Singh S. and Kumara P., Parametric optimization of powder mixed electrical discharge machining by response surface methodology, Journal of Materials Processing Technology, 169 (2005), pp. 427–436 .
Technology (IJRASET)
Technology, Vol. 2, No. 1, 2011.
[14] George P.M., Raghunath B.K., Manocha L.M. and Warrier A.M., Modelling of machinability parameters of carbon–carbon composite—a response surface approach, Journal of Materials Processing Technology 153–154 (2004), pp. 920–924.
[15] Chiang K.T., Modeling and analysis of the effects of machining parameters on the performance characteristics in the EDM process of Al2O3+TiC mixed ceramic, International Journal of Advance Manufacturing Technology, 37(2008), pp.523–533.
[16] Çaydaş U. and Hasçalik A. Modeling and analysis of electrode wear and white layer thickness in die-sinking EDM process through response surface methodology, International Journal of Advance Manufacturing Technology, 38 (2008), pp.1148–1156.
[17] Tzeng C.J., Yang Y.K., Hsieh M.H. and Jeng M.C., Optimization of wire electrical discharge machining of pure tungsten using neural network and response surface methodology, Proceedings of the Institution of Mechanical Engineers, Part B: Journal of Engineering Manufacture, 225(2011), pp. 841-852.
[18] Sohani M.S., Gaitonde V.N., Siddeswarappa B. and Deshpande A.S., Investigations into the effect of tool shapes with size factor consideration in sink electrical discharge machining (EDM) process, International Journal of Advance Manufacturing Technology, 45(2009), pp.1131–1145.