comment
reviews
reports
deposited research
interactions
information
refereed research
Research
Accurate normalization of real-time quantitative RT-PCR data by
geometric averaging of multiple internal control genes
Jo Vandesompele, Katleen De Preter, Filip Pattyn, Bruce Poppe,
Nadine Van Roy, Anne De Paepe and Frank Speleman
Address: Center for Medical Genetics, Ghent University Hospital 1K5, De Pintelaan 185, B-9000 Ghent, Belgium.
Correspondence: Frank Speleman. E-mail: [email protected]
Abstract
Background: Gene-expression analysis is increasingly important in biological research, with real-time reverse transcription PCR (RT-PCR) becoming the method of choice for high-throughput and accurate expression profiling of selected genes. Given the increased sensitivity, reproducibility and large dynamic range of this methodology, the requirements for a proper internal control gene for normalization have become increasingly stringent. Although housekeeping gene expression has been reported to vary considerably, no systematic survey has properly determined the errors related to the common practice of using only one control gene, nor presented an adequate way of working around this problem.
Results: We outline a robust and innovative strategy to identify the most stably expressed control genes in a given set of tissues, and to determine the minimum number of genes required to calculate a reliable normalization factor. We have evaluated ten housekeeping genes from different abundance and functional classes in various human tissues, and demonstrated that the conventional use of a single gene for normalization leads to relatively large errors in a significant proportion of samples tested. The geometric mean of multiple carefully selected housekeeping genes was validated as an accurate normalization factor by analyzing publicly available microarray data.
Conclusions:The normalization strategy presented here is a prerequisite for accurate RT-PCR expression profiling, which, among other things, opens up the possibility of studying the biological relevance of small expression differences.
Published: 18 June 2002
GenomeBiology2002, 3(7):research0034.1–0034.11
The electronic version of this article is the complete one and can be found online at http://genomebiology.com/2002/3/7/research/0034 © 2002 Vandesompele et al., licensee BioMed Central Ltd (Print ISSN 1465-6906; Online ISSN 1465-6914)
Received: 20 December 2001 Revised: 10 April 2002 Accepted: 7 May 2002
Background
Gene-expression analysis is increasingly important in many fields of biological research. Understanding patterns of expressed genes is expected to provide insight into complex regulatory networks and will most probably lead to the iden-tification of genes relevant to new biological processes, or implicated in disease. Two recently developed methods to measure transcript abundance have gained much popularity and are frequently applied. Microarrays allow the parallel
competitive RT-PCR. Nevertheless, these new approaches require the same kind of normalization as the traditional methods of mRNA quantification.
Several variables need to be controlled for in gene-expres-sion analysis, such as the amount of starting material, enzy-matic efficiencies, and differences between tissues or cells in overall transcriptional activity. Various strategies have been applied to normalize these variations. Under controlled con-ditions of reproducible extraction of good-quality RNA, the gene transcript number is ideally standardized to the number of cells, but accurate enumeration of cells is often precluded, for example when starting with solid tissue. Another frequently applied normalization scalar is the RNA mass quantity, especially in northern blot analysis. There are several arguments against the use of mass quantity. The quality of RNA and related efficiency of the enzymatic reac-tions are not taken into account. Moreover, in some instances it is impossible to quantify this parameter, for example, when only minimal amounts of RNA are available from microdissected tissues. Probably the strongest argu-ment against the use of total RNA mass for normalization is the fact that it consists predominantly of rRNA molecules, and is not always representative of the mRNA fraction. This was recently evidenced by a significant imbalance between rRNA and mRNA content in approximately 7.5% of mammary adenocarcinomas [5]. Also, it has been reported that rRNA transcription is affected by biological factors and drugs [6-8]. Further drawbacks to the use of 18S or 28S rRNA molecules as standards are their absence in purified mRNA samples, and their high abundance compared to target mRNA transcripts. The latter makes it difficult to accurately subtract the baseline value in real-time RT-PCR data analysis.
To date, internal control genes are most frequently used to normalize the mRNA fraction. This internal control - often referred to as a housekeeping gene - should not vary in the tissues or cells under investigation, or in response to experi-mental treatment. However, many studies make use of these constitutively expressed control genes without proper vali-dation of their presumed stability of expression. But the lit-erature shows that housekeeping gene expression - although occasionally constant in a given cell type or experimental condition - can vary considerably (reviewed in [9-12]). With the increased sensitivity, reproducibility and large dynamic range of real-time RT-PCR methods, the requirements for a proper internal control gene have become increasingly strin-gent. In this study, we carried out an extensive evaluation of 10 commonly used housekeeping genes in 13 different human tissues, and outlined a procedure for calculating a normalization factor based on multiple control genes for more accurate and reliable normalization of gene-expression data. Furthermore, this normalization factor was validated in a comparative study with frequently applied microarray scaling factors using publicly available microarray data.
Results
Expression profiling of housekeeping genes
Primers were designed for ten commonly used housekeeping genes (ACTB, B2M, GAPD, HMBS, HPRT1, RPL13A, SDHA,
TBP, UBC and YWHAZ) (see Table 1 for full gene name, accession number, function, chromosomal localization, alias, existence of processed pseudogenes, and indication that primers span an intron; see Table 2 for primer sequences). Special attention was paid to selecting genes that belong to different functional classes, which significantly reduces the chance that genes might be co-regulated. The expression level of these 10 internal control genes was determined in 34 neuroblastoma cell lines (independently prepared in differ-ent labs from differdiffer-ent patidiffer-ents), 20 short-term cultured normal fibroblast samples from different individuals, 13 normal leukocyte samples, 9 normal bone-marrow samples, and 9 additional normal human tissues from pooled organs (heart, brain, fetal brain, lung, trachea, kidney, mammary gland, small intestine and uterus). The raw expression values are available as a tab-delimited file (see Additional data files).
Single control normalization error
To determine the possible errors related to the common practice of using only one housekeeping gene for normaliza-tion, we calculated the ratio of the ratios of two control genes in two different samples (from the same tissue panel) and termed it the single control normalization error, E (see Materials and methods). For two ideal internal control genes (constant ratio between the genes in all samples), Eequals 1. In practice, observed Evalues are larger than 1 and consti-tute the erroneous E-fold expression difference between two samples, depending on the particular housekeeping gene used for normalization. Evalues were calculated for all 45 two combinations of control genes and 865 two-by-two sample combinations within the available tissue panels (neuroblastoma, fibroblast, leukocyte, bone marrow and a series of normal tissues from Clontech; that is, a total of 38,925 data points) (Figure 1). In addition, the systematic error distribution was calculated by analysis of repeated runs of the same control gene. The average 75th and 90th percentile Evalues are 3.0 (range 2.1-3.9), and 6.4 (range 3.0-10.9), respectively.
Gene-stability measure and ranking of selected housekeeping genes
comment
reviews
reports
deposited research
interactions
information
refereed research
identical in all samples, regardless of the experimental condi-tion or cell type. In this way, variacondi-tion of the expression ratios of two real-life housekeeping genes reflects the fact that one (or both) of the genes is (are) not constantly expressed, with increasing variation in ratio corresponding
[image:3.609.55.557.119.429.2]to decreasing expression stability. For every control gene we determined the pairwise variation with all other control genes as the standard deviation of the logarithmically transformed expression ratios, and defined the internal control gene-stability measure M as the average pairwise
Table 1
Internal control genes evaluated in this study
Symbol Accession Name Function Localization Pseudo- Primers† Alias IMAGE‡
number gene*
ACTB NM_001101 Beta actin Cytoskeletal structural 7p15-p12 + S 510455
protein
B2M NM_004048 Beta-2-microglobulin Beta-chain of major 15q21-q22 - S 51940
histocompatibility complex class I molecules
GAPD NM_002046 Glyceraldehyde-3- Oxidoreductase in glycolysis 12p13 + D 510510
phosphate dehydrogenase and gluconeogenesis
HMBS NM_000190 Hydroxymethyl-bilane Heme synthesis, porphyrin 11q23 - D Porphobilinogen 245564
synthase metabolism deaminase
HPRT1 NM_000194 Hypoxanthine Purine synthesis in salvage Xq26 + D 345845 phosphoribosyl-transferase 1 pathway
RPL13A NM_012423 Ribosomal protein L13a Structural component of the 19q13 + D 23 kDa highly
-large 60S ribosomal subunit basic protein
SDHA NM_004168 Succinate dehydrogenase Electron transporter in the 5p15 + D 375812 complex, subunit A TCA cycle and respiratory
chain
TBP NM_003194 TATA box binding protein General RNA polymerase II 6q27 - D 280735
transcription factor
UBC M26880 Ubiquitin C Protein degradation 12q24 - D 510582
YWHAZ NM_003406 Tyrosine 3-monooxygenase/ Signal transduction by 2p25 + S§ Phospholipase 416026
tryptophan 5-monooxygenase binding to phosphorylated A2 activation protein, zeta serine residues on a variety
polypeptide of signaling molecules
*Presence (+) or absence (-) of a retropseudogene in the genome determined by BLAST analysis of the mRNA sequence using the high-throughput genomic sequences database (htgs) or human genome as database. †Localization of forward and reverse primer in different exons (D) or the same exon
[image:3.609.55.553.501.646.2](S). ‡IMAGE cDNA clone number according to [14]. §A single-exon gene.
Table 2
Primer sequences for internal control genes
Symbol* Forward primer Reverse primer
ACTB CTGGAACGGTGAAGGTGACA AAGGGACTTCCTGTAACAATGCA
B2M TGCTGTCTCCATGTTTGATGTATCT TCTCTGCTCCCCACCTCTAAGT
GAPD TGCACCACCAACTGCTTAGC GGCATGGACTGTGGTCATGAG
HMBS† GGCAATGCGGCTGCAA GGGTACCCACGCGAATCAC
HPRT1 TGACACTGGCAAAACAATGCA GGTCCTTTTCACCAGCAAGCT
RPL13A CCTGGAGGAGAAGAGGAAAGAGA TTGAGGACCTCTGTGTATTTGTCAA
SDHA TGGGAACAAGAGGGCATCTG CCACCACTGCATCAAATTCATG
UBC ATTTGGGTCGCGGTTCTTG TGCCTTGACATTCTCGATGGT
YWHAZ ACTTTTGGTACATTGTGGCTTCAA CCGCCAGGACAAACCAGTAT
variation of a particular gene with all other control genes. Genes with the lowest Mvalues have the most stable expres-sion. Assuming that the control genes are not co-regulated, stepwise exclusion of the gene with the highest M value results in a combination of two constitutively expressed housekeeping genes that have the most stable expression in the tested samples. To manage the large number of calcula-tions, we have written a Visual Basic Application (VBA) for Microsoft Excel - termed geNorm - that automatically calcu-lates the gene-stability measure Mfor all control genes in a given set of samples (geNorm is freely available from the authors on request). The program enables elimination of the worst-scoring housekeeping gene (that is, the one with the highest Mvalue) and recalculation of new M values for the remaining genes. Using this VBA applet, we ranked the ten control genes in the five tissue panels tested according to their expression stability (Figure 2, Table 3). In addition, the sys-tematic variation was calculated as the pairwise variation, V, for repeated RT-PCR experiments on the same gene, reflect-ing the inherent machine, enzymatic and pipet variation. Normalization factor calculation based on the geometric mean of multiple control genes
We concluded that in order to measure expression levels accurately, normalization by multiple housekeeping genes instead of one is required. Consequently, a normalization factor based on the expression levels of the best-performing housekeeping genes must be calculated. For accurate averag-ing of the control genes, we propose to use the geometric
mean instead of the arithmetic mean, as the former controls better for possible outlying values and abundance differ-ences between the different genes. The number of genes used for geometric averaging is a trade-off between practical considerations and accuracy. It is obvious that an accurate normalization factor should not include the rather unstable genes that were observed in some tissues. On the other hand, it remains relatively impractical to quantify, for example, eight control genes when only a few target genes need to be studied, or when only minimal amounts of RNA are avail-able. Furthermore, it is a waste of resources to quantify more genes than necessary if all genes are relatively stably expressed and if the normalization factor does not signifi-cantly change whether or not more genes are included. Taking all this into consideration, we recommend the minimal use of the three most stable internal control genes for calculation of an RT-PCR normalization factor (NFn,
n= 3), and stepwise inclusion of more control genes until the (n + 1)th gene has no significant contribution to the newly calculated normalization factor (NFn+1). To determine
the possible need or utility of including more than three genes for normalization, the pairwise variation Vn/n+1 was
calculated between the two sequential normalization factors (NFnand NFn+1) for all samples within the same tissue panel
[image:4.609.58.554.89.330.2](with aij=NFn,iand aik=NFn+1,i, nthe number of genes used for normalization (3 £n £9), and i the sample index; see Equations 2 and 3 in Materials and methods). A large varia-tion means that the added gene has a significant effect and should preferably be included for calculation of a reliable
Figure 1
Single control normalization error values (E) were calculated as the ratio of the ratio of two control genes in two different samples (see Materials and methods), and summarized here as cumulative distribution plots for the different tissue panels, pointing at considerable variation in housekeeping gene expression.
Neuroblastoma
Normal pool
Leukocyte
Fibroblast
Bone marrow
Systematic error
Single control normalization error
E
Cumm
ulativ
e distr
ib
ution (%)
20
40
60
80
100
2
4
6
8
10
12
normalization factor. For all tissue types, normalization factors were calculated for the three most stable control genes (that is, those with the lowest Mvalue) and for seven additional factors by stepwise inclusion of the most stable remaining control gene. Pairwise variations were subsequently calculated for every series of NFn and NFn+1 normalization
factors, reflecting the effect of adding an (n+1)th gene (Figure 3a). It is apparent that the inclusion of a fourth gene has no significant effect (that is, low V3/4value) for
leuko-cytes, fibroblasts and bone marrow. This is also illustrated by the nearly perfect correlation between NF3 and NF4
values, as shown for fibroblasts in Figure 3b. On the basis of these data, we decided to take 0.15 as a cut-off value, below which the inclusion of an additional control gene is not required. For neuroblastoma and the pool of normal tissues, one and two additional genes, respectively, are necessary for reliable normalization (see also Figure 3b). The high V8/9
and V9/10 values for the normal pool, neuroblastoma and
[image:5.609.61.554.86.333.2]leukocytes corroborate very well the findings obtained by stepwise exclusion of the worst-scoring control gene (Figure 2). This analysis showed an initial steep decrease in average M value, pointing at two aberrantly expressed control genes for leukocytes and one unstable gene for neu-roblastoma and the pool of normal tissues. Furthermore, the need to include additional control genes for these last two tissue panels is in keeping with the high variation in control-gene expression, as evidenced from Figure 2.
Validation of proposed real-time RT-PCR normalization factors
To assess the validity of the established gene-stability measure, that is, that genes with the lowest M values have indeed the most stable expression, we determined the gene-specific variation for each control gene as the variation coef-ficient of the expression levels after normalization. This
comment
reviews
reports
deposited research
interactions
information
[image:5.609.55.297.533.694.2]refereed research
Figure 2
Average expression stability values (M) of remaining control genes during stepwise exclusion of the least stable control gene in the different tissue panels (black circle, neuroblastoma; white circle, normal pool; white square, bone marrow; black square, leukocyte; gray circle, fibroblast; gray square, systematic error). See also Table 3 for the ranking of the genes according to their expression stability.
0.2
0.4
0.6
0.8
1.0
1.2
A
v
er
age e
xpression stability
M
10
9
8
7
6
5
4
3
2
Number of remaining control genes
Table 3
Control genes ranked in order of their expression stability*
Neuro- Fibroblast Leukocyte Bone Normal
blastoma marrow pool
B2M HMBS ACTB ACTB B2M
RPL13A B2M HMBS B2M ACTB
ACTB RPL13A HPRT1 HMBS YWHAZ
TBP SDHA SDHA TBP RPL13A
YWHAZ TBP TBP SDHA UBC
HMBS ACTB RPL13A GAPD TBP
UBC UBC GAPD HPRT1 HPRT1
SDHA YWHAZ B2M YWHAZ HMBS
HPRT1 - GAPD HPRT1 - GAPD UBC - YWHAZ UBC - RPL13A SDHA - GAPD
coefficient should be minimal for proper housekeeping genes. Three different normalization factors were calculated, based on the geometric mean of three genes with, respec-tively, the lowest (NF3(1-3)), the highest (NF3(8-10)), and
inter-mediate Mvalues (NF3(6-8)) (as determined by geNorm). We
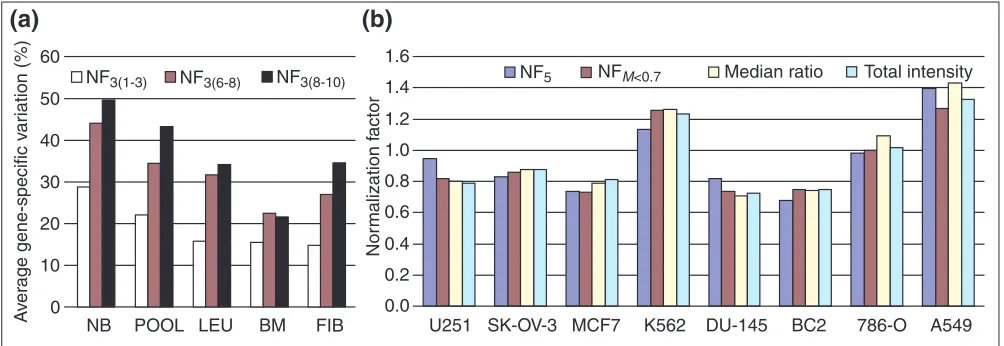
[image:6.609.57.555.84.577.2]subsequently determined the average gene-specific variation of the three genes with the most stable expression (that is, the lowest variation coefficient) for each normalization factor and within each tissue panel (Figure 4a). It is clear that the gene-specific variation in all tissue panels is by far
Figure 3
Determination of the optimal number of control genes for normalization.(a) Pairwise variation (Vn/n+1) analysis between the normalization factors NFn and NFn+1to determine the number of control genes required for accurate normalization (arrowhead = optimal number of control genes for normalization). (b)Selected scatterplots of normalization factors before (x-axis) and after (y-axis) inclusion of an (n+ 1)th control gene (r= Spearman rank correlation coefficient). Low variation values, V, correspond to high correlation coefficients. It is clear that there is no need to include more than three, four or five control genes for fibroblast (A), neuroblastoma (B) and the normal pooled tissues (D), respectively. In contrast, panel C demonstrates that inclusion of at least a fourth control gene is required for the normal pooled tissues.
0.05
0.10
0.15
0.20
0.25
0.30
Normal pool Leukocyte Neuroblastoma Fibroblast Bone marrow
V
3/4P
airwise v
ar
iation
V
V
4/5V
5/6V
6/7V
7/8V
8/9V
9/10Fibroblast
Neuroblastoma
Normal pool
Normal pool
r = 0.983
r = 0.989
r = 0.970
r = 0.867
NF
3NF
3NF
4NF
5NF
4
NF
4
NF
6
NF
5
V
3/4= 0.109
V
3/4= 0.251
V
4/5= 0.138
V
5/6= 0.148
A
B
D
C
Scatter
plots of nor
malization f
actors
(a)
the smallest when the data are normalized to NF3(1-3). This
demonstrates that the gene-stability measure effectively identified the control genes with the most stable expression. To verify that a high Mvalue is characteristic of an unstable or differentially expressed gene, we analyzed the expression level of MYCN - a highly differentially expressed protooncogene in neuroblastoma with prognostic value [13] -together with the set of ten housekeeping genes. MYCNwas readily identified as the most differentially expressed gene, with an Mvalue of 6.02 compared to 2.17 for the least stable control gene (B2M) in neuroblastoma. It was further observed that normalization with a single control gene con-sistently resulted in significantly higher gene-specific varia-tions of the other control genes (data not shown), which underscores the improvement in normalization by using multiple housekeeping genes.
To show that the associations between the best control genes are independent of cell proliferation, we analyzed the expression level of the proliferation marker PCNA in the neuroblastoma cancer cell lines, and determined the Spear-man rank correlation coefficient between the raw expression levels of the four best housekeepers and the marker gene
PCNA. From this analysis, it was clear that the control genes were - as expected - significantly correlated (p< 0.001, cor-relation coefficient between 0.60 and 0.76). In contrast, no correlation was observed between PCNA and three of the four control genes, and only a weak correlation (p= 0.024, coefficient = 0.43) between PCNAand control gene HPRT1. These data firmly demonstrate that the most stable control
genes (identified by the geNorm algorithm) are not per se
linked to the state of cell proliferation of the samples. To further validate the accuracy of geometric averaging of carefully selected control genes for normalization, the geo-metric means of housekeeping-gene expression levels obtained from publicly available microarray data were com-pared with commonly applied microarray normalization factors calculated for the same data. For this purpose, an 8,000-gene array data set [14] was chosen, containing nine of the ten control genes evaluated in this RT-PCR study. Two commonly applied microarray normalization factors (based on median ratio normalization, and total intensity normal-ization) [15-17] were determined for eight randomly selected hybridization sets. Subsequently, for each hybridization set, the background-corrected expression levels of nine house-keeping genes for the two fluorescence channels were imported into geNorm and ranked, as described for the RT-PCR data. As these microarray data originate from hybridizations of cell lines from various histological origin versus a reference pool of multiple cell lines, we have calcu-lated the geometric mean of the five most stable control genes (NF5) for each hybridization set, in accordance to the
recommendations for reliable normalization within a hetero-geneous tissue panel (see previous paragraph). Alternatively, internal control genes were excluded in a stepwise manner until the M values of the remaining genes were below 0.7 (experimental value shown to eliminate the most variable and outlying genes in this microarray dataset). Depending on the hybridization set, seven to nine genes fitted this criterion,
comment
reviews
reports
deposited research
interactions
information
[image:7.609.55.557.87.260.2]refereed research
Figure 4
Validation of the gene-stability measure and the geometric averaging of carefully selected control genes for normalization. (a) Validation of the gene-stability measure. The average gene-specific variation (determined as coefficient of variation, in percent) for the three control genes with the smallest variation within each tissue panel after normalization with three different factors calculated as the geometric mean of the three control genes with the lowest (NF3(1-3)), highest (NF3(8-10)) and intermediate (NF3(6-8)) gene stability values (as determined by geNorm). NB, neuroblastoma; POOL, normal pooled tissues; LEU, leukocytes; BM, bone marrow; FIB, fibroblasts. (b)Geometric averaging. Comparison of frequently applied microarray scaling factors and the proposed RT-PCR normalization factor based on the geometric mean of selected control genes (NF5, geometric mean of the five control genes with the lowest Mvalue; NFM<0.7, geometric mean of control genes with M< 0.7; see Results), calculated for eight hybridizations from publicly available microarray data [14].
0.0 0.2 0.4 0.6 0.8 1.0 1.2 1.4 1.6
NF5 NFM<0.7 Median ratio
SK-OV-3
U251 MCF7 K562 DU-145 BC2 786-O A549
0 10 20 30 40 50
NB POOL LEU
NF3(1-3)
BM 60
NF3(6-8) NF3(8-10)
FIB
Total intensity
A
v
er
age gene-specific v
ar
iation (%)
Nor
malization f
actor
upon which the geometric mean was calculated (NFM<0.7).
Both normalization factors (NF5and NFM<0.7) were shown to
be similar to the calculated microarray normalization factors (Figure 4b).
Tissue-specific housekeeping gene expression
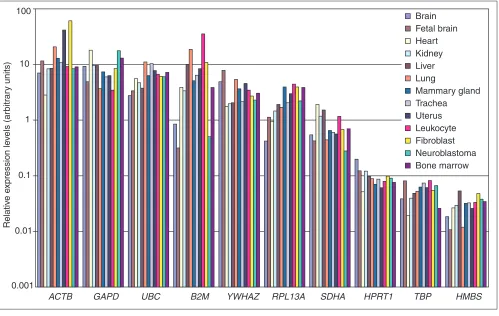
To compare the control gene-expression levels within the heterogeneous group of all 13 tested tissues, the same set of control genes should be used for normalization. We there-fore calculated the geometric mean of six control genes that were withheld from the set of ten genes after elimination of the two genes with the highest Mvalue within each tissue panel (that is, B2M, RPL13A, ACTB and HMBS) (see Table 3). Given the large variety of tested tissues, this is the optimal strategy to eliminate most variation, and to allow direct comparison between the different samples. Under the assumption of equal PCR threshold cycle values for equal transcript numbers of different genes, an estimation of the transcript abundance of the various control genes can be made. Figure 5 shows that the ten tested genes belong to various abundance classes, with an approximately 400-fold expression difference between the most abundant (ACTB) and the rarest (HMBS) transcript. Although the overall
abundance of a given control gene in the different tissues is relatively similar, we clearly observe tissue-specific expres-sion differences, for example, B2M expression level is 112-fold higher in leukocytes compared to fetal brain, and
ACTB shows an expression difference of 22-fold between fibroblasts and heart tissue. It is also clear that some genes have a relatively constant expression level (for example, UBC
and HPRT1) compared to the differential expression pattern of others (for example, B2Mand ACTB).
Discussion
Accurate normalization of gene-expression levels is an absolute prerequisite for reliable results, especially when the biological significance of subtle gene-expression differences is studied. Still, little attention has been paid to the systematic study of normalization procedures and the impact on the con-clusions. For RT-PCR, there is a general consensus on using a single control gene for normalization purposes. A comprehen-sive literature analysis of expression studies that were pub-lished in high-impact journals during 1999 indicated that
[image:8.609.57.556.87.403.2]GAPD, ACTB, 18S and 28S rRNA were used as single control genes for normalization in more than 90% of cases [11]. As
Figure 5
Logarithmic histogram of the expression levels of 10 internal control genes determined in 13 different human tissues, normalized to the geometric mean of 6 control genes (GAPD, HPRT1, SDHA, TBP, UBC, YWHAZ). An approximately 400-fold expression difference is apparent between the most and least abundantly expressed gene, as well as tissue-specific differences in expression levels for particular genes (for example, B2M).
0.001 0.01
0.1 1 10 100
ACTB GAPD UBC B2M YWHAZ RPL13A SDHA HPRT1 TBP HMBS
Brain Fetal brain Heart Kidney Liver Lung
Mammary gland Trachea Uterus Leukocyte Fibroblast Neuroblastoma Bone marrow
Relativ
e e
xpression le
v
els (arbitr
ar
numerous studies reported that housekeeping gene expression can vary considerably [6,9-12], the validity of the conclusions is highly dependent on the applied control. Some laboratories have tried to find the optimal control gene for their experi-mental system, and often rRNA molecules were proposed as best references. These studies should be approached with some caution, as often only the variation in expression of the tested genes with respect to the mass loading of total RNA was assessed. As rRNA molecules make up the bulk of total RNA, they should indeed correlate very well with the total RNA mass, but that does not necessarily make them good control genes. As outlined in the introduction, total RNA and rRNA levels are not proper references, because of the observed imbalance between rRNA and mRNA fractions.
In addition to searching for a stable control gene, we aimed at determining the errors related to the common practice of single control normalization. In this study, we provide evidence that a conventional normalization strategy based on a single housekeeping gene leads to erroneous normaliza-tion up to 3.0- and 6.4-fold in 25% and 10% of the cases, respectively, with sporadic cases showing error values above 20. This analysis showed that a few control genes were unstable and significantly differentially expressed in some tissue panels, as evidenced by the decrease from 5.9 to 4.5 for the 90th-percentile single control normalization error value for neuroblastoma when the B2M gene is omitted (data not shown). This finding agrees with the reported dif-ferential expression of B2Min neuroblastoma, correspond-ing to the stage of differentiation of the tumor cells [18]. The error-distribution curves not only reflect the stability of expression of the applied controls, but also the sample het-erogeneity within a tissue panel, as noted from the less steep curve for the heterogeneous set of normal pooled tissues compared to the other, relatively homogeneous, tissue panels. In this regard, the issue has been raised that finding proper control genes is even more important when working with tissues of different histological origin [9].
The single control normalization error values point to inher-ent noisy oscillations in expression levels of the control genes, a finding which has been corroborated in other large-scale studies where several thousand genes were measured in different cells or tissues by microarray analysis. No gene was found on an 8,000-feature array that did not vary by ratios of at least twofold across a panel of 60 cell lines [14], and a set of genes frequently used for normalization (includ-ing GAPDand ACTB) was found to vary in expression by 7-to 23-fold [9]. Taken 7-together, our data and these studies clearly show that ideal and universal control genes do not exist. This warrants the search for stably expressed genes in each experimental system, and for the development of an accurate normalization strategy.
To validate the expression stability of the tested control genes without any prior assumption of a metric for standardization,
we had initially measured the correlation between the raw, non-normalized expression levels of any two control genes, which should be nearly perfect for proper control genes. We observed, however, that the data range between the minimum and maximum expression levels, or any outlying value, could have a profound influence on the slope of the regression line, and consequently on the value of the correlation coefficient. This made Pearson and Spearman correlation coefficients unsuitable for this kind of analysis. We have therefore developed a new stability measure, based on the principle that the expression ratio of two proper control genes should be identical in all samples, regardless of the experimental condition or cell type, with increasing ratio variation corresponding to decreasing expression sta-bility of one (or both) of the tested genes. The proposed stan-dard deviation of log-transformed control gene ratios is a robust measure for the variation between two control genes, as it does not impose any requirements for normality or homoscedasticity of the data points. Furthermore, this measure is independent of the abundance difference between the genes, and is equally affected by any outlying or extreme ratio (that is, outliers for a sample with low or high overall expression, or outliers caused by an upregulated or downregulated gene have an equivalent increase in pairwise variation V). Logarithmic transformation of the ratios is required for symmetrical distribution of the data around zero, resulting in equal absolute values (but opposite signs) for a given ratio and the inverse ratio. As a result, the stan-dard deviation of log-transformed ratios is identical to the standard deviation of log-transformed inverse ratios, which makes this measure characteristic for every combination of two genes.
Having established a robust measure to assess the variation in expression of two control genes, we subsequently defined a gene-stability measure Mas the average pairwise variation between a particular gene and all other control genes. Using a VBA applet geNorm developed in-house, we ranked ten commonly used housekeeping genes belonging to different functional and abundance classes according to their expres-sion stability in five tested tissue panels. The clear decrease of Mof the remaining control genes during stepwise exclu-sion of the worst-scoring gene points at differences in the stability of gene-specific expression and demonstrates that the remaining genes are more stably expressed than the excluded genes. Some tissue panels show a relatively steep initial decline, which reflects the exclusion of one or more aberrantly expressed control genes (for example, ACTBand
HMBS for leukocytes), as also noticed from the single control normalization error analyses (see above). The average gene stability values of the remaining genes during stepwise elimination of the least stable control genes also indicates tissue-specific differences, with bone marrow and the pool of normal tissues having the lowest and highest overall expression variation, respectively. The latter is no surprise, given the larger tissue heterogeneity in this panel.
comment
reviews
reports
deposited research
interactions
information
The question of whether the observed high variation for neu-roblastoma is a cancer-related phenomenon of deregulated expression is currently under further investigation. From these analyses, it is clear that there is no universal control gene suitable for all cell types. ACTBand B2Mappear to be the worst-scoring genes, whereas UBC, GAPD and HPRT1
seem to be the best overall control genes, each belonging to the four most stable genes in four out of five tested tissues. However, these generalizations should be treated with caution. B2M appears to be one of the least stable control genes, but is nevertheless a good choice for normalization of leukocyte expression levels. This clearly demonstrates that a proper choice of housekeeping genes is highly dependent on the tissues or cells under investigation. This is even more important when considering the differences in transcript abundance of some control genes between different tissues. The large expression differences between the tissues tested for B2Mand ACTB, for instance, would definitely result in large normalization errors if they were used for standardiza-tion. Interestingly, the observed tissue-specific expression of these control genes is in keeping with their known role or function: there is high B2Mexpression in leukocytes, where it is a major cell-surface marker, and relatively low non-muscle cytoskeletal ACTBexpression in heart tissue, which is predominantly of muscular origin.
In view of the inherent variation in expression of housekeep-ing genes, we recommend the use of at least three proper control genes for calculating a normalization factor, and present a procedure to determine whether or not more - and if so, how many - control genes were required for reliable normalization. This analysis clearly showed that three stable control genes sufficed for accurate normalization of samples with relatively low expression variation, whereas other tissue panels required a fourth, or even a fifth control gene to capture the observed variation.
The purpose of normalization is to remove the sampling dif-ferences (such as RNA quantity and quality) in order to iden-tify real gene-specific variation. For proper internal control genes, this variation should be minimal or none. To validate the gene-stability measure Mand the geNorm algorithm to identify the most stable control genes in a set of samples, we have calculated the gene-specific variation for each gene as the coefficient of variation of normalized expression levels. To this end, the raw expression values were standardized to different normalization factors, calculated as the geomean of the most, intermediate, or least stable control genes (as determined by geNorm). The rationale of this analysis is that a normalization factor based on proper internal control genes should remove all nonspecific variation. In contrast, unstable control genes cannot completely remove the non-specific variation, and even add more variation, resulting in larger so-called gene-specific variations for the tested control genes. This analysis clearly demonstrated that most nonspecific variation was removed when the most stable
control genes (as determined by geNorm) were used for nor-malization, which proves that the novel stability measure and strategy presented here effectively allowed the stability of gene expression in the different tissue panels to be assessed.
Further validation demonstrated that the geometric mean of carefully selected control genes is an accurate estimate of the mRNA transcript fraction, as determined by comparison with frequently applied microarray normalization factors. Although both RT-PCR normalization factors based on geo-metric averaging are relatively similar, the one based on at least seven control genes (that is, NFM<0.7) is slightly more
equivalent to the microarray-scaling factors. Two possible explanations can account for this observation. First, the five most stable control genes as determined by geNorm are based on only two RNA samples (that is, a Cy3-labeled refer-ence pool, and a Cy5-labeled test sample), in contrast to the RT-PCR data, where 9 to 34 samples were used, resulting in more reliable estimation of the expression stability. Second, recent technical reports clearly state that array hybridization analyses experience considerable often underestimated -variation and uncertainty at several levels. Accurate back-ground fluorescence correction and spot quality assessment, among others, have been described as critical issues for reli-able ratio estimation [19-21]. The higher variability associ-ated with array hybridization results might thus explain the need for more control genes to normalize the data. Never-theless, this study clearly showed that normalization based on the geometric mean of carefully selected control genes results in equivalent ratio estimation compared to com-monly applied array scale factors, which validates its use for RT-PCR normalization. In addition, the method presented could easily be applied to normalize gene-expression levels resulting from microarray hybridization experiments, where only a limited number of genes are spotted, including some housekeeping genes.
In conclusion, we described and validated a procedure to identify the most stable control genes in a given set of tissue samples, and to determine the optimal number of genes required for reliable normalization of RT-PCR data. The strategy presented can be applied to any number or kind of genes or tissues, and should allow more accurate gene-expression profiling. This is of utmost importance for study-ing the biological significance of subtle expression differences, and for confirmatory and/or extended analyses of microarray results by means of RT-PCR.
Materials and methods
Sample preparationnormal human tissues (heart, brain, fetal brain, lung, trachea, kidney, mammary gland, small intestine and uterus) were obtained from Clontech. Blood and fibroblast biopsies were obtained from different normal healthy indi-viduals. Thirteen leukocyte samples were isolated from 5 ml fresh blood using Qiagens erythrocyte lysis buffer. Fibrob-last cells from 20 upper-arm skin biopsies were cultured for a short time (3-4 passages) and harvested at subconfluency as described [22]. Bone marrow samples were obtained from nine patients with no hematological malignancy. Total RNA of leukocyte, fibroblast and bone marrow samples was extracted using Trizol (Invitrogen), according to the manu-facturers instructions.
Real-time RT-PCR
DNase treatment, cDNA synthesis, primer design and SYBR Green I RT-PCR were carried out as described [23]. In brief, 2mg of each total RNA sample was treated with the RQ1 RNase-free DNase according to the manufacturers instruc-tions (Promega). Treated RNA samples were desalted (to prevent carry over of magnesium) before cDNA synthesis using Microcon-100 spin columns (Millipore). First-strand cDNA was synthesized using random hexamers and Super-scriptII reverse transcriptase according to the manufactur-ers instructions (Invitrogen), and subsequently diluted with nuclease-free water (Sigma) to 12.5 ng/ml cDNA. RT-PCR amplification mixtures (25ml) contained 25 ng template cDNA, 2x SYBR Green I Master Mix buffer (12.5ml) (Applied Biosystems) and 300 nM forward and reverse primer. Reac-tions were run on an ABI PRISM 5700 Sequence Detector (Applied Biosystems). The cycling conditions comprised 10 min polymerase activation at 95°C and 40 cycles at 95°C for 15 sec and 60°C for 60 sec. Each assay included (in dupli-cate): a standard curve of four serial dilution points of SK-N-SH or IMR-32 cDNA (ranging from 50 ng to 50 pg), a no-template control, and 25 ng of each test cDNA. All PCR efficiencies were above 95%. Sequence Detection Software (version 1.3) (Applied Biosystems) results were exported as tab-delimited text files and imported into Microsoft Excel for further analysis. The median coefficient of variation (based on calculated quantities) of duplicated samples was 6%.
Single control normalization error E
For any given m tissue samples, real-time RT-PCR gene-expression levels aijof ninternal control genes are measured. For every combination of two tissue samples pand q, and every combination of two internal control genes jand k, the single control normalization error Ewas calculated (Equation 1). This is the fold expression difference between samples p
and qwhen normalized to housekeeping gene j or k. ("j,kÎ[1,n], "p,qÎ[1,m], j¹k and p¹q):
Rjkpq=
aqj
aqk
×
apk
apj (if R < 1, then E= R
-1, else E= R) (1)
Internal control gene-stability measure M
For every combination of two internal control genes jand k, an array Ajk of m elements is calculated which consist of log2-transformed expression ratios aij/aik(Equation 2). We define the pairwise variation Vjkfor the control genes jand k as the standard deviation of the Ajkelements (Equation 3). The gene-stability measure Mjfor control gene jis the arith-metic mean of all pairwise variations Vjk(Equation 4). ("j,kÎ[1,n] and j¹k):
Ajk=
log2a1j
a1k
, log2a2j
a2k
, ..., log2amj
amk
= log2aij
aik
i=1®m (2)Vjk= st.dev (Ajk) (3)
Mj=k=1 n
Vjk
n- 1 (4)
Normalization of array data
Publicly available raw microarray data [14] were down-loaded as tab-delimited files. Eight hybridization data sets were randomly selected and imported into Microsoft Excel software for further manipulation (MCF7, DU-145, 786-0, BC2, K562, A549, U251, and SK-OV-3). For each hybridiza-tion array, all spots with Cy3 or Cy5 fluorescence intensities below the average overall background level plus one stan-dard deviation were discarded. Subsequently, a local back-ground correction for each spot was applied. Two scale factors were calculated for each slide on the basis of median ratio normalization (median ratio set to 1) and total intensity normalization (equalized sum of fluorescence intensities for both channels). Nine housekeeping genes were identified by BLAST similarity or keyword search against the database of cDNA clones present on the array (see IMAGE clones listed in Table 1).
Additional data files
The raw expression values are available as a tab-delimited file with the online version of this paper.
Acknowledgements
We thank H. De Preter for writing the Visual Basic application for Microsoft Excel, G. Berx (Ghent, Belgium) for critically reading the manu-script, and M. Vidaud (Paris, France) and E. Mensink and A. van de Locht (Nijmegen, The Netherlands) for providing us with TBPand HMBSprimer sequences respectively, L. Nuytinck for the fibroblast RNA samples, and G. De Vos and P. Degraeve (Ghent, Belgium) for culturing the cell lines. K.D.P. and B.P. are supported by a grant from the FWO. N.V.R is a post-doctoral researcher from the FWO. This study was also supported by the Flemish Institute for the Promotion of Scientific Technological Research in Industry (IWT), FWO-grant G.0028.00, GOA-grant 12051397 and BOF-grants 011B4300 and 011F1200.
comment
reviews
reports
deposited research
interactions
information
References
1. Schena M, Shalon D, Davis RW, Brown PO: Quantitative moni-toring of gene expression patterns with a complementary DNA microarray.Science1995, 270:467-470.
2. Fink L, Seeger W, Ermert L, Hanze J, Stahl U, Grimminger F, Kummer W, Bohle RM: Real-time quantitative RT-PCR after laser-assisted cell picking.Nat Med1998, 4:1329-1333. 3. Heid CA, Stevens J, Livak KJ, Williams PM: Real time quantitative
PCR.Genome Res1996, 6:986-994.
4. Higuchi R, Fockler C, Dollinger G, Watson R: Kinetic PCR analy-sis: real-time monitoring of DNA amplification reactions. Biotechnology 1993, 11:1026-1030.
5. Solanas M, Moral R, Escrich E: Unsuitability of using ribosomal RNA as loading control for Northern blot analyses related to the imbalance between messenger and ribosomal RNA content in rat mammary tumors.Anal Biochem2001, 288: 99-102.
6. Spanakis E: Problems related to the interpretation of autora-diographic data on gene expression using common constitu-tive transcripts as controls. Nucleic Acids Res 1993, 21:3809-3819.
7. Johnson ML, Redmer DA, Reynolds LP: Quantification of lane-to-lane loading of poly(A) RNA using a biotinylated oligo(dT) probe and chemiluminescent detection. Biotechniques 1995, 19:712-715.
8. Warner JR: The economics of ribosome biosynthesis in yeast. Trends Biochem Sci1999, 24:437-440.
9. Warrington JA, Nair A, Mahadevappa M, Tsyganskaya M: Compari-son of human adult and fetal expression and identification of 535 housekeeping/maintenance genes. Physiol Genomics 2000, 2:143-147.
10. Thellin O, Zorzi W, Lakaye B, De Borman B, Coumans B, Hennen G, Grisar T, Igout A, Heinen E: Housekeeping genes as internal standards: use and limits.J Biotechnol1999, 75:291-295. 11. Suzuki T, Higgins PJ, Crawford DR: Control selection for RNA
quantitation.Biotechniques2000, 29:332-337.
12. Bustin SA: Absolute quantification of mRNA using real-time reverse transcription polymerase chain reaction assays.J Mol Endocrinol2000, 25:169-193.
13. Maris JM, Matthay KK: Molecular biology of neuroblastoma.J Clin Oncol1999, 17:2264-2279.
14. Ross DT, Scherf U, Eisen MB, Perou CM, Rees C, Spellman P, Iyer V, Jeffrey SS, Van de Rijn M, Waltham M,et al.: Systematic variation in gene expression patterns in human cancer cell lines.Nat Genet2000, 24:227-235.
15. Quackenbush J: Computational analysis of microarray data. Nat Rev Genet2001, 2:418-427.
16. Hess KR, Zhang W, Baggerly KA, Stivers DN, Coombes KR: Microarrays: handling the deluge of data and extracting reli-able information.Trends Biotechnol2001, 19:463-468.
17. Duggan DJ, Bittner M, Chen Y, Meltzer P, Trent JM: Expression profiling using cDNA microarrays.Nat Genet1999, 21:10-14. 18. Cooper MJ, Hutchins GM, Mennie RJ, Israel MA: Beta
2-microglobulin expression in human embryonal neuroblas-toma reflects its developmental regulation.Cancer Res1990, 50:3694-3700.
19. Tseng GC, Oh MK, Rohlin L, Liao JC, Wong WH: Issues in cDNA microarray analysis: quality filtering, channel normalization, models of variations and assessment of gene effects.Nucleic Acids Res2001, 29:2549-2557.
20. Yang MC, Ruan QG, Yang JJ, Eckenrode S, Wu S, McIndoe RA, She JX: A statistical method for flagging weak spots improves normalization and ratio estimates in microarray. Physiol Genomics2001, 7:45-53.
21. Brown CS, Goodwin PC, Sorger PK: Image metrics in the statis-tical analysis of DNA microarray data.Proc Natl Acad Sci USA 2001, 98:8944-8949.
22. Nuytinck L, Narcisi P, Nicholls A, Renard JP, Pope FM, De Paepe A: Detection and characterisation of an overmodified type III collagen by analysis of non-cutaneous connective tissues in a patient with Ehlers-Danlos syndrome IV. J Med Genet 1992, 29:375-380.
23. Vandesompele J, De Paepe A, Speleman F: Elimination of primer-dimer artifacts and genomic coamplification using a two-step SYBR Green I real-time RT-PCR. Anal Biochem 2002, 303:95-98.