An Approach towards Link Positions Routing In Wireless
Network
G. D. Govindwar
1, Prof. P. A. Tijare
21 M. E. Student, Information Technology, Amravati University, India, [email protected]
.
2 Professor, Sipna College of Engg. & Tech, Amravati University, India
.
Abstract—Here, we account for the fact that MAC protocols incorporate a finite number of transmission attempts per packet. The performance of a path depends not only on the number of the links on the path and the quality of its links, but also, on the relative positions of the links on the path based on this observation, we propose ETOP (Expected number of Transmissions On a Path), a path metric that captures the expected number of link layer transmissions required for reliable end-to-end packet delivery.
We can analytically compute ETOP, which is not trivial, since ETOP is a non-commutative function of the link success probabilities. Although ETOP is a more involved metric, we show that the problem of computing paths with the minimum ETOP cost can be solved by a greedy algorithm. We will try to implement and evaluate a routing approach based on ETOP metric ton wireless network.
Keywords—Greedy choice, link position, non-commutative metric, optimal substructure property, transmission count, wireless network.
INTRODUCTION
Reducing the number of link layer retransmissions in a wireless mesh networks is critical for ensuring high overall throughput. This can be achieved by selecting routes with inherently reliable links. This has a two-fold effect. First, the throughput of the flows using these paths is higher. Second the throughput of the network as a whole increases since the fewer transmissions lead to lower network-wide contention.
The cost of a path when the link layer offers limited reliability depends not only on the number of links on the path and the quality of these links, but also on the relative positions of the links on the path. In more detail, one has to account for the possibility that a packet may be dropped at the link layer given the bounded number of retransmissions at that layer. With a reliable transport protocol, such a dropped packet will have to be retransmitted from the source. Thus, a packet drop close to the destination is expensive, since it induces retransmissions (in the subsequent transport layer retransmission attempt) on links that were successfully traversed prior to the drop.
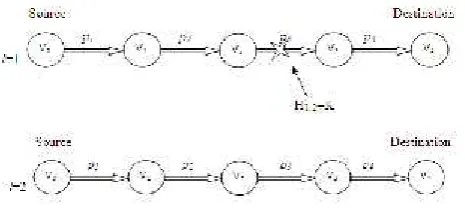
Let us consider the example in Figure. 1. There are two paths from the source P to the destination Q. The number next to each link depicts the probability of a successful transmission (denoted as link success probability) across that link. At first glance, it may seem that it is better to use the path [P, L, M, Q] instead of [P, I, J, K, Q]. In fact, previous strategies such as [1] will choose that path. However, the path [P, I, J, K, Q] is better than [P, L, M, Q]. If the link layer performs at most two transmissions per packet (i.e., only one retransmission is allowed), it is easy to compute that the expected total number of link layer transmissions per packet is approximately 13 for the path [P, I, J, K, Q], while it is approximately 20 for the path [P, L, M, Q]. The higher cost is due to the bad link that is closer to the destination, in the path [P, L, M, Q].
Figure. 1. The effect of the link positions on the performance of a path.
[image:2.595.333.558.397.516.2]LITERATURE REVIEW & RELATED WORK
We have to account for the possibility that a packet may be dropped at the link layer given the bounded number of retransmissions at that layer. With a reliable transport protocol, such a dropped packet will have to be retransmitted from the source. Thus, a packet drop close to the destination is expensive, since it induces retransmissions on links that were successfully traversed prior to the drop. We have a link metric called ETX (Expected Transmission
Count) [2], which is equal to the inverse of a link’s
reliability. The end-to-end cost of a path is the sum of the ETX values of the links on the path; the routing layer simply computes routes that minimize this cost. A mechanism for estimating the link reliabilities, based on dedicated broadcast packets. Experiments on a 29-node 802.11 testbed showed that ETX based routing results in better end-to-end throughput as compared to minimum-hop routing.
Other related efforts in [3], [4] and [5] have used the inverse of the link reliability (ETX) in combination with other parameters (such as the link bandwidth) for improving routing performance in multihop wireless networks. In [4] Draves et al. propose a new routing metric, WCETT (Weighted Cumulative Expected Transmission Time), that considers the link bandwidth and interference in addition to the (inverse of) the link reliability. In this multi-radio, multiple channel technology is a visible solution to increase the capacity of wireless mesh network. On the one hand, the interference can be reduced by tuning neighboring nodes on
different channels. On the other hand, multi-hop
coordination schemes that exploit the presence of multiple radios can be deployed at the MAC layer so author has proposed a cross layer architecture that provides efficient end-to-end communication in multi-radio multi-channel wireless mesh networks.
In [5], C. Koksal and H. Balakrishnan propose a mETX
(modified ETX) and ENT (Expected Number of
Transmission) that extend ETX to account for highly variable link reliabilities. These quality aware routing metric expected number of transmission count can improve the throughput of wireless mesh network by significant amount compared to traditional shortest hop-count routing protocol, it does not cop well with short-term channel variations because it uses the mean loss ratios in making routing decision. For example radio channel may have low average packet loss ratios, but with high variability, implying that metrics that use mean loss ratio will perform poorly because they do not adapt well to burst loss conditions.
The number of transmission of the packet on radio link is an appealing cost metric because minimizing the total number
of transmission maximizes the overall throughput.
Moreover, this metric minimizes the transmission energy consumed in transferring the packet along a path in a network when the nodes transmit at a constant power level. Although experimental result in [5] shows that ETX performs better that traditional shortest-path routing under static network condition, it may perform poorly under highly variable channel condition, because ETX consider only the average channel behavior. In particular, the routing protocol measures the channel state using a set of probe packet sent
once every second, averaging the loss ratio over an interval of about 10 seconds. The reciprocal of this estimate is assigned as the ETX of the link. In this procedure, the number of transmissions is implicitly is assumed to be a geometric random variable; if successive packet are lost independently with probability equal to the average packet error rate of channel, the assumption is accurate. Packet losses generally occur in burst, however, and the packet loss probability is usually not constant.
The used metric is similar to ETX for finding minimum energy paths used in [6]. There are two more models. In first model, the link layer performs no retransmissions and all the reliability is handled end- to-end. In the second model, referred to as the mixed model, the link layer either performs no retransmissions, and the reliability is handled end-to-end, or it performs an unbounded number of
retransmissions. For both the models design optimal
algorithms. However, the case in which the link layer offers a finite number of retransmissions is not considered. In [7] the product of ETX with the distance traversed toward the destination is used for energy-efficient geographic routing.
A similar model is used for energy efficient routing. In [14], routing is jointly considered with power control, and in addition to the unicast case, the multicast case is also considered based on measurements, it uses broadcast packets to estimate the link reliability for data packets could lead to inaccuracies. Therefore, both efforts propose algorithms for data-driven link reliability estimation.
The inverse of the link reliability estimates the expected number of transmissions (including retransmissions), IE, needed to send a packet across a link, with the implicit assumption that an infinite number of retransmissions is allowed on the link. Therefore, the link layer never drops a packet. To elucidate this, let p be the probability of a successful transmission across a link. Assuming that the outcomes of the transmission attempts on the link are independent and identically distributed, IE can be computed as
IE= j p=1/p (1) Since the link layer never drops a packet, there is never a need for a transport layer retransmission. This simplifies the calculation of the retransmissions needed for reliable packet delivery over a path; the number of retransmissions depends only on the link quality and not on their positions, i.e., the calculation is commutative. In practice, however, there are a bounded number of link layer transmission attempts (as with 802.11) per packet and a reliable transport protocol will need to perform an end-to-end retransmission to cope with link layer packet drops. In this case, as discussed with example in Figure. 1, the relative position of the links on a path becomes important when computing the cost of a path.
ANALYSIS OF PROBLEM
packets, as in DSR or AODV, or routing updates, as in DSDV). This approach implicitly assumes that links either
work well or don’t work at all. While often true in wired
networks, this is not a reasonable approximation in the wireless case: many wireless links have intermediate loss ratios. A link that delivers only 50% of packets may not be useful for data, but might deliver enough routing update or query packets that the routing protocol uses it anyway. Minimizing the hop-count maximizes the distance traveled by each hop, which is likely to minimize signal strength and maximize the loss ratio. Even if the best route is a minimum hop-count route, in a dense network there may be many routes of the same minimum length, with widely varying qualities; the arbitrary choice made by most minimum
hop-count metrics is not likely to select the best. One
contribution of this paper is to quantify these effects. One approach to fixing this problem is to mask transmission errors. For example, the 802.11b ACK mechanism resends lost packets, making all but the worst 802.11b links appear loss-free. However, retransmission does not make lossy links desirable for use in paths: the retransmissions reduce path throughput and interfere with other traffic. Another approach might be to augment minimum hop-count routing with a threshold that ignores lossy links, but a lossy link may be the only way to reach a certain node, and there might be significant loss ratio differences even among the above threshold links.
Minimum hop-count performs well whenever the shortest route is also the fastest route, especially when there is a one-hop link with a low loss ratio. A one-one-hop link with a loss ratio of less than 50% will outperform any other route. The
overhead of DSDV route advertisements reduces the
maximum link capacity by about 15 to 25 packets. A number of superficially attractive metrics are not suitable. Using hop-count as the metric while ignoring links with loss ratios above a certain threshold may cause some destinations to be unreachable. Using the product of the per-link delivery ratios as the path metric, in an attempt to maximize the end-to-end delivery probability, fails to account for inter-hop interference; this metric would view a perfect two-hop route as better than a one-hop route with a 10% loss ratio, when in fact the latter would have almost twice the throughput. The same objection applies to using the useful throughput of a
path’s bottleneck (highest-loss-ratio) link as the path’s
metric. ETOP, however, addresses each of these concerns. End-to-end delay is another potential metric, but changes with network load as interface queue lengths vary; this can cause routes to oscillate away from a good path once the path is used.
The use of ETOP reduces the number of link layer
transmissions (including retransmissions) significantly
compared to ETX. ETOP is designed to reduce the retransmissions costs at the MAC layer and thus, it is important that as we are suppose to be examine whether ETOP has met its design goals in further sections. Our goal is to design a metric that have a less packet loss ratio, and minimum transmission delay which performed well in larger network. In further section 4, we discuss about how to compute the ETOP metric with certain assumption and
network notations. The key observation that motivates this work is the cost of a path when the link layer offers limited reliability depends not only on the number of links on the path and the quality of these links, but also on the relative positions of the links on the path. In more detail, one has to account for the possibility that a packet may be dropped at the link layer given the bounded number of retransmissions at that layer. With a reliable transport protocol, such a dropped packet will have to be retransmitted from the source. Thus, a packet drop close to the destination is
expensive, since it induces retransmissions (in the
subsequent transport layer retransmission attempt) on links that were successfully traversed prior to the drop.
PROPOSED WORK AND OBJECTIVES
Computing ETOP
An analytical model for computing the ETOP cost of a path. In our model, unlike previous efforts, we account for the bounded number of retransmission attempts at the link layer (leading to possible packet drops at this layer). We then assume that a transport layer protocol (such as TCP) performs end-to-end retransmission attempts (e2e attempts) until the packet is finally delivered to the destination.
Assumptions:
1. The probability of a successful transmission on a link does not change between retransmission attempts. In other words, the outcomes of link layer transmission attempts are independent and identically distributed (IID).
2. Implicitly, assume that the power and bit-rate used for each transmission by a node does not change. If nodes are
allowed to change their transmission properties, the
probability of success will vary.
Network representation and notation.
Author model the wireless network as a directed graph G(V,E,w), where V is the set of nodes and E the links. Every link i € E is assigned a weight 0 < pi≤ 1, which represents
the packet delivery probability over that link with a single transmission attempt. Consider the problem of sending a packet from a source node v0, to a destination node vn,
along a n-link path via nodes v1,v2 …vn. The source, node
v0, initiates an end to end attempt. First, the packet is passed on to the link layer, which will transmit it to node v1. If successfully received by node v1, it will then be transmitted to node v2, and so forth, until the packet reaches node vn. There is a probability 0 < pi≤ 1 where i = 1,2,… n that the
First e2e attempt (l=1) failed after crossing two links - > M1=2
[image:5.595.36.269.144.251.2]Second e2e attempt (l=2) succeeded - > M2=4 There were two e2e attempts on a 4 links path - > Y4
Figure. 3. An example to illustrate our modeling assumption and highlight notation
The drop is reported to the transport layer of node v0. In response, the transport layer of v0 initiates a new e2e attempt for the same packet. For every e2e attempt, there is a cost: the number of link level transmissions during this attempt. Let Tn be a random variable that represents the sum of the costs of all the e2e attempts made in order for a packet to be delivered from node v0 to node vn. Our goal is to compute the expected value of Tn, the ETOP cost of the path, as a function of link weights, pi, and the bound on the number of link level transmissions, K. Let Yn denote the random variable representing the number of e2e attempts required in order for the packet to be delivered to the destination on the n-hop path. Let Ml denote the number of consecutive hops that are successfully traversed along the path, beginning at node v0, in the lth e2e attempt. Thus, Ml= 0 if the packet fails to reach node v1 from node v0, and Ml= n if the message has reached vn. If Ml < n, the (l+1)st e2e attempt begins. We assume that the random variables M1,M2, . . . , are independent and identically distributed (IID) and can be represented by a single random variable M. Let Hl , j denote the number of link layer transmissions needed to deliver the packet from node vj to node vj+1 in the lth e2e attempt If the message has successfully traversed the link from vj to vj+1, Hl , j≤ K; else, if the message fails
to reach node vj+1 from node vj, then, Hl , j =K and a new e2e attempt is started at node v0. For each node vj, we assume that H1,j,H2,j, . . . , are IID random variables and we use the notation Hj to represent this common random variable. To elucidate the meaning of the variables defined so far, we consider a simple scenario, depicted in Figure. 3, that can occur when a packet is transmitted from v0 to v4. Let there be two e2e attempts ( Y4= 2) to deliver a single packet from the node v0 to node v4. On the first e2e attempt, the packet crosses links (v0,v1) and (v1,v2) after being transmitted only once. However, it is dropped at node v2. Therefore, H1,0 = H1,1= H1,2 = K, and M1= 2. The cost in terms of link level transmissions incurred on this e2e
attempt is K + 2. On the second attempt, the packet is delivered to the destination, node V4, and crosses each link with a single link layer transmission attempt. Therefore, H2,0 = H2,1= H2,2 = H2,3= K and M2 = 4.
The cost in terms of link level transmissions incurred on this e2e attempt is 4. The total cost incurred in terms of link level transmissions to deliver the packet from node v0 to node v4, is T4 =K + 6. The cost of a path, using the model and the random variables defined above, for the general case of a n-link path, the cost, Tn, is given by
where and II(l < Yn) represents the indicator
function that takes on a value 1 when l< Yn and 0 otherwise. If l < Yn, the specific e2e attempt failed to deliver the packet to the estimation, i.e., the packet was dropped somewhere along the path. We know that the node at which the packet was dropped performed exactly K transmissions. The summation inside the parentheses simply represents the number of link level transmissions in the process of crossing Ml links during the lth e2e attempt. We will implement a routing strategy based on the algorithm described in ETOP using greedy algorithm on indoor wireless mesh network. While Routing implementation, We will use ETOP-based routing as part of a modified version of the DSR(Dynamic Source Routing) protocol for the Linux kernel. We chose DSR because 1) it is one of the most popular protocols for multihop wireless networks and hence, its implementations are readily available and 2) it allows a source to decide on the path to the destination (required by ETOP-R since it is noncommutative). Furthermore, we consider the ETX metric for comparison and use the implementation of the routing strategy based on ETX. For ease of notation we refer to ETOP-based routing as ETOP-R and to ETX-based routing as ETX-R.
With DSR, a node attempts to find a route to a destination by broadcasting a route request message (RREQ). The RREQ is subsequently rebroadcasted once by each nodes in the network, upon receipt. A node inserts its own address in the RREQ before rebroadcasting it. The sequence of addresses in the forwarded RREQ specifies the route traversed from the source to the destination. Upon receiving a RREQ, the destination sends a route reply message (RREP) to the source (with the route embedded within), along the reverse route recorded in the corresponding RREQ. The source stores the routes collected from all the RREPs received in a cache and uses, for a limited time, the route with the minimum hop count for forwarding data. The route error messages (RERR messages) induced by DSR are disabled during the experiments; this functionality of DSR is not utilized with either ETX-R or ETOP-R.
EXPERIMENTAL RESULTS AND DISCUSSION
The routing protocol used for simulation is Ad-hoc On-Demand Multipath Distance Vector Protocol.
[image:6.595.63.253.222.348.2]The ETOP model is compared with ETX Model[2] from different perspectives such as cost and delay. The network simulator setup is shown in table 1.
TABLE 1
SIMULATION PARAMETER
Simulator Ns-2 (Version 2.34)
Simulation Time 300 (s)
Number of mobile nodes
40
Routing Protocol AOMDV
Traffic CBR
Transport Protocol UDP
Packet Size Bytes
A. Evaluation of Transmission Cost for ETOP model and ETX model
Figure 4. Variation of transmission cost with number of communications.
Above figure 4. Show the transmission cost of ETOP and ETX model for varying number of communication .The X-axis indicate the number of communication from source to destination and Y-axis indicate the cost in terms of distance vector in meters. From the figure 4., we can analyse that the transmission cost in ETOP model is lesser than ETX model.
B. Evaluation of Delay for ETOP model and ETX model
Figure5. Variation of end to end delay with number of communication
Above figure 5. Show the end to end delay incurred in sending the data from the source node to destination node by ETOP model and ETX model for varying number of communication. The X-axis indicate the number of communication from source to destination and Y-axis indicate the end to end delay in terms of time..
From the figure5., we can analyse that the the end to end delay incurred in sending the data from the source node to destination node is much more reduced in the ETOP model as compared to the ETX model.
CONCLUSION
Here we revisit the problem of computing the path with the minimum cost in terms of the number of link layer transmissions and retransmissions in multihop wireless networks. The key feature that distinguishes is that we consider a finite number of link level retransmissions, unlike previous efforts (such as ETX). We demonstrate that in addition to the magnitude of the link reliabilities on a path, the relative ordering of the links is critical in computing the correct minimum cost path. We provide an analytical model to compute a noncommutative path metric, ETOP that
captures this cost. We show that in spite of ETOP’s complex
form, the problem of computing the path with the minimum ETOP value can be solved using our greedy routing strategy. We will implement ETOP based routing and perform extensive experiments on a mesh network to quantify and evaluate its performance. We compare the performance of the paths computed with our metric with those computed with a routing strategy based on ETX.
[image:6.595.31.289.411.629.2][1] D. S. J. De Couto, D. Aguayo, J. Bicket, and R. Morris, “A
High-Throughput Path Metric for Multi-Hop Wireless
Routing”, Proc.ACM MobiCom, 2003.
[2] T. Cormen, C. Leiserson, and R. Rivest, “Introduction to
Algorithms”.McGraw Hill, 2000.
[3] S. Banerjee and A.Misra, “Minimum Energy Paths for Reliable Communication in MultiHop Wireless Networks”,
Proc. Third ACM MobiHoc, 2002.
[4] C. Koksal and H. Balakrishnan, “Quality-Aware Routing
Metrics for Time-Varying Wireless Mesh Networks”, IEEE
J. Selected Areas in Comm., vol. 24, no. 11, pp. 1984-994,Nov.2000.
[5] R.Draves,J.Padhye, and B. Zill,“Routing in Multi-Radio,
Multi- Hop Wireless Meshetwork” ,Proc.ACM Mobi
Com,2004.
[6] ] K. Kimm and K. G. Shin, “On Accurate Measurement of
Link Quality in Multi-Hop Wireless Mesh Networks”, Proc.
ACM MobiCom, 2006.
[7] Q. Dong, S. Banerjee, M. Adler , and A. Misra, “Minimum
Energy Reliable Paths Using Un- reliable Wireless Links”,
Proc. ACM MobiHoc, 2005.
[8] K. Seada, M. Zuniga, A. Helmy, and B. Krishnamachari,
“Energy-Efficient Forwarding Strat-egies for Geographic
Routing in Lossy Wireless Sensor Networks”, Proc. ACM Second Int’l Conf. Embedded Networked Sensor Systems
(SenSys ’04), 2004.
[9] G. Jakllari, S. Eidenbenz, N. Hengartner, S.V.
Krishnamurthy, and M. Faloutsos, “Link Positions Matter: A Noncommutative Routing Metric for Wireless Mesh
Networks”, Proc. IEEE INFOCOM, 2008.
[10]E. S. Jung, N.H.Vaidya, “A Power Control MAC Protocol for Ad Hoc Networks”,Proceding of MOBICOM, September
2002.
[11]C. K. Toh, “ Maximum Battery Life Routing to Support Ubiquitous Mobile Computing in Wireless Ad Hoc
Networks ”, IEEE Communications Magazine, June 2001.
[12]C. K. Toh, H. Cobb and D. A. Scott: “Performance
Evaluation of Battery-Life- Aware Routing Schemes for
Wireless Ad Hoc Networks”. Proceedings ofIEEE ICC, June 2001.
[13]Q. Li, J. Aslam and D. Rus: “Online Power-aware Routing in
Wireless Ad-Hoc Networks”. Proceedings of MOBICOM,
July 2001.
[14]X. Li, Y. Shu, H. Chen, and X.Chu, “Energy Efficient Routing with Unreliable Links in Wireless Networks”, Proc.
IEEE Int’l Conf. Mobile AdHoc and Sensor
Systems(MASS’06),2006.
[15]D.B. Johnson, Y. Hu, and D.A. Maltz, “The Dynamic Source
Routing Protocol (DSR) for Mobile Ad Hoc Networks for
IPv4”, IETF RFC 4728, Apr. 2003.
[16] E. Kohler, R. Morris, B. Chen, J. Jannotti, and M.F.
Kaashoek, “The Click Modular Router”, ACM Trans.
Computer Systems, vol. 18, no. 3, pp. 263-297, 2000.