comment
reviews
reports
deposited research
interactions
information
refereed research
Research
Constant relative rate of protein evolution and detection of
functional diversification among bacterial, archaeal and eukaryotic
proteins
I King Jordan, Fyodor A Kondrashov, Igor B Rogozin, Roman L Tatusov,
Yuri I Wolf and Eugene V Koonin
Addresses: National Center for Biotechnology Information, National Library of Medicine, National Institutes of Health, Bethesda, MD 20894, USA.
Correspondence: I King Jordan. E-mail: [email protected]
Abstract
Background:Detection of changes in a protein’s evolutionary rate may reveal cases of change in that protein’s function. We developed and implemented a simple relative rates test in an attempt to assess the rate constancy of protein evolution and to detect cases of functional diversification between orthologous proteins. The test was performed on clusters of orthologous protein sequences from complete bacterial genomes (Chlamydia trachomatis, C. muridarumand Chlamydophila pneumoniae), complete archaeal genomes (Pyrococcus horikoshii, P. abyssiand P. furiosus) and partially sequenced mammalian genomes (human, mouse and rat).
Results: Amino-acid sequence evolution rates are significantly correlated on different branches of phylogenetic trees representing the great majority of analyzed orthologous protein sets from all three domains of life. However, approximately 1% of the proteins from each group of species deviates from this pattern and instead shows variation that is consistent with an acceleration of the rate of amino-acid substitution, which may be due to functional diversification. Most of the putative functionally diversified proteins from all three species groups are predicted to function at the periphery of the cells and mediate their interaction with the environment.
Conclusions: Relative rates of protein evolution are remarkably constant for the three species groups analyzed here. Deviations from this rate constancy are probably due to changes in selective constraints associated with diversification between orthologs. Functional diversification between orthologs is thought to be a relatively rare event. However, the resolution afforded by the test designed specifically for genomic-scale datasets allowed us to identify numerous cases of possible functional diversification between orthologous proteins.
Published: 20 November 2001
GenomeBiology2001, 2(12):research0053.1–0053.9
The electronic version of this article is the complete one and can be found online at http://genomebiology.com/2001/2/12/research/0053 © 2001 Jordan et al., licensee BioMed Central Ltd
(Print ISSN 1465-6906; Online ISSN 1465-6914)
Received: 6 August 2001 Revised: 11 September 2001 Accepted: 5 October 2001
Background
In an early attempt to relate theoretical concepts and empiri-cal results bearing on the molecular basis of evolution, Kimura and Ohta listed five principles of molecular evolu-tion [1,2]. The first of these deals with the concept of the
changes [3]. This rate-constancy prediction is tested here by studying the relative rates of protein evolution in a simple phylogenetic context. The test relies on the simultaneous analysis of numerous protein sequences that represent com-plete protein sets from sequenced genomes or partial protein sets from genomes of which a significant fraction has been sequenced. Consistent with the rate-constancy prediction, given a phylogenetic tree topology, the ratio of evolutionary distances along different branches of the tree should be approximately constant for all proteins from an analyzed set of species.
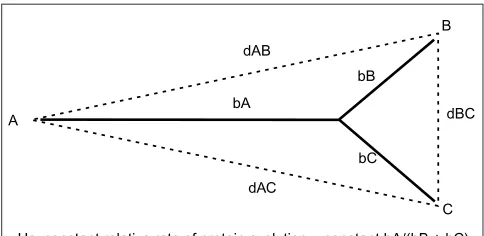
Clusters of orthologous proteins from bacterial, archaeal and eukaryotic species sets of size three were analyzed with respect to this prediction. Specifically, for each protein phy-logeny, the length of the longest branch was compared to the sum of the two shorter branches (Figure 1). Such a genome-scale test allowed for a robust assessment of the rate con-stancy of protein evolution, as well as the detection of multiple cases of accelerated evolutionary change and a quantitative assessment of the fraction of genes that undergo such acceleration.
Results and discussion
Genomic-scale relative rates test
Three genomes of intracellular pathogenic bacteria of the family Chlamydiaceae (Chlamydophila pneumoniae, Chlamy-dia trachomatis and Chlamydia muridarum) and three genomes of archaeal hyperthermophiles of the genus Pyro-coccus (Pyrococcus abyssi, P. horikoshii and P. furiosus) were chosen for analysis. Orthologs were identified using the rationale and procedure that underlie the construction of
clusters of orthologous groups of proteins (COGs) [4,5]. This approach has been designed to maximize the likelihood of identification of orthologs when complete genomes are com-pared. A modified approach involving two additional steps was used to identify probable orthologs among the encoded proteins from three partially completed mammalian genomes (Homo sapiens (human), Mus musculus (mouse) and Rattus norvegicus(rat).
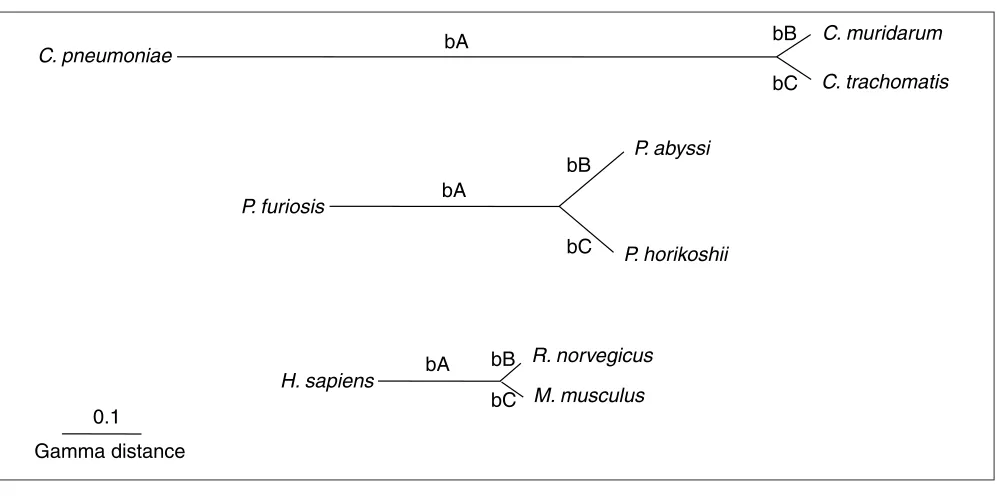
These procedures resulted in a total of 703 Chlamydiaceae, 1,305 Pyrococcusand 2,112 mammalian orthologous protein sets. Each orthologous protein-sequence set was aligned and the evolutionary distances between sequences within the sets were computed. These distances were used in phyloge-netic reconstructions for all orthologous protein sets. For each species group, branch lengths were averaged to produce the trees shown (Figure 2). Each of the trees con-tains two relatively short branches of virtually identical length and one long branch, forming two main phylogenetic partitions. The rate-constancy prediction holds that the evo-lutionary rates along these phylogenetic branches should be correlated. In other words, the length of branch A (bA) should be correlated with the length of branches B and C (bB + bC) (Figures 1,2) resulting, in an ideal case, in a constant bA/(bB+bC) ratio.
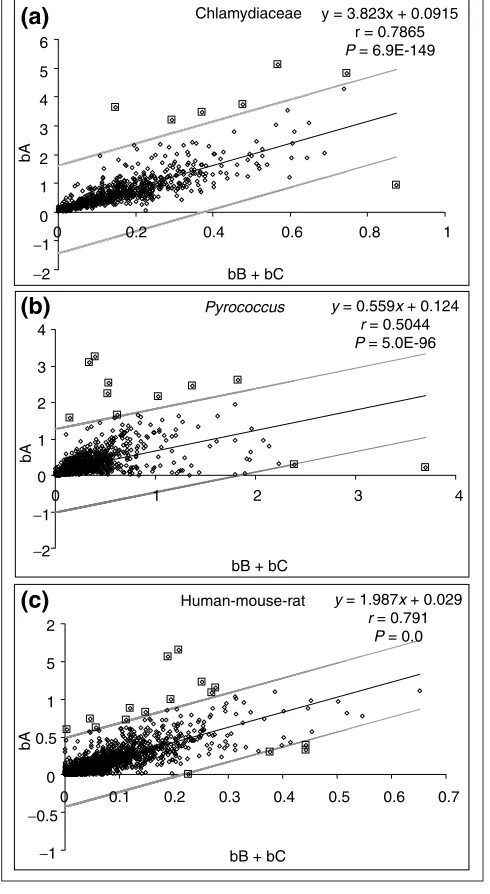
[image:2.609.56.298.489.607.2]This prediction was tested by evaluating the branch lengths estimated from alignments of orthologous protein sets of the three species groups. Consistent with the prediction, there is a highly significant positive correlation between bA and bB + bC for all three species groups (Figure 3). Thus, the vast major-ity of proteins in each analyzed group of species seem to evolve in accord with the rate-constancy prediction, suggest-ing that the functional constraints among orthologous pro-teins remain largely unchanged. However, in each group of species there are outliers (Figure 3) that do not conform to the expected pattern of variation. For each of the three groups of orthologous protein sets, upper and lower limits of the distance from the linear trend line that correspond to an expectation value of 0.05 were determined. All points above and below these lines (Figure 3) represent statistically signif-icant deviants from the linear trend, given the standard error and the number of orthologous protein sets analyzed for each group of species. Points above the upper limit line show more variation between the phylogenetic partitions (that is, longer bA) than expected by chance, and points below the lower limit line show more variation within one partition (that is, longer bB and/or bC) than expected. The majority of the deviants fall above the upper limit. These points repre-sent proteins with an accelerated rate of amino-acid substi-tution between phylogenetic partitions. The less frequent outlier points below the lower line represent proteins that have undergone accelerated evolution in one or both of the two more closely related species in the corresponding group. All of the orthologous protein sets that showed significant deviations from the linear trend were re-analyzed using Figure 1
Schematic of an orthologous protein phylogeny and the null hypothesis (Ho) of a constant relative rate of protein evolution. Comparison of multiple orthologous proteins is predicted to reveal a constant relative rate of evolution. This should be manifest as an approximately constant ratio of phylogenetic branch lengths (bold lines) bA/(bB + bC). The branch lengths were calculated using the evolutionary distances (dashed lines) between the proteins from three species (dAB, dAC, dBC) as described in Materials and methods.
bA
bC bB
A
C B
Ho: constant relative rate of protein evolution = constant bA/(bB + bC) dAB
dAC
comment
reviews
reports
deposited research
interactions
information
refereed research
BLAST similarity searches followed by phylogenetic analysis. This was done to verify that these sets contain orthologous proteins. For orthologous proteins, it is expected that they will form monophyletic clades without any intervening par-alogs or proteins from distantly related species. For all Chlamydiaceae and mammalian data, the phylogenetic analysis revealed that these sets do in fact consist of ortholo-gous proteins. However, the Pyrococcusanalysis yielded five cases where orthology could not be ascertained. These ambiguous Pyrococcus sets were removed and the linear relationship between bA and bB +bC was re-assessed. The total number of orthologous protein sets that show evidence of accelerated evolution suggestive of functional diversifica-tion is between 0.76% and 1% of the total number of such sets analyzed for each species (Chlamydiaceae = 7/703,
Pyrococcus= 11/1305, human-mouse-rat = 16/2112).
Nucleotide-substitution rates
A number of cases of positive selection at the molecular level have been supported by comparison of the rates of synony-mous (Ks) and non-synonymous (Ka) substitution [3]. Ka> Ks is considered unequivocal evidence of positive selection [2]. With this in mind, comparisons of Ksand Kawere carried out for the orthologous protein sets that showed a pattern of varia-tion consistent with funcvaria-tional diversificavaria-tion in the whole-genome test (Figure 3). For the bacterial and archaeal species groups, the vast majority of these comparisons were inconclu-sive because the evolutionary distance between phylogenetic partitions resulted in a saturation of Ks. The more closely related human-mouse-rat group did not show saturation of Ks.
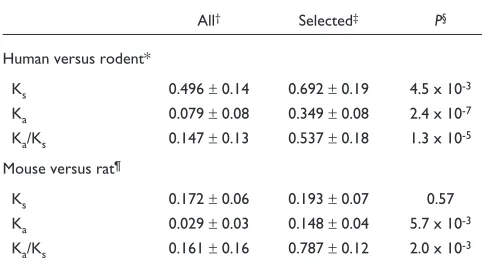
Comparisons of Ksand Kafor functionally diversified mam-malian protein sets did not reveal any cases with Ka> Ks. This is probably due to the fact that, if directional selection led to the acceleration of the amino-acid substitution rate in these pro-teins, it acted in an episodic manner [6,7] and on a minority of residues against a constant background of purifying selection [8,9]. This is consistent with previous work suggesting that adaptive changes are difficult to find using the strict Ka> Ks criterion and that even documented cases of positive selection can be missed using this technique alone [6,10-13]. The average Kais, however, significantly higher for the putative functionally diversified proteins than for the total dataset (Table 1, Figure 4). The mammalian proteins with an increased rate of amino-acid substitution between the human and rodent lin-eages also show a level of Kssignificantly higher than that of the total dataset (Table 1). This can be explained by the fact that, consistent with previous reports [10,14-17], we observe a posi-tive correlation between Ksand Ka(r= 0.556, P< 10-10). This correlation could reflect a mechanistic bias in mutation [10,18,19] or synonymous sites may be subject to some degree of selection [20-23] (or both). However, the Ka/Ksratio is also significantly higher for the sets of putative functionally diversi-fied proteins (Table 1), indicating a relative acceleration of amino-acid substitution, which could be due to a relaxation of functional constraints and/or directional selection.
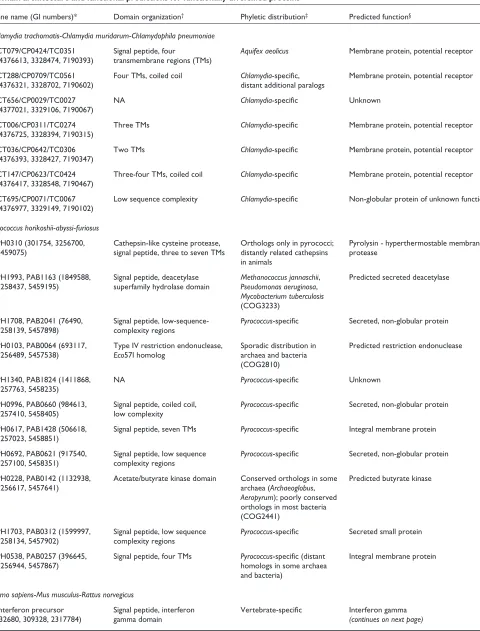
Functional prediction and phyletic distribution
[image:3.609.56.556.82.330.2]There are some notable similarities in the (predicted) func-tional identities and the phyletic distributions of the putative functionally diversified proteins (Table 2). The sets from all Figure 2
Phylogenies of the three analyzed species groups. Branch lengths are the average of all branch lengths for a given species group. The different branches bA, bB and bC are indicated.
R. norvegicus
M. musculus
H. sapiens
C. muridarum
C. trachomatis
C. pneumoniae
P. abyssi
P. horikoshii
P. furiosis
0.1
Gamma distance
bA
bA
bA
bB
bB
bB
bC
bC
three species groups are enriched for proteins that appear to function at the periphery of the cells and mediate their inter-action with the environment. Specifically, 5 of the 7 cases in Chlamydiaceae, 7 of the 11 Pyrococcus cases and 13 of the 16 mammalian cases are (predicted) membrane or secreted pro-teins (Table 2). Some of the remaining propro-teins are completely uncharacterized and could associate with membranes by other mechanisms that do not involve recognizable structural fea-tures such as signal peptides or transmembrane segments. The mammalian set of functionally diversified proteins, for which much more experimental information is available than for the bacterial and archaeal sets, is particularly enriched for secreted proteins, including several proteins involved in immune surveillance and defense (Table 2). An example of a protein that is implicated in a different class of functions, but is still related to defense mechanisms is the predicted restric-tion endonuclease from Pyrococcus. Generally, the functions of proteins for which accelerated evolution was detected and functional diversification inferred are compatible with the pre-viously reported cases of accelerated evolution which is partic-ularly prominent, for example, in the immune system [3]. Figure 3
Correlation between the branch lengths in different phylogenetic partitions. Linear regression where the bA branch length (y-axis) is plotted against the sum of bB + bC branch lengths (x-axis) for all orthologous protein sets of each species group. (a)Chlamydiaceae species group including C. pneumoniae, C. muridarumand C. trachomatis. (b)Pyrococcusspecies group including P. furiosus, P. abyssiand P. horikoshii. (c)Human-mouse-rat species group including H. sapiens, M. musculusand R. norvegicus. The equation for the linear regression trend line (y= mx+ b), the correlation coefficient (r) and the level of significance for the correlation (P) are shown on each plot. The linear regression trend line is shown in bold black and the upper and lower limits, corresponding to an expectation value of 0.05, are shown in light gray. For each plot, only 0.05 points are expected to fall outside of these limits by chance. All values are shown as diamonds and the values outside the upper and lower limits that represent functionally diversified orthologous protein sets are indicated by larger squares.
Pyrococcus y = 0.559x + 0.124 r = 0.5044 P = 5.0E-96
0 1 2 3 4
0 1 2 3 4
bB + bC
bA
Human-mouse-rat y = 1.987x + 0.029 r = 0.791
P = 0.0
0 0.5 1 5 2
0 0.1 0.2 0.3 0.4 0.5 0.6 0.7
bA
Chlamydiaceae y = 3.823x + 0.0915 r = 0.7865 P = 6.9E-149
−2
−1
−2
−1 0 1 2 3 4 5 6
0 0.2 0.4 0.6 0.8 1
bB + bC
bA
−0.5
−1 bB + bC
(a)
(b)
(c)
Figure 4Non-synonymous (Ka) versus synonymous (Ks) substitution rates for the human-mouse-rat orthologous protein sets. (a)Average Ksand Kafor the human-mouse and human-rat pairwise comparisons. (b)Ksand Kafor the mouse-rat pairwise comparisons. Thick diagonal line, Ks= Ka; thin horizontal line, average Ka. All values are shown with circles and the values corresponding to the functionally diversified proteins are indicated by larger squares.
0.6
0.25
0.2
0.15
0.1
0.05
0 0.5 0.4 0.3
Ka
Ka
0.2 0.1 0
0 0.2 0.4 0.6 0.8 1 1.2
0.4 0.3
0.2 0.1
0
Ks
Ks
Human versus rodent
(a)
[image:4.609.56.301.93.540.2]The phyletic distribution of the functionally diversified pro-teins is typically narrow, particularly in Chlamydiaceae (six of the seven proteins have no homologs outside this bacterial family). Although the selected Pyrococcus proteins showed more evolutionary conservation, the majority had orthologs only in other archaeal genomes, if not only in Pyrococcus. Similarly, 13 of the 16 selected mammalian proteins were either mammal-specific or vertebrate-specific (Table 2). The only two clear exceptions to this pattern of poorly conserved proteins primarily involved in defense and extracellular sig-naling were the mammalian enzymes hydroxysteroid sulfo-transferase and hydroxy acid oxidase. Accelerated evolution in proteins with a narrow phyletic distribution may repre-sent species-specific adaptations in how each organism responds to and processes unique environmental cues.
Conclusions
The present results show that the mode of evolution of the vast majority of the analyzed proteins from all three domains of life - bacteria, archaea and eukaryotes - is compatible with the rate-constancy prediction of molecular evolution. A recent analysis of the genome-wide distribution of the evolu-tionary rates of prokaryotic genes suggested that the shape of this distribution does not significantly change during evo-lution, although the rates themselves may change [24]. This is consistent with the present finding of a strong correlation between evolutionary rates in different phylogenetic parti-tions. However, with remarkable consistency, for all three species groups analyzed here, approximately 1% of ortholo-gous genes seem to have experienced accelerated evolution, suggesting functional and potentially adaptive diversifica-tion that is conspicuous enough to be detected at a statisti-cally significant level.
It is also a formal possibility that some of the genes identi-fied as functionally diversiidenti-fied may be losing their function. As this would entail a change in function, it can be consid-ered as a special type of functional diversification. However, two points argue against this possibility. First, the Ks/Ka values for mammalian genes are all < 1 (including the puta-tive diversified genes) and thus do not show evidence of loss of function or of pseudogenes. Second, amino-acid sequence alignments of the diversified proteins show that these pro-teins still retain the identity of critical domains, such as signal peptides and transmembrane domains, as well as crit-ical residues in the active sites of enzymes (Table 2 and data not shown).
Accelerated evolution and functional diversification between paralogs is thought to be common in evolution and is posited as a major mechanism for the generation of new genes and new biochemical functions [25]. Functional diversification between orthologs is considered to be much less common, however. In fact, directional selection leading to functional diversification between orthologs is the least common form of natural selection observed at the molecular level [3]. In the present study, the implementation of a simple test designed specifically to exploit the availability of numerous complete and partially complete genome sequences facili-tated the detection of multiple cases of probable functional diversification between orthologs. Application of this method to the growing set of complete genomes is expected to yield similar results and may reveal numerous additional cases of functionally diversified orthologs.
Materials and methods
Sequence analysisThree closely related Chlamydiaceae genomes and three closely related Pyrococcusgenomes were chosen for analysis. These genomes were chosen on the basis of three criteria. First, there were three or more closely related complete genome sequences available; second, the genomes were closely enough related to avoid saturation of amino-acid changes and to ensure unambiguous identification of orthologs; and third, the genomes were distantly enough related to provide meaningful information on amino-acid vari-ation. Predicted proteomes for three Chlamydiaceae genomes (Chlamydophila pneumoniae - CWL029, Chlamydia muri-darum and Chlamydia trachomatis) and two Pyrococcus
genomes (P. abyssiand P. horikoshii) were obtained from the National Center for Biotechnology Information (NCBI) public server [26]. The predicted proteome for the P. furiosus
genome was obtained from the sequencer’s site [27]. The method for identifying probable orthologs is based on the genome-specific best hits (BeTs) rationale that underlies the construction of the COGs database [4,5]. For each group of genomes, all-against-all BLAST [28] comparisons were done using the predicted protein sequences. For each query sequence, the BeT (highest score or lowest expectation value)
comment
reviews
reports
deposited research
interactions
information
[image:5.609.53.294.128.262.2]refereed research
Table 1
Synonymous (Ks) and non-synonymous (Ka) substitution rates for the human-mouse-rat orthologous protein sets
All† Selected‡ P§
Human versus rodent*
Ks 0.496 H0.14 0.692 H0.19 4.5 x 10⁻³
Ka 0.079 H0.08 0.349 H0.08 2.4 x 10⁻⁷
Ka/Ks 0.147 H0.13 0.537 H0.18 1.3 x 10⁻⁵
Mouse versus rat¶
Ks 0.172 H0.06 0.193 H0.07 0.57
Ka 0.029 H0.03 0.148 H0.04 5.7 x 10⁻³
Ka/Ks 0.161 H0.16 0.787 H0.12 2.0 x 10⁻³
*Average Ksand Kafor the human-mouse and human-rat pairwise comparisons. †Average and standard deviation values for all protein sets. ‡Average and standard deviation values for the protein sets identified as
having accelerated rates of amino-acid substitution. §Pvalue associated
with a t-test comparing the means of the all versus selected protein sets.
¶Average K
Table 2
Domain architecture and functional predictions for functionally diversified proteins
Gene name (GI numbers)* Domain organization† Phyletic distribution‡ Predicted function§
Chlamydia trachomatis-Chlamydia muridarum-Chlamydophila pneumoniae
CT079/CP0424/TC0351 Signal peptide, four Aquifex aeolicus Membrane protein, potential receptor (4376613, 3328474, 7190393) transmembrane regions (TMs)
CT288/CP0709/TC0561 Four TMs, coiled coil Chlamydia-specific, Membrane protein, potential receptor
(4376321, 3328702, 7190602) distant additional paralogs
CT656/CP0029/TC0027 NA Chlamydia-specific Unknown
(4377021, 3329106, 7190067)
CT006/CP0311/TC0274 Three TMs Chlamydia-specific Membrane protein, potential receptor (4376725, 3328394, 7190315)
CT036/CP0642/TC0306 Two TMs Chlamydia-specific Membrane protein, potential receptor (4376393, 3328427, 7190347)
CT147/CP0623/TC0424 Three-four TMs, coiled coil Chlamydia-specific Membrane protein, potential receptor (4376417, 3328548, 7190467)
CT695/CP0071/TC0067 Low sequence complexity Chlamydia-specific Non-globular protein of unknown function (4376977, 3329149, 7190102)
Pyrococcus horikoshii-abyssi-furiosus
PH0310 (301754, 3256700, Cathepsin-like cysteine protease, Orthologs only in pyrococci; Pyrolysin - hyperthermostable membrane 5459075) signal peptide, three to seven TMs distantly related cathepsins protease
in animals
PH1993, PAB1163 (1849588, Signal peptide, deacetylase Methanococcus jannaschii, Predicted secreted deacetylase 3258437, 5459195) superfamily hydrolase domain Pseudomonas aeruginosa,
Mycobacterium tuberculosis (COG3233)
PH1708, PAB2041 (76490, Signal peptide, low-sequence- Pyrococcus-specific Secreted, non-globular protein 3258139, 5457898) complexity regions
PH0103, PAB0064 (693117, Type IV restriction endonuclease, Sporadic distribution in Predicted restriction endonuclease 3256489, 5457538) Eco57I homolog archaea and bacteria
(COG2810)
PH1340, PAB1824 (1411868, NA Pyrococcus-specific Unknown
3257763, 5458235)
PH0996, PAB0660 (984613, Signal peptide, coiled coil, Pyrococcus-specific Secreted, non-globular protein 3257410, 5458405) low complexity
PH0617, PAB1428 (506618, Signal peptide, seven TMs Pyrococcus-specific Integral membrane protein 3257023, 5458851)
PH0692, PAB0621 (917540, Signal peptide, low sequence Pyrococcus-specific Secreted, non-globular protein 3257100, 5458351) complexity regions
PH0228, PAB0142 (1132938, Acetate/butyrate kinase domain Conserved orthologs in some Predicted butyrate kinase
3256617, 5457641) archaea (Archaeoglobus,
Aeropyrum); poorly conserved orthologs in most bacteria (COG2441)
PH1703, PAB0312 (1599997, Signal peptide, low sequence Pyrococcus-specific Secreted small protein 3258134, 5457902) complexity regions
PH0538, PAB0257 (396645, Signal peptide, four TMs Pyrococcus-specific (distant Integral membrane protein
3256944, 5457867) homologs in some archaea
and bacteria) Homo sapiens-Mus musculus-Rattus norvegicus
Interferon precursor Signal peptide, interferon Vertebrate-specific Interferon gamma
to each of the other proteomes was recorded. Triangles of mutually consistent symmetrical BeTs were detected to form COGs. Only COGs with one representative (ortholog) from each genome (COGs of size 3) were considered for further analysis. This sequence-similarity-based approach is generally not dependent on constant rates of evolution and thus is not misled by rate variation. However, it is a formal possibility that misidentification of orthologs could result from cases of extreme rate variations that would make the orthologs less
similar to each other than to some paralogs. This possibility was examined using phylogenetic analysis, as described below.
Messenger RNA sequences from R. norvegicus, Mus muscu-lus and Homo sapiens were obtained using NCBI’s batch Entrez server [29]. The encoded amino-acid sequences were clustered at 99% similarity threshold using BLASTCLUST [30] to remove redundant sequences. The BeT procedure was used to identify perfectly symmetrical COGs of size 3 for
comment
reviews
reports
deposited research
interactions
information
[image:7.609.58.554.99.547.2]refereed research
Table 2 (continued)
Gene name (GI numbers)* Domain organization† Phyletic distribution‡ Predicted function§
Homo sapiens-Mus musculus-Rattus norvegicus
Interferon-beta-2 (32674, Signal peptide, interleukin 6 domain Vertebrate-specific Interleukin 6 (interferon-beta-2) 52702, 204926)
Glycoprotein 34 (219666, Tumor necrosis factor domain, Mammal-specific OX40 ligand (membrane-associated
551081, 3779224) one TM cytokine)
Uteroglobin (23132, 49691, Signal peptide, uteroglobin domain Mammal-specific Secreted phospholipid-binding protein 206040)
Eotaxin (1280141, 995911, Signal peptide, interleukin 8 domain Vertebrate-specific Eotaxin (small inducible CxC cytokine) 1707665)
Taste receptor T2R1 (9625043, Signal peptide, seven TMs Mammal-specific Taste receptor 10048430, 7262627)
Relaxin, H2 (35927, 414781, Signal peptide, insulin-like growth Mammal-specific Relaxin 57044) factor/relaxin family domain
IgE receptor (34003, 193246, Lectin C-type domain (CTL), Orthologs only in mammals, Immunoglobulin E receptor 313673) one transmembrane segment, lectin domain in all animals
coiled coil domain
Lactadherin (1381162, 4586464, Signal peptide, epidermal growth Orthologs in mammals only, Lactadherin (secreted integrin- and 1620007) factor-like domains, coagulation discoidin domain animal-specific phospholipid-binding protein, involved in
factor 5/8 C-terminal (discoidin) antimicrobial defense) domain (2)
Secretin preproprotein Glucagon-like hormone domain Mammal-specific Secretin (11345450, 313711, 206888)
C-reactive protein (30213, 50564, Signal peptide, pentraxin/C-reactive Vertebrate-specific C-reactive protein,
phosphorylcholine-203592) protein family domain binding, involved in host defense against
bacterial infection Preproapolipoprotein AI Signal peptide, apolipoprotein Vertebrate-specific Preproapolipoprotein AI (28772, 50015, 202945) A1/A4/E family domain
EDAG-1 (7677357, 11244774, Regions of low sequence complexity Mammal-specific Unknown 11140172)
Deoxyribonuclease II beta Signal peptide, deoxyribonuclease Mammals, nematodes, insects Deoxyribonuclease (lysosomal enzyme,
(11427442, 6175550, 6470131) (animal-specific) implicated in apoptosis)
Hydroxysteroid sulfotransferase Sulfotransferase domain Animals, plants, mycobacteria Hydroxysteroid sulfotransferase (306702, 496152, 2104492)
Hydroxy acid oxidase 3 FMN-dependent oxidoreductase All eukaryotes, many bacteria Hydroxy acid oxidase (peroxisomal
(7208440, 8926328, 311833) enzyme)
*Global identifiers (Gis) for the selected orthologous protein sets. The first GI of each Pyrococcusorthologous set corresponds to the P. furiosus identifiers used at the sequencers’ site. †Domain organization was assessed using the SMART and CD-Search servers, and PSI-BLAST search results. TM,
predicted transmembrane ,-helix; NA (not applicable) indicates that no distinct domains could be identified. ‡Species or taxa in which homologs were
detected in BLAST or PSI-BLAST searches. §Functional prediction was based on the domain architecture and comparison of the results of BLAST
this species group. Because these mammalian genomes are not complete, a formal possibility exists that the COGs proce-dure will isolate non-orthologous protein sets. For this reason, two additional steps were added to the ortholog identification procedure. Subsequent to the construction of human-mouse-rat COGs and phylogenetic trees, the ‘triplet test’ [17] was used to further ensure that the COGs of size 3 contained only orthologs. The triplet test verifies that the mouse and rat members of the COGs are approximately equidistant from the human member. In addition to the triplet test, the distribu-tions of Ksbetween human and rodents and Ksbetween mouse and rat was used to eliminate potentially non-orthologous sequence sets. In both cases, the distribution of Ks was approximately normal, with the exception of long and sparsely populated tails. Sequence sets that fell in the tails of the Ks dis-tribution (Ks> 0.35 for mouse-rat and Ks> 1.0 for human-rodent) were removed before analysis to eliminate potentially non-orthologous protein sets. This manual selection process does not appear to bias the results in any way (for example, by eliminating a certain functional class of genes). Omitting this step resulted in the inclusion of a number of distantly related and poorly aligned sequence sets that may not actually include orthologs. Thus, the relative rates test as implemented for the mammalian dataset is a conservative one. Furthermore, the most rapidly evolving genes will not be included in the analy-sis as many of them will not have detectable orthologs even in closely related genomes.
Orthologous protein sequence sets were aligned using CLUSTALW [31] with default options. Alignments that resulted in any branch lengths (based on the corrected gamma distance, see below) longer than 2 in the case of the Chlamydiaceae and Pyrococcus species groups or longer than 1 in the case of the human-mouse-rat species group were visually inspected and adjusted manually. Manual adjustment included removal of poorly aligning and/or low-sequence-complexity regions identified by BLAST. These adjustments did not result in any qualitative differences in the results of subsequent analyses.
For each orthologous protein set of size 3, evolutionary dis-tances between the sequences were calculated using 3BRANCH program (Y.I.W., unpublished data, available from the author on request) that uses the distance correction based on the gamma distribution of site rate variation [32,33] with an , parameter of 1.0. Phylogenetic branch lengths were calculated from distances by solving the follow-ing set of equations (Figure 1):
distance from species A to species B (dAB) = branch length A (bA) + bB,
dAC = bA + bC, dBC = bB + bC.
For example, solving for bA yields bA = (dAB + dAC - dBC)/2.
For each orthologous gene set, pairwise estimates of the syn-onymous (Ks) and non-synonymous (Ka) substitution rates were obtained from nucleotide-coding sequence alignments using the Pamilo-Bianchi-Li method [34,35] implemented in the PBLtest program (I.B.R., unpublished data, available from the author on request). Pairwise estimates were aver-aged to obtain the data presented in Table 1.
Domain architectures of the functionally diversified proteins were assessed by using the SMART server [36,37] and the NCBI’s CD-Search server [28,38]. Domain architectures together with the results of PSI-BLAST [28] searches that were run for three iterations, Entrez protein annotation [39] and protein annotations in the COG database [5,40], were used to assign (probable) functions to the selected proteins. The phyletic distribution of these proteins was determined from the PSI-BLAST search results using the TAX_COLLEC-TOR program of the SEALS package [41]. Additional case-by-case inspection of these results was conducted and neighbor-joining phylogenetic trees [42,43] were con-structed to verify the orthologous relationships between the selected proteins. This was done by ensuring that putative orthologous proteins did not show a greater similarity to any paralogs or proteins from more distant species than they did to the proteins included in the analyzed COGs. As a result of this inspection, five Pyrococcus COGs were removed from the original set of selected proteins.
Statistical analysis
For each species set, the standard error of the predicted y -value for each x-value in the regression (Figure 3) was deter-mined. The number of standard errors away from the linear trend line that corresponds to an expectation value of 0.05 was calculated using the inverse of the standard normal cumulative distribution for a probability equal to 1 -(0.05/number of values in plot/2).
Acknowledgements
We thank Alexey Kondrashov for many helpful discussions and construc-tive criticisms, Charles DeLisi, David Landsman, Detlef Leipe, Wojciech Makalowski and Itai Yanai for critical reading of the manuscript and con-structive comments and L. Aravind for advice on protein function predic-tion. The release of the unpublished P. furiosusgenome sequence by the Utah Genome Center at the University of Utah is acknowledged and appreciated.
References
1. Kimura M, Ohta T: On some principles governing molecular evolution.Proc Natl Acad Sci USA1974, 71:2848-2852.
2. Kimura M: The Neutral Theory of Molecular Evolution, New York: Cam-bridge University Press; 1983.
3. Hughes AL: Adaptive Evolution of Genes and Genomes, Oxford: Oxford University Press; 1999.
4. Tatusov RL, Koonin EV, Lipman DJ: A genomic perspective on protein families.Science1997, 278:631-637.
5. Tatusov RL, Galperin MY, Natale DA, Koonin EV: The COG data-base: a tool for genome-scale analysis of protein functions and evolution.Nucleic Acids Res2000, 28:33-36.
7. Zhang J, Rosenberg HF, Nei M: Positive Darwinian selection after gene duplication in primate ribonuclease genes. Proc Natl Acad Sci USA1998, 95:3708-3713.
8. Goodman M, Moore GW, Matsuda G: Darwinian evolution in the genealogy of haemoglobin.Nature1975, 253:603-608. 9. Gonzalez DS, Jordan IK: The alpha-mannosidases: phylogeny
and adaptive diversification.Mol Biol Evol2000, 17:292-300. 10. Wolfe KH, Sharp PM: Mammalian gene evolution: nucleotide
sequence divergence between mouse and rat.J Mol Evol1993,
37:441-456.
11. Endo T, Ikeo K, Gojobori T: Large-scale search for genes on which positive selection may operate. Mol Biol Evol 1996,
13:685-690.
12. Sharp PM: In search of molecular Darwinism. Nature 1997,
385:111-112.
13. Yang Z, Bielawski JP: Statistical methods for detecting molecu-lar adaptation.Trends Ecol Evol2000, 15:496-503.
14. Graur D: Amino acid composition and the evolutionary rates of protein-coding genes.J Mol Evol1985, 22:53-62.
15. Mouchiroud D, Gautier C, Bernardi G: Frequencies of synony-mous substitutions in mammals are gene-specific and corre-lated with frequencies of nonsynonymous substitutions.J Mol Evol1995, 40:107-113.
16. Ohta T, Ina Y: Variation in synonymous substitution rates among mammalian genes and the correlation between syn-onymous and nonsynsyn-onymous divergences. J Mol Evol1995,
41:717-720.
17. Makalowski W, Boguski MS: Evolutionary parameters of the transcribed mammalian genome: an analysis of 2,820 orthologous rodent and human sequences.Proc Natl Acad Sci USA1998, 95:9407-9412.
18. Averof M, Rokas A, Wolfe KH, Sharp PM: Evidence for a high fre-quency of simultaneous double-nucleotide substitutions. Science2000, 287:1283-1286.
19. Williams EJ, Hurst LD: The proteins of linked genes evolve at similar rates.Nature2000, 407:900-903.
20. Miyata T, Hayashida H: Extraordinarily high evolutionary rate of pseudogenes: evidence for the presence of selective pres-sure against changes between synonymous codons.Proc Natl Acad Sci USA1981, 78:5739-5743.
21. Lipman DJ, Wilbur WJ: Interaction of silent and replacement changes in eukaryotic coding sequences. J Mol Evol 1984,
21:161-167.
22. Ticher A, Graur D: Nucleic acid composition, codon usage, and the rate of synonymous substitution in protein-coding genes.J Mol Evol1989, 28:286-298.
23. Akashi H: Synonymous codon usage in Drosophila melanogaster: natural selection and translational accuracy. Genetics1994, 136:927-935.
24. Grishin NV, Wolf YI, Koonin EV: From complete genomes to measures of substitution rate variability within and between proteins.Genome Res2000, 10:991-1000.
25. Li WH: Molecular Evolution, Sunderland, MA: Sinauer Associates; 1997.
26. National Center for Biotechnology Information Bacterial Genomes [ftp://ncbi.nlm.nih.gov/genomes/Bacteria/]
27. Utah Genome Center: P. furiosus ORF sequences
[http://www.genome.utah.edu/pfu599.pep]
28. Altschul SF, Madden TL, Schaffer AA, Zhang J, Zhang Z, Miller W, Lipman DJ: Gapped BLAST and PSI-BLAST: a new genera-tion of protein database search programs. Nucleic Acids Res 1997, 25:3389-3402.
29. Batch Entrez [http://www.ncbi.nlm.nih.gov:80/Entrez/batch.html] 30. NCBI BLAST download [ftp://ncbi.nlm.nih.gov/blast/executables/] 31. Thompson JD, Higgins DG, Gibson TJ: CLUSTAL W: improving the sensitivity of progressive multiple sequence alignment through sequence weighting, position-specific gap penalties and weight matrix choice.Nucleic Acids Res1994, 22:4673-4680. 32. Ota T, Nei M: Estimation of the number of amino acid
substi-tutions per site when the substitution rate varies among sites. J Mol Evol1994,38:469-482.
33. Grishin NV: Estimation of the number of amino-acid substitu-tions per site when the substitution rate varies among sites.
J Mol Evol1995, 41:675-679.
34. Li WH: Unbiased estimation of the rates of synonymous and nonsynonymous substitution.J Mol Evol1993, 36:96-99.
35. Pamilo P, Bianchi NO: Evolution of the Zfx and Zfy genes: rates and interdependence between the genes.Mol Biol Evol1993,
10:271-281.
36. Schultz J, Copley RR, Doerks T, Ponting CP, Bork P: SMART: a web-based tool for the study of genetically mobile domains. Nucleic Acids Res2000, 28:231-234.
37. SMART [http://smart.embl-heidelberg.de/]
38. CD-search [http://www.ncbi.nlm.nih.gov/Structure/cdd/wrpsb.cgi] 39. Entrez protein
[http://www.ncbi.nlm.nih.gov/entrez/query.fcgi?db=Protein] 40. COGs: Phylogenetic classification of proteins encoded in
complete genomes database
[http://www.ncbi.nlm.nih.gov/COG/]
41. Walker DR, Koonin EV: SEALS: a system for easy analysis of lots of sequences.Proc Int Conf Intell Syst Mol Biol1997, 5:333-339. 42. Saitou N, Nei M: The neighbor-joining method: a new method for reconstructing phylogenetic trees. Mol Biol Evol 1987,
4:406-425.
43. Thompson JD, Gibson TJ, Plewniak F, Jeanmougin F, Higgins DG:
The CLUSTAL_X windows interface: flexible strategies for multiple sequence alignment aided by quality analysis tools.
Nucleic Acids Res1997, 25:4876-4882.
comment
reviews
reports
deposited research
interactions
information