0095-1137/96/$04.0010
Copyrightq1996, American Society for Microbiology
Typing Candida albicans Oral Isolates from Human Immunodeficiency
Virus-Infected Patients by Multilocus Enzyme Electrophoresis
and DNA Fingerprinting
PATRICK BOERLIN,1FRANZISKA BOERLIN-PETZOLD,1JE´ ROˆ ME GOUDET,3CHRISTIAN DURUSSEL,1
JEAN-LUC PAGANI,2JEAN-PHILIPPE CHAVE,2ANDJACQUES BILLE1*
Institute of Microbiology1and Division of Infectious Diseases,2University Hospital, Lausanne,
and Institute of Zoology, University of Lausanne,3Lausanne, Switzerland
Received 10 October 1995/Returned for modification 9 December 1995/Accepted 9 February 1996
A total of 189Candida albicansisolates have been typed by multilocus enzyme electrophoresis. The results obtained confirm the clonal mode of reproduction ofC. albicans. TheC. albicanspopulations found in the oro-pharynx of human immunodeficiency virus (HIV)-infected patients, in the orooro-pharynx of healthy carriers, or in association with invasive candidiasis could not be distinguished. No clone or group of clones could be asso-ciated with the appearance of clinical disorders or with a reduced in vitro susceptibility to the antifungal agent fluconazole. Multiple and sequential oral isolates from 24 HIV-infected patients were also typed by restriction enzyme analysis with the enzymesEcoRI andHinfI and by use of the Ca3 repetitive probe. The results obtained by the combination of all three typing methods show that all but one patient each carried a unique majorC. albicansclone in their oropharynx. The 21 patients with sequential isolates had the sameC. albicansclones in their throats during recurrent oropharyngeal candidiasis episodes, independently of clinical status or of changes of in vitro susceptibility to fluconazole. Finally, several isolates of the sameC. albicansclone found simultaneously in the oropharynx of a patient may present different levels of susceptibility to fluconazole.
Among the numerous AIDS-associated diseases, oropharyn-geal candidiasis (OPC) is the most frequent, with up to 90% of HIV-infected patients suffering from it at one time or another (9, 47, 49). This clinical syndrome is not life-threatening, but it is painful and its recurrent nature makes it of importance for patients already fighting numerous other diseases. OPC is caused mainly by the commensal yeast Candida albicans. In spite of several studies using molecular typing methods, it is still unclear if C. albicans strains from the oral cavities of human immunodeficiency virus (HIV)-infected patients are the same as those from healthy persons (4, 13, 20, 29, 42, 53). Although most investigators have demonstrated a common clonal origin for pathogenic and commensal isolates, some of them have shown a reduced genetic diversity (42) or a change in the frequency of phenotypes or genotypes (4, 20) among pathogenic oral isolates in comparison with commensal ones. Thus, further studies are needed to clarify whether OPC-asso-ciated C. albicans represents a limited subgroup within the wider population of commensal strains. Because of its clinical efficacy and ease of use, fluconazole has become the antifungal agent of choice for the treatment of OPC (6). However, several recent reports have made the medical community aware of the development of clinical resistance to fluconazole therapy and of the appearance of resistant C. albicans isolates (34).
In order to better understand the epidemiology of OPC in AIDS and the development of resistance to fluconazole, mo-lecular typing methods have been used to analyze the C.
albi-cans strains found in OPC cases, with variable results. Some
investigators have found that the oropharynx of HIV-infected patients is colonized mostly by a unique C. albicans strain and that recurrent OPC episodes are due to the same unique strain, regardless of antifungal treatment (24, 53). Others have
re-ported that several distinct strains may simultaneously colonize the oropharynx of a patient or strain replacement may take place during the course of repeated OPC episodes in up to 45% of cases (1, 22, 28, 30, 39). Similarly, some authors found that fluconazole-susceptible and -resistant isolates from a pa-tient generally belonged to the same type (23, 24, 33, 36). Others, however, found that in a significant proportion of cases, sus-ceptible and resistant isolates from the same patient were of different types (2, 28, 39). These discrepancies may be related to methodological differences between the studies, either in the typing technique used, in the patient populations studied, or in the therapeutic protocols applied to the patients. It there-fore was of interest to investigate this problem by another tech-nique, not yet widely applied to OPC epidemiology, i.e., mul-tilocus enzyme electrophoresis (MEE) or isoenzyme typing.
Besides strain delineation MEE allows the assessment of genetic diversity and of population structures (25). This tech-nique has been widely used in bacterial epidemiology for years and was recently applied to the field of Candida epidemiology and genetics by several investigators (3, 5, 17, 31, 38). Using MEE, we first studied the diversity of C. albicans isolates from the oral cavities of HIV-infected patients in comparison with that of isolates from the oral cavities of healthy people and with C. albicans strains isolated in the course of invasive can-didiasis in HIV-negative patients. In a second step, oral C.
albicans isolates obtained during recurrent OPC episodes from
HIV-infected patients were compared by MEE, restriction en-zyme analysis (REA), and DNA fingerprinting with the repet-itive Ca3 probe (43). Finally, the susceptible and resistant C.
albicans strains isolated from several patients in connection
with the development of clinical resistance to fluconazole were examined by the same three typing methods.
MATERIALS AND METHODS
Patients.C. albicans isolates from 69 individuals were used for the present study. Oral C. albicans isolates taken from 15 persons during routine medical
* Corresponding author. Mailing address: Institute of Microbiology, rue du Bugnon 44, CH-1011 Lausanne, Switzerland. Phone: 41-21-314-4057. Fax: 41-21-314-4060.
1235
on May 15, 2020 by guest
http://jcm.asm.org/
examinations at their admission as medical personnel in our hospital in April 1993 were used as a reference population of C. albicans from healthy carriers. Oral isolates from 33 HIV-infected patients attending our university clinic be-tween June 1990 and August 1994 were used as a representative population from HIV-infected C. albicans carriers. Of these, 12 patients never had clinical signs of OPC and 21 patients had OPC at the time of one or several samplings (20 patients) or between successive sampling dates (1 patient). Yeast isolates from 21 patients suffering from invasive candidiasis between March 1983 and March 1994 were used as a sample population for pathogenic isolates originating from sites other than the oral cavity. These latter isolates were from blood (14), intravenous catheters (2) or deep infections (5).
Isolation and identification procedures.For the isolation of yeasts from nor-mally sterile sites, enrichment media (Septi-Chek blood culture bottles and thioglycolate broth; Becton Dickinson and Co., Cockeysville, Md.) and/or selec-tive medium (Sabouraud dextrose agar containing 10mg of gentamicin per ml and 100mg of chloramphenicol per ml) was inoculated with the clinical samples and incubated under aerobic conditions at 308C. Yeast cells were subcultured and isolated onto one Sabouraud dextrose agar plate with antibiotics or onto one Albicans ID plate (bioMe´rieux SA, Marcy l’Etoile, France), microscopically examined, and tested for germ tube formation in serum (16). All strains were secondarily tested on Albicans ID plates for their ability to form blue colonies typical for C. albicans on this indicator medium (27).
For the isolation of oral C. albicans from healthy persons and HIV-infected patients, a swab (Culturette; Becton Dickinson and Co.) was rubbed across the whole palate and on oropharyngeal lesions when present. For each specimen, one Sabouraud dextrose agar plate containing 10mg of gentamicin per ml and 100mg of chloramphenicol per ml and one tube of Sabouraud dextrose broth (Oxoid) with the same antibiotics were inoculated with the swabs and incubated under aerobic conditions at 308C. After 2 days of incubation, the broth was subcultured onto one Sabouraud dextrose agar plate with antibiotics or one Albicans ID plate. Phenotypically distinct yeast colonies were isolated and iden-tified as described above. Except when stated below, only one colony per sample was tested.
Yeast isolates.A total of 189 C. albicans isolates were examined and typed by one method or several methods. All the isolates were coded and blindly submit-ted for typing. All 15 healthy carriers and 21 patients with invasive candidiasis are represented by a single isolate. Among the 33 HIV-infected patients, 9 patients were represented by a single oral isolate and 24 by multiple oral isolates.
The 24 HIV-infected patients with multiple isolates were represented by 2 to 23 isolates (median, three oral isolates per HIV-infected patient). Three of these HIV-infected patients never had signs of OPC and had never received any fluconazole therapy. They are represented by 5, 10, and 10 C. albicans isolates, originating from distinct colonies on plates directly inoculated with a unique clinical sample without a previous enrichment step. Six of the 24 HIV-infected patients with multiple isolates are represented by single and multiple simulta-neous isolates from successive samples (12 samples with two to eight isolates per sample). The remaining 15 of the 24 HIV-infected patients with multiple isolates are represented by single successive isolates. Thus, a total of 21 HIV-infected patients are represented by isolates from successive samples, and the interval between the first and the last samples ranged from 39 to 1,374 days (median, 263 days).
Testing of susceptibility to fluconazole.The in vitro susceptibility to flucon-azole of all isolates was tested by an agar disk diffusion method described elsewhere (50). Results obtained with this method have been previously shown to correlate with those obtained by classical MIC broth dilution testing (7). On the basis of correlation with clinical response, the cutoff value separating susceptible from resistant isolates was set at an inhibition zone diameter of 25 mm (50).
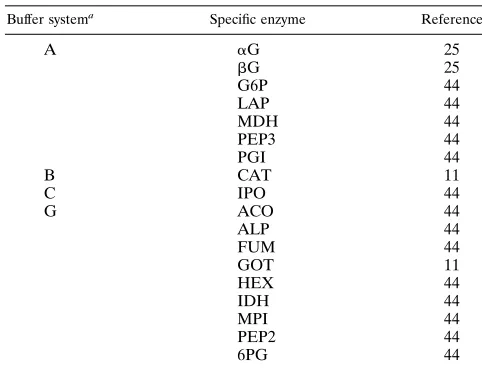
MEE.Yeast isolates were grown overnight at 358C on brain heart infusion agar (Difco, Detroit, Mich.) (eight plates per strain), scraped, and washed once in 0.9% NaCl. They were resuspended in 1.8 ml of lysate buffer (44) and subjected twice to ultrasound treatment for 40 s by using a microtip on a Soniprep 150 sonicator (Zivy SA, Oberwil, Switzerland) with maximal power and an amplitude of 18mm. All the manipulations were made on an ice-water cooling bath. The resulting lysates were centrifuged for 30 min at 12,0003g at 48C, and the supernatants were frozen in aliquots at2808C until use. Electrophoresis in starch gels was performed as described by Selander and coworkers (44). The 18 specific enzyme staining procedures and the corresponding buffer systems used are shown in Table 1. Bands on the gels were numbered in order of decreasing mobility. Each unique combination of electrophoretic migration patterns for the 18 loci examined results in an electrophoretic type (ET). The ETs were num-bered arbitrarily without any relation to genetic relatedness. When possible, the allelic composition at the corresponding loci was determined according to gen-eral rules commonly accepted for diploid organisms (11, 25, 26).
Discriminatory power.The ability of MEE to discriminate between epidemi-ologically unrelated strains was assessed by use of Simpson’s index of diversity (15). For this purpose, one isolate per patient was considered representative, except for one patient, who carried two clearly distinct strains. In three other cases with two ETs per patient differing for one or two alleles, only the predom-inant type was considered.
Cluster analysis.By using the NTSYS-PC program (Applied Biostatistics, Inc., Setauket, N.Y.), the similarity between ETs was expressed as the Dice coefficient of similarity based on the allele composition at the 16 genetic loci, allowing a
clear allelic interpretation of the migration patterns. To visualize the relation-ships between ETs, a dendrogram was built using the unweighted pair-group method with arithmetic averages (UPGMA method) based on the matrix of Dice coefficients.
Statistical analysis of MEE results.Allele frequencies at each locus, genetic diversity (calculated as
121/K
O
L51
K
O
i51
a
pi2,
where K is the number of loci and p is the frequency of the ith allele [54]), and observed and expected heterozygosity under Hardy-Weinberg equilibrium (12) were calculated by using the program FSTAT V-1.2 (10). Departure from ran-dom mating (12) was assessed within and among samples by means of Wright’s fixation indices Fisand Fst, estimated by the method of Weir and Cockerham
(55). Fixation indices Fisand Fstwere tested per locus and overall for departure
from 0 by using permutation procedures (10). Genotypic linkage disequilibria (54) expected in the case of a clonal mode of reproduction were tested with the program GENEPOP V-1.2 (32). For all these tests, only one representative isolate per patient was used, except for the patient with two clearly distinct types mentioned above.
REA.DNAs of the C. albicans strains were extracted by the method of Millon and coworkers (23). Five micrograms of DNA of each strain was digested for 3 to 4 h at 378C with 15 U of the restriction enzyme EcoRI or HinfI (GIBCO-BRL, Life Technologies, Inc., Gaithersburg, Md., and Biofinex, Praroman, Switzer-land, respectively) under the conditions prescribed by the manufacturers. The digested DNA was electrophoresed in 0.7% agarose gels containing 0.5mg of ethidium bromide per ml in 13Tris-borate-EDTA (TBE) buffer at 3 V/cm for 16 to 18 h at approximately 108C. Patterns were read visually and confirmed by putting representative isolates side by side on the same gels.
Southern blot and DNA hybridization.The same procedure as for REA was used for electrophoresis of EcoRI-digested genomic DNA, except that 13 Tris-acetate-EDTA (TAE) buffer was used instead of TBE. Electrophoresis was halted when the bromphenol blue marker had migrated approximately 18 cm. Transfer was done by vacuum blotting using a GeneScreen plus Membrane (DuPont, Biotechnology Systems, Boston, Mass.) after depurination of the DNA.
l Ca3 DNA (43) was prepared from a liquid lysate with alkit (Qiagen, Chatsworth, Calif.) and radioactively labeled with32
P by nick translation with a kit from Amersham (Amersham International plc, Little Chalfont, Buckingham-shire, England). Prehybridizations and hybridizations (overnight) were done at 658C in 53SSPE (13SSPE is 0.15 M NaCl, 10 mM NaH2PO4, and 1 mM EDTA
[image:2.612.313.554.90.275.2][pH 7.4]) containing 5% dextran sulfate and 0.3% sodium dodecyl sulfate (SDS). The membranes were washed four times for 30 min each at 488C in 23SSPE containing 0.2% SDS. Kodak XAR5 films (Eastman Kodak Company, Roches-ter, N.Y.) were used for revelation of the hybridization patterns. Alternatively, a nonradioactively labeled probe was prepared with a RENAISSANCE random primer fluorescein dUTP labeling kit (DuPont, NEN, Boston, Mass.) and EcoRI-digested DNA from lCa3. In this case, a nucleic acid chemiluminescence reagent from the same manufacturer was used to reveal the hybridization pat-terns.
TABLE 1. Electrophoresis buffers and specific enzyme staining procedures for MEE
Buffer systema Specific enzyme Reference
A aG 25
bG 25
G6P 44
LAP 44
MDH 44
PEP3 44
PGI 44
B CAT 11
C IPO 44
G ACO 44
ALP 44 FUM 44 GOT 11 HEX 44 IDH 44 MPI 44 PEP2 44 6PG 44
aFor composition, see reference 44.
on May 15, 2020 by guest
http://jcm.asm.org/
RESULTS
MEE patterns.The results of MEE typing are summarized in Table 2. Each migration pattern was coded in order to be representative of its allelic interpretation. For example, a code of 2,2 for glucose 6-phosphate dehydrogenase (G6P) corre-sponds to a homozygote for allele 2, whereas a code of 2,5 represents a heterozygote with alleles 2 and 5 at this locus. Among the 18 enzymes examined, two (isocitrate dehydroge-nase [IDH] and indophenol oxidase [IPO]) showed monomor-phic patterns for the 189 C. albicans isolates tested (Table 2).
[image:3.612.58.555.79.572.2]The number of migration patterns (electromorphs) per en-zyme ranged from 1 to 15 (mean, 5.2). Three enen-zymes pre-sented a few strains with no demonstrable activity (alkaline phosphatase [ALP], b-glucosidase [bG], and leucyl-proline peptidase [PEP3]). Five enzymes showed three distinct bands for heterozygotes compatible with a dimeric structure (glutam-ic-oxalacetic transaminase [GOT], G6P, malate dehydrogenase [MDH], PEP3, and phosphoglucose isomerase [PGI]), where-as nine other enzymes (aconitwhere-ase [ACO], ALP,bG, catalase [CAT], fumarase [FUM], IDH, leucine aminopeptidase [LAP],
TABLE 2. Allele and electromorph compositions of the 52 ETs from 189 C. albicans isolatesa
ET ACO aG ALP bG CAT FUM GOT G6P IDH LAP MDH MPI PEP2 PEP3 PGI 6PG HEX IPO
1 3,3 2,2 2,2 4,4 3,3 1,3 1,1 5,5 1,2 3,4 1,1 2,6 6,6 3,3 3,3 2,2 7 1
2 3,3 2,2 2,2 4,4 3,3 1,3 1,1 5,5 1,2 3,3 1,1 2,6 1,7 3,3 3,3 2,2 7 1
3 3,3 2,2 2,2 4,6 3,3 1,3 1,1 2,2 1,2 3,3 1,5 2,6 3,6 5,5 3,3 2,2 2 1
4 3,3 2,2 2,2 4,4 3,3 1,3 1,1 5,5 1,2 3,3 1,5 6,6 6,6 5,5 3,3 2,2 9 1
5 3,3 2,2 2,2 4,4 3,3 1,3 1,1 5,5 1,2 3,3 1,1 6,6 6,6 3,3 3,3 2,2 7 1
6 3,3 2,2 2,2 2,5 3,3 1,3 1,1 2,5 1,2 3,3 1,1 2,6 3,3 0,0 3,3 2,2 9 1
7 3,3 1,1 1,5 4,4 3,3 1,3 1,1 2,5 1,2 3,3 1,1 2,6 6,8 3,3 3,3 2,2 9 1
8 3,3 1,1 5,5 7,7 3,3 1,3 1,1 2,2 1,2 3,3 1,1 1,3 3,10 2,2 3,3 2,2 2 1
9 3,3 1,1 5,5 1,1 3,3 1,3 1,1 2,5 1,2 2,2 1,1 6,6 6,6 3,3 3,3 2,2 4 1
10 3,3 1,1 5,5 4,6 3,3 1,3 1,1 2,5 1,2 3,4 1,1 4,6 3,6 3,5 3,3 2,2 8 1
11 3,3 1,1 5,5 2,4 3,3 1,3 1,1 2,5 1,2 3,3 1,1 6,8 6,6 2,3 3,3 2,2 4 1
12 3,3 1,1 3,3 2,2 3,3 1,3 1,1 5,5 1,2 3,3 1,5 3,6 6,10 4,5 1,3 2,2 9 1
13 3,3 2,2 2,2 4,4 3,4 1,3 1,1 5,5 1,2 3,4 1,1 2,6 6,6 3,3 3,3 2,2 7 1
14 3,3 2,2 2,2 4,4 3,3 1,3 1,1 5,5 1,2 3,4 1,1 2,2 3,6 3,3 3,3 2,2 7 1
15 3,3 2,2 3,3 4,4 3,3 1,3 1,1 2,5 1,2 3,3 1,1 2,3 3,8 2,3 3,3 2,2 9 1
16 3,3 2,2 2,2 9,9 3,3 1,3 1,1 5,5 1,2 3,3 1,1 4,4 9,11 3,3 3,3 2,2 9 1
17 3,3 2,2 3,3 4,4 3,3 1,3 1,1 2,5 1,2 3,3 1,1 2,2 3,8 2,3 3,3 2,2 3 1
18 3,3 1,1 3,3 4,4 3,3 1,3 1,1 2,5 1,2 3,3 1,1 6,7 4,4 3,5 3,3 2,2 3 1
19 3,4 1,1 5,5 2,4 3,3 1,3 1,1 2,5 1,2 3,3 1,1 6,8 6,6 2,3 3,3 2,2 4 1
20 3,3 2,2 2,2 9,9 3,3 1,3 1,1 5,5 1,2 3,3 1,1 4,4 11,11 3,3 3,3 2,2 9 1
21 3,3 3,3 3,3 2,2 3,3 1,3 1,1 2,5 1,2 3,5 1,1 2,4 8,9 2,3 3,3 2,2 3 1
22 3,3 2,2 3,3 4,4 3,3 1,3 1,1 2,5 1,2 3,3 1,1 2,3 3,8 2,2 3,3 2,2 3 1
23 3,3 2,2 4,4 2,5 3,3 1,3 1,1 5,5 1,2 3,3 1,1 6,6 4,6 2,5 3,3 2,2 9 1
24 3,3 2,2 2,2 4,4 3,3 1,3 1,1 5,5 1,2 3,4 1,1 2,6 6,6 3,3 3,3 2,2 9 1
25 3,3 2,2 3,3 4,4 3,3 1,3 1,1 2,5 1,2 3,3 1,1 2,3 3,8 2,3 3,3 2,2 5 1
26 3,3 3,3 3,3 4,4 3,3 2,4 1,1 2,5 1,2 3,3 1,1 2,3 3,8 2,2 3,3 2,2 3 1
27 3,3 1,1 0,0 2,4 3,3 1,3 1,1 2,5 1,2 3,3 1,1 6,8 6,6 3,3 3,3 2,2 4 1
28 2,3 1,1 3,3 4,4 3,3 1,3 1,1 2,5 1,2 3,3 1,1 2,6 6,8 3,3 3,3 2,2 9 1
29 3,3 2,2 3,3 4,4 3,3 1,3 1,1 2,5 1,2 3,3 1,1 2,3 3,3 2,2 3,3 2,2 9 1
30 3,3 1,1 5,5 3,5 3,3 1,3 1,1 2,5 1,2 3,4 1,1 4,6 4,6 3,5 3,3 2,2 6 1
31 3,3 1,1 5,5 2,4 3,3 1,3 1,1 2,5 1,2 3,3 1,1 6,8 6,6 3,3 3,3 2,2 4 1
32 3,3 1,1 3,3 1,1 3,3 1,3 1,1 5,5 1,2 3,3 1,1 4,6 6,6 3,5 3,3 2,2 9 1
33 3,3 2,2 5,5 4,4 3,3 1,3 1,1 5,5 1,2 3,4 1,5 2,6 6,6 5,5 3,3 2,2 10 1
34 3,3 2,2 5,5 8,8 3,3 1,3 1,1 2,2 1,2 3,3 1,1 1,3 3,10 2,2 3,3 2,2 2 1
35 3,3 2,2 2,2 4,4 3,3 1,3 1,1 5,5 1,2 3,4 1,1 6,6 6,6 3,3 3,3 2,2 9 1
36 3,3 2,2 2,2 4,4 3,3 1,3 1,1 5,5 1,2 3,4 1,1 2,6 2,7 3,3 3,3 2,2 7 1
37 3,3 1,1 3,3 0,0 3,3 1,3 1,1 5,5 1,2 3,3 1,1 4,6 6,6 3,5 3,3 2,2 9 1
38 3,3 1,1 5,5 9,9 3,3 1,3 1,1 2,5 1,2 3,4 1,1 4,6 4,6 3,5 3,3 2,2 6 1
39 3,3 2,2 5,5 4,4 3,3 1,3 1,1 1,5 1,2 3,3 1,1 2,3 3,8 3,3 3,3 2,2 1 1
40 3,3 3,3 3,3 3,5 3,3 1,3 1,1 2,5 1,2 3,3 1,1 3,6 3,8 2,2 3,3 2,2 9 1
41 3,3 1,1 3,3 4,4 3,3 1,3 1,1 5,5 1,2 3,3 1,1 6,6 6,6 3,3 3,3 1,1 9 1
42 3,3 2,2 2,2 4,4 3,3 1,3 1,1 5,5 1,2 3,3 1,1 2,6 6,6 3,3 3,3 2,2 7 1
43 3,3 2,2 3,3 4,4 3,3 1,3 1,3 5,5 1,2 3,3 5,5 6,6 2,7 5,5 3,3 2,2 9 1
44 3,3 2,2 5,5 7,7 3,3 1,3 1,1 2,2 1,2 3,3 1,1 1,3 10,10 2,2 3,3 2,2 2 1
45 3,3 2,2 3,3 4,4 3,3 1,3 1,1 5,5 1,2 3,5 1,1 3,6 6,6 5,5 3,3 2,2 9 1
46 3,3 1,1 2,2 1,1 3,3 1,3 1,1 2,5 1,2 3,3 1,1 6,8 6,6 2,2 3,3 2,2 4 1
47 3,3 2,2 5,5 4,4 3,3 1,3 1,1 2,2 1,2 3,3 1,1 2,3 4,6 2,3 3,3 2,2 2 1
48 3,3 2,2 6,6 4,4 3,3 1,3 1,1 5,5 1,2 3,4 1,1 2,6 6,6 3,3 3,3 2,2 7 1
49 3,3 2,2 2,2 4,4 3,3 1,3 1,1 5,5 1,2 1,3 1,1 4,5 6,6 3,3 3,3 2,2 9 1
50 3,3 1,1 4,4 9,9 3,3 1,3 1,1 2,5 1,2 3,4 1,1 4,6 4,6 5,5 3,3 2,2 6 1
51 3,3 1,1 5,5 6,8 3,3 1,3 1,1 5,5 1,2 1,3 1,1 3,6 3,3 3,5 3,3 2,2 7 1
52 3,3 1,1 3,3 0,0 3,3 1,3 1,1 5,5 1,2 3,3 1,1 6,6 6,6 3,5 3,3 2,2 9 1
aNumbers separated by a comma represent alleles at the corresponding loci (for example, the code 5,5 for G6P in ET52 means that isolates of this ET were
homozygous for allele 2, whereas code 2,5 of ET50 corresponds to a heterozygote genotype with alleles 2 and 5). For the enzymes HEX and IPO, no interpretation of the migration profiles at the allele level was possible, and the numbers represent the migration pattern as a whole.
on May 15, 2020 by guest
http://jcm.asm.org/
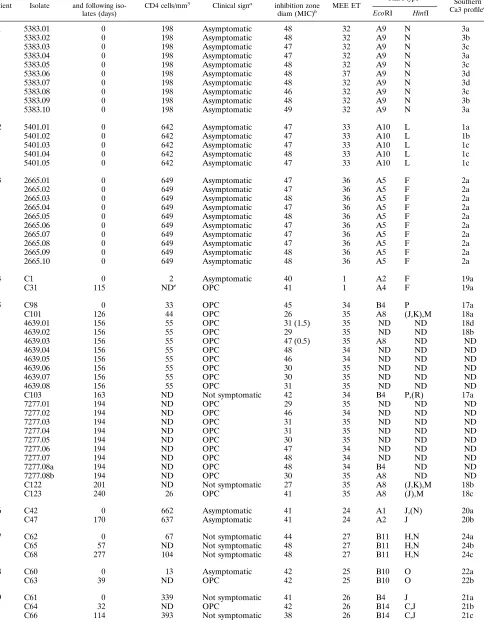
TABLE 3. Typing results for multiple oral C. albicans isolates from 24 HIV-infected patients
Patient Isolate
Interval between first and following
iso-lates (days)
CD4 cells/mm3
Clinical signa Fluconazole
inhibition zone
diam (MIC)b MEE ET
REA typec
Southern Ca3 profiled
EcoRI HinfI
1 5383.01 0 198 Asymptomatic 48 32 A9 N 3a
5383.02 0 198 Asymptomatic 48 32 A9 N 3b
5383.03 0 198 Asymptomatic 47 32 A9 N 3c
5383.04 0 198 Asymptomatic 47 32 A9 N 3a
5383.05 0 198 Asymptomatic 48 32 A9 N 3c
5383.06 0 198 Asymptomatic 48 37 A9 N 3d
5383.07 0 198 Asymptomatic 48 32 A9 N 3d
5383.08 0 198 Asymptomatic 46 32 A9 N 3c
5383.09 0 198 Asymptomatic 48 32 A9 N 3b
5383.10 0 198 Asymptomatic 49 32 A9 N 3a
2 5401.01 0 642 Asymptomatic 47 33 A10 L 1a
5401.02 0 642 Asymptomatic 47 33 A10 L 1b
5401.03 0 642 Asymptomatic 47 33 A10 L 1c
5401.04 0 642 Asymptomatic 48 33 A10 L 1c
5401.05 0 642 Asymptomatic 47 33 A10 L 1c
3 2665.01 0 649 Asymptomatic 47 36 A5 F 2a
2665.02 0 649 Asymptomatic 47 36 A5 F 2a
2665.03 0 649 Asymptomatic 48 36 A5 F 2a
2665.04 0 649 Asymptomatic 47 36 A5 F 2a
2665.05 0 649 Asymptomatic 48 36 A5 F 2a
2665.06 0 649 Asymptomatic 47 36 A5 F 2a
2665.07 0 649 Asymptomatic 47 36 A5 F 2a
2665.08 0 649 Asymptomatic 47 36 A5 F 2a
2665.09 0 649 Asymptomatic 48 36 A5 F 2a
2665.10 0 649 Asymptomatic 48 36 A5 F 2a
4 C1 0 2 Asymptomatic 40 1 A2 F 19a
C31 115 NDe OPC 41 1 A4 F 19a
5 C98 0 33 OPC 45 34 B4 P 17a
C101 126 44 OPC 26 35 A8 (J,K),M 18a
4639.01 156 55 OPC 31 (1.5) 35 ND ND 18d
4639.02 156 55 OPC 29 35 ND ND 18b
4639.03 156 55 OPC 47 (0.5) 35 A8 ND ND
4639.04 156 55 OPC 48 34 ND ND ND
4639.05 156 55 OPC 46 34 ND ND ND
4639.06 156 55 OPC 30 35 ND ND ND
4639.07 156 55 OPC 30 35 ND ND ND
4639.08 156 55 OPC 31 35 ND ND ND
C103 163 ND Not symptomatic 42 34 B4 P,(R) 17a
7277.01 194 ND OPC 29 35 ND ND ND
7277.02 194 ND OPC 46 34 ND ND ND
7277.03 194 ND OPC 31 35 ND ND ND
7277.04 194 ND OPC 31 35 ND ND ND
7277.05 194 ND OPC 30 35 ND ND ND
7277.06 194 ND OPC 47 34 ND ND ND
7277.07 194 ND OPC 48 34 ND ND ND
7277.08a 194 ND OPC 48 34 B4 ND ND
7277.08b 194 ND OPC 30 35 A8 ND ND
C122 201 ND Not symptomatic 27 35 A8 (J,K),M 18b
C123 240 26 OPC 41 35 A8 (J),M 18c
6 C42 0 662 Asymptomatic 41 24 A1 J,(N) 20a
C47 170 637 Asymptomatic 41 24 A2 J 20b
7 C62 0 67 Not symptomatic 44 27 B11 H,N 24a
C65 57 ND Not symptomatic 48 27 B11 H,N 24b
C68 277 104 Not symptomatic 48 27 B11 H,N 24c
8 C60 0 13 Asymptomatic 42 25 B10 O 22a
C63 39 ND OPC 42 25 B10 O 22b
9 C61 0 339 Not symptomatic 41 26 B4 J 21a
C64 32 ND OPC 42 26 B14 C,J 21b
C66 114 393 Not symptomatic 38 26 B14 C,J 21c
Continued on following page
on May 15, 2020 by guest
http://jcm.asm.org/
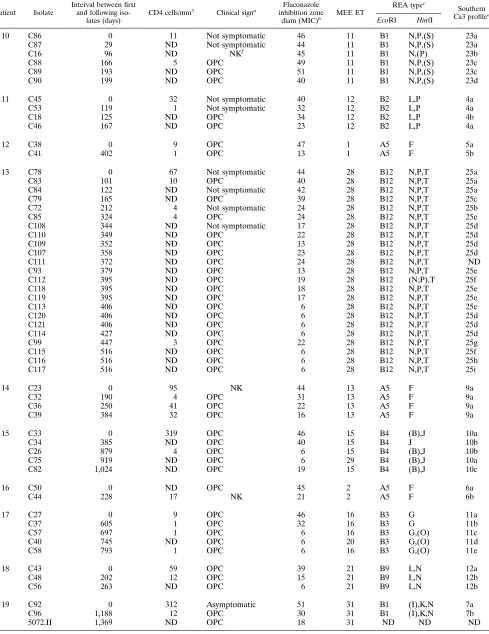
TABLE 3—Continued
Patient Isolate
Interval between first and following
iso-lates (days)
CD4 cells/mm3
Clinical signa Fluconazole
inhibition zone
diam (MIC)b MEE ET
REA typec
Southern Ca3 profiled
EcoRI HinfI
10 C86 0 11 Not symptomatic 46 11 B1 N,P,(S) 23a
C87 29 ND Not symptomatic 44 11 B1 N,P,(S) 23a
C16 96 ND NKf 45 11 B1 N,(P) 23b
C88 166 5 OPC 49 11 B1 N,P,(S) 23c
C89 193 ND OPC 51 11 B1 N,P,(S) 23c
C90 199 ND OPC 40 11 B1 N,P,(S) 23d
11 C45 0 32 Not symptomatic 40 12 B2 L,P 4a
C53 119 1 Not symptomatic 32 12 B2 L,P 4a
C18 125 ND OPC 34 12 B2 L,P 4b
C46 167 ND OPC 23 12 B2 L,P 4a
12 C38 0 9 OPC 47 1 A5 F 5a
C41 402 1 OPC 13 1 A5 F 5b
13 C78 0 67 Not symptomatic 44 28 B12 N,P,T 25a
C83 101 10 OPC 40 28 B12 N,P,T 25a
C84 122 ND Not symptomatic 42 28 B12 N,P,T 25a
C79 165 ND OPC 39 28 B12 N,P,T 25c
C72 212 4 Not symptomatic 24 28 B12 N,P,T 25b
C85 324 4 OPC 24 28 B12 N,P,T 25e
C108 344 ND Not symptomatic 17 28 B12 N,P,T 25d
C110 349 ND OPC 22 28 B12 N,P,T 25d
C109 352 ND OPC 13 28 B12 N,P,T 25d
C107 358 ND OPC 23 28 B12 N,P,T 25d
C111 372 ND OPC 24 28 B12 N,P,T ND
C93 379 ND OPC 13 28 B12 N,P,T 25e
C112 395 ND OPC 19 28 B12 (N;P),T 25f
C118 395 ND OPC 18 28 B12 N,P,T 25e
C119 395 ND OPC 17 28 B12 N,P,T 25e
C113 406 ND OPC 6 28 B12 N,P,T 25e
C120 406 ND OPC 6 28 B12 N,P,T 25d
C121 406 ND OPC 6 28 B12 N,P,T 25d
C114 427 ND OPC 6 28 B12 N,P,T 25d
C99 447 3 OPC 22 28 B12 N,P,T 25g
C115 516 ND OPC 6 28 B12 N,P,T 25f
C116 516 ND OPC 6 28 B12 N,P,T 25h
C117 516 ND OPC 6 28 B12 N,P,T 25i
14 C23 0 95 NK 44 13 A5 F 9a
C32 190 4 OPC 31 13 A5 F 9a
C36 250 41 OPC 22 13 A5 F 9a
C39 384 32 OPC 16 13 A5 F 9a
15 C33 0 319 OPC 46 15 B4 (B),J 10a
C34 385 ND OPC 40 15 B4 J 10b
C26 879 4 OPC 6 15 B4 (B),J 10b
C75 919 ND OPC 6 29 B4 (B),J 10a
C82 1,024 ND OPC 19 15 B4 (B),J 10c
16 C50 0 ND OPC 45 2 A5 F 6a
C44 228 17 NK 21 2 A5 F 6b
17 C27 0 9 OPC 46 16 B3 G 11a
C37 605 1 OPC 32 16 B3 G 11b
C57 697 1 OPC 6 16 B3 G,(O) 11c
C40 745 ND OPC 6 20 B3 G,(O) 11d
C58 793 1 OPC 6 16 B3 G,(O) 11e
18 C43 0 59 OPC 39 21 B9 L,N 12a
C48 202 12 OPC 15 21 B9 L,N 12b
C56 263 ND OPC 6 21 B9 L,N 12b
19 C92 0 312 Asymptomatic 51 31 B1 (I),K,N 7a
C96 1,188 12 OPC 30 31 B1 (I),K,N 7b
5072.II 1,369 ND OPC 18 31 ND ND ND
Continued on following page
on May 15, 2020 by guest
http://jcm.asm.org/
mannose phosphate isomerase [MPI], and leucyl-glycyl-glycin peptidase [PEP2]) showed two bands for heterozygotes and were considered monomeric. For two enzymes (a-glucosidase [aG] and 6-phosphogluconate dehydrogenase [6PG]), only sin-gle bands were observed under the electrophoresis conditions used and no conclusions concerning their structure could be drawn.
Fifty-two different combinations of electromorphs (ETs) were observed among the 18 enzyme loci tested (Table 2). One ET (ET1) was observed for 14 different patients, another ET (ET11) was observed for 3 patients, and six ETs (ET2, ET8, ET24, ET31, ET34, and ET44) were observed for 2 patients each (Table 3). The remaining 44 ETs were found for single patients only. Among the 24 HIV-infected patients with mul-tiple isolates, only 4 showed more than one ET (two ETs each; Table 3). In three of these four cases (patients 1, 15, and 17), the ETs found for each patient differed in only one (ETs 16 and 20) or two (ETs 32 and 37 and ETs 15 and 29) alleles. None of these differences were confirmed by the two other typing methods (Table 3). For the fourth patient with two ETs
(patient 5), differences were observed for 15 alleles and the strains were also clearly distinguished by the other methods.
Genetic diversity.For the 16 enzyme loci interpreted at the allele level (IPO and hexokinase [HEX] were not interpret-able), the number of alleles per locus ranged from 1 to 10 (mean number of alleles per locus, 4.3). The effective number of alleles, however, varies between 1 and 4. The genetic diver-sity is an index of the quantity of polymorphism at the loci studied (54). It is 0 for monomorphic loci and closer to 1 for highly polymorphic loci. The overall genetic diversity was 0.35, with the different polymorphic loci ranging from 0.014 to 0.723. Six of the 16 loci had one major allele at a frequency of.95% (ACO, CAT, GOT, MDH, PGI, and 6PG). This left us with 10 polymorphic loci (Table 4). The number of alleles per locus, effective number of alleles, and genetic diversity among indi-viduals for these 10 loci as well as overall are presented in Table 4.
Expected and observed frequencies of heterozygotes. Depar-ture from random mating was tested by using the fixation index
[image:6.612.61.555.82.425.2]Fisas a statistic: an Fisof 0 means that there is no departure
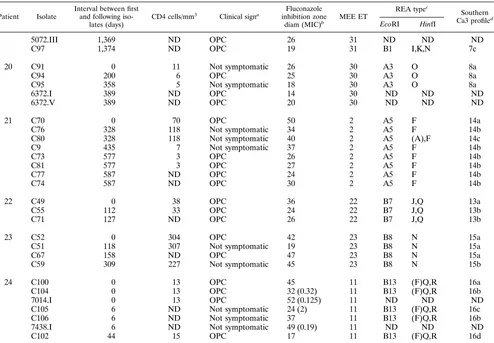
TABLE 3—Continued
Patient Isolate
Interval between first and following
iso-lates (days)
CD4 cells/mm3
Clinical signa Fluconazole
inhibition zone
diam (MIC)b MEE ET
REA typec
Southern Ca3 profiled
EcoRI HinfI
5072.III 1,369 ND OPC 26 31 ND ND ND
C97 1,374 ND OPC 19 31 B1 I,K,N 7c
20 C91 0 11 Not symptomatic 26 30 A3 O 8a
C94 200 6 OPC 25 30 A3 O 8a
C95 358 5 Not symptomatic 18 30 A3 O 8a
6372.I 389 ND OPC 14 30 ND ND ND
6372.V 389 ND OPC 20 30 ND ND ND
21 C70 0 70 OPC 50 2 A5 F 14a
C76 328 118 Not symptomatic 34 2 A5 F 14b
C80 328 118 Not symptomatic 40 2 A5 (A),F 14c
C9 435 7 Not symptomatic 37 2 A5 F 14b
C73 577 3 OPC 26 2 A5 F 14b
C81 577 3 OPC 27 2 A5 F 14b
C77 587 ND OPC 24 2 A5 F 14b
C74 587 ND OPC 30 2 A5 F 14b
22 C49 0 38 OPC 36 22 B7 J,Q 13a
C55 112 33 OPC 24 22 B7 J,Q 13b
C71 127 ND OPC 26 22 B7 J,Q 13b
23 C52 0 304 OPC 42 23 B8 N 15a
C51 118 307 Not symptomatic 19 23 B8 N 15a
C67 158 ND OPC 47 23 B8 N 15a
C59 309 227 Not symptomatic 45 23 B8 N 15b
24 C100 0 13 OPC 45 11 B13 (F)Q,R 16a
C104 0 13 OPC 32 (0.32) 11 B13 (F)Q,R 16b
7014.I 0 13 OPC 52 (0.125) 11 ND ND ND
C105 6 ND Not symptomatic 24 (2) 11 B13 (F)Q,R 16c
C106 6 ND Not symptomatic 37 11 B13 (F)Q,R 16b
7438.I 6 ND Not symptomatic 49 (0.19) 11 ND ND ND
C102 44 15 OPC 17 11 B13 (F)Q,R 16d
aAsymptomatic, without OPC signs at the time of sampling or earlier; not symptomatic, having had OPC episodes earlier but not having symptoms at the time of
the corresponding sampling; OPC, having OPC signs at the time of sampling.
b
The inhibition zone diameters (in millimeters) were obtained with the agar disk diffusion test, and the values in parentheses are MICs (in micrograms per milliliter) obtained by E-test.
c
For the types obtained with the enzyme EcoRI, each combination of one letter and one number represents a different migration profile. For the types obtained with the enzyme HinfI, each letter or combination of letters corresponds to a different migration profile; for the profiles obtained with HinfI, parentheses represent differences related to bands of weak intensity.
d
For the Ca3 hybridization profiles, the letters represent the variants of the main types (numbers) described in the text.
e
ND, not determined.
f
NK, not known.
on May 15, 2020 by guest
http://jcm.asm.org/
from random mating, an Fisof.0 means that there is a deficit of heterozygotes, and a negative Fismeans an excess of het-erozygotes. Of the 10 polymorphic loci, 5 showed a highly significant deficit of heterozygotes (aG, ALP,bG, PEP2, and PEP3) and 3 showed a highly significant excess (FUM, IDH, and MPI). For IDH, the only observed genotype was 1,2, and for FUM, all the observed genotypes were 1,3 heterozygotes apart from one ET with genotype 2,4 (Table 2). On the other hand, not a single heterozygote at theaG locus was observed, and all but one genotype were homozygotes at ALP. Only two polymorphic loci did not show departure from Hardy-Wein-berg equilibrium (G6P, LAP).
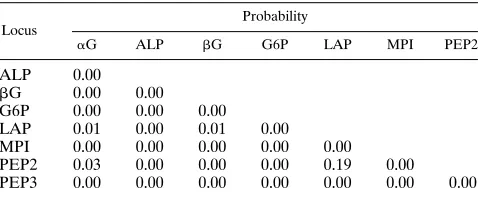
Genotypic disequilibrium.Test results are presented in Ta-ble 5 for the loci showing sufficient variability (aG, ALP,bG, G6P, LAP, MPI, PEP2, and PEP3). IDH and FUM are rep-resented by too few genotypes for the test to have any meaning. All but one pair of loci showed a strong linkage disequilibrium between loci.
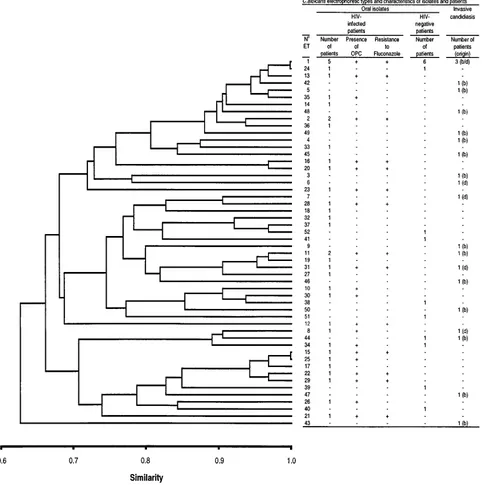
Genetic relationships between ETs.With the allelic compo-sition of the ETs for 16 enzyme loci, a matrix of similarity was built, using the similarity coefficient of Dice. The dendrogram based on this matrix using the UPGMA method and graphi-cally summarizing the relationships between ETs is shown in Fig. 1. No division of the population into clearly distinct clus-ters is visible. As shown in the dendrogram, no subpopulation of C. albicans clones seems to be associated with HIV-infected patients or with OPC signs in these patients (Fig. 1). Similarly, no specific subpopulation of clones could be associated with invasive candidiasis or a particular origin of samples. F-statis-tics analysis confirms this result. Table 4 reports Fstper locus as well as overall, together with their significance. Fst is an estimate of the level of subdivision among populations. An Fst of 0 means that there is no subdivision, whereas an Fstof 1 means that populations are completely isolated genetically. Of the 10 polymorphic loci, none showed significant departure from the null hypothesis of no differentiation among the three populations. Since the amount of sexual reproduction in C.
albicans seems to be very low, if not nonexistent (reference 31
and this study), each genotype at a locus could be considered a marker (e.g., genotype 1,15allele 1, genotype 1,25allele 2, and genotype 2,25allele 3). The whole datum set was reen-coded this way, and a molecular analysis of variance (8) was
performed, with the distances between ETs being 12 (the similarity coefficient of Dice). The calculated statistic,fst, is an
Fst-like statistic which accounts for distances between ETs. The pattern obtained from this analysis confirms the results of the
F-statistics and UPGMA analyses. The observedfstis20.011,
clearly not significant.
Reproducibility and discriminatory power of MEE.The re-producibility of results obtained by MEE was tested with nine isolates belonging to nine different ETs, for which MEE typing was independently done twice with freshly prepared cell ly-sates. In all nine cases, the same ETs were obtained. The index of discrimination of Hunter and Gaston (15) based on 70 epidemiologically unrelated strains tested for 18 enzyme loci was 0.96.
Typing of sequential oral C. albicans isolates from HIV-infected patients.Sequential oral C. albicans isolates from 21 patients were typed (Table 3). Eighteen patients carried only one ET over the sampling time (median, three sampling dates per patient; median time between first and last sample, 246 days). For two patients with five isolates each (793 and 1,024 days between first and last samples), one isolate differed from the others in one (PEP2, patient 17) or two (PEP2 and PEP3; patient 15) alleles of the 18 loci examined. The last patient (patient 5) simultaneously harbored two clearly distinct ETs differing at eight enzyme loci (Tables 2 and 3).
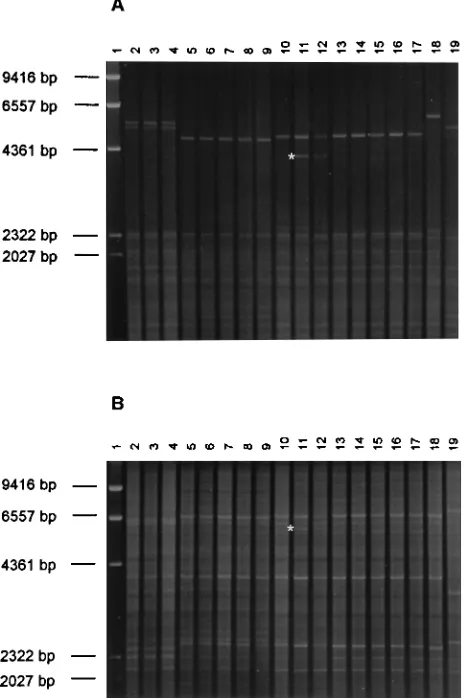
[image:7.612.57.297.92.243.2]The REA patterns of the same sequential isolates obtained with the enzymes EcoRI and HinfI broadly confirmed the MEE results. Only minor differences in the patterns could be observed within sequential isolates of the 18 patients with unchanged ETs (examples in Fig. 2). These were related to the appearance or disappearance of low-intensity bands or to changes in intensity of a few bands. These differences were reproducibly obtained when the REA procedure was repeated with freshly prepared DNA (52 different isolates were typed two to four times by REA with freshly extracted DNA). In one case only (patient 9), one clearly visible band was completely missing with both enzymes in the restriction patterns of one of three isolates (Fig. 2). The general patterns of these three isolates, however, were very similar, and all belonged to the same ET unique to this patient. When the REA patterns of oral isolates from different patients were compared, most iso-lates belonging to distinct ETs also showed differences in their REA patterns. In one case only, isolates with identical REA profiles belonged to three different but closely related ETs (patients 12 and 21 and patient 16, ET1, ET2, and ET13; Table 3). Conversely, isolates belonging to a unique ET but originat-ing from two patients had consistently different REA patterns
TABLE 4. Number of alleles, genetic diversity, and Wright’s fixation indices for 10 polymorphic loci
Locus
No. of
alleles/locus Genetic diversity
Index (significance)a
Total Effective Fst Fis
aG 3 2 0.493 20.036 (NS) 1.000 (1)
ALP 7 3 0.685 20.010 (NS) 0.980 (1)
bG 10 2 0.575 20.017 (NS) 0.674 (1) FUM 4 2 0.514 20.001 (NS) 20.946 (2)
G6P 3 2 0.414 20.005 (NS) 0.148 (NS)
IDH 2 2 0.500 0.000 (NS) 21.000 (2)
LAP 5 2 0.358 0.004 (NS) 20.144 (NS)
MPI 8 4 0.723 0.000 (NS) 20.149 (2)
PEP2 10 3 0.614 20.002 (NS) 0.381 (1) PEP3 5 2 0.557 20.011 (NS) 0.541 (1) Overallb 0.3504 20.007 (NS) 0.194 (1)
aF
stand Fis, Wright’s fixation indices estimated by the method of Weir and
Cockerham (55). Statistical significance is indicated as follows: NS, not signifi-cant;1, highly significant for a deficit in heterozygotes;2, highly significant for an excess of heterozygotes.
[image:7.612.316.555.578.677.2]bFor all 16 loci interpreted at the allele level.
TABLE 5. Probability of independence of locia
Locus
Probability
aG ALP bG G6P LAP MPI PEP2
ALP 0.00
bG 0.00 0.00
G6P 0.00 0.00 0.00
LAP 0.01 0.00 0.01 0.00
MPI 0.00 0.00 0.00 0.00 0.00
PEP2 0.03 0.00 0.00 0.00 0.19 0.00 PEP3 0.00 0.00 0.00 0.00 0.00 0.00 0.00
a
Genotypic linkage disequilibria were tested by using the program GENEPOP V-1.2 (32). Only the eight loci with enough polymorphism to give statistically significant results have been used. A number close to 0 represents a strong linkage disequilibrium, whereas a number close to 1 represents a clear lack of linkage disequilibrium. All but one pair (LAP-PEP2) show a strong disequilib-rium.
on May 15, 2020 by guest
http://jcm.asm.org/
(patients 10 and 24, ET11). No correlation between REA pat-terns and the minor differences in MEE patpat-terns found for sequential isolates from patients 15 and 17 could be observed (Table 3; Fig. 2). Two clearly distinct restriction patterns could be found in isolates from patient 5 (Fig. 2), thus confirming the major differences observed with MEE (Table 3).
The Ca3 hybridization profiles of the sequential isolates were also in agreement with the MEE results. The profiles of the isolates from each patient were highly similar (examples in Fig. 3 and 4). Minor differences within successive isolates from
[image:8.612.67.556.75.560.2]all but three patients were observed (patients 4, 14, and 20; Table 3 and Fig. 3 and 4). Such variations were also found in isolates belonging to ETs not found in any other patients (Table 3). These differences in hybridization profiles were re-lated mainly to bands larger than 7.9 kb (Fig. 3 and 4). In spite of these frequent minor variations, the constant bands of the patterns found in isolates from each patient allowed them to be distinguished from the isolates of all the other patients typed with the Ca3 probe in this study (Table 3). For patient 5, two clearly distinct hybridization profiles could be found in the FIG. 1. Genetic relationships among 52 ETs of C. albicans. The dendrogram was generated by the UPGMA method from a matrix of pairwise coefficients of similarity based on electrophoretically demonstrable allelic variation at 16 enzyme loci. ET numbers are the same as in Tables 2 and 3. Four HIV-infected patients carrying two different ETs in their throat are represented twice. For ETs associated with OPC and asymptomatic stages, only the OPC is indicated. For ETs with isolates resistant and susceptible to fluconazole, only the resistant ones are indicated. b, isolates originating from the blood or an intravenous catheter; d, isolates originating from a deep infection.
on May 15, 2020 by guest
http://jcm.asm.org/
successive isolates which correlated with the types found by the two other methods.
C. albicanssubtypes during development and recurrence of OPC.Two patients (8 and 19) without previous known OPC episodes or antifungal therapy and without OPC signs at the time of the first sampling (312 and 13 CD4 cells per mm3) carried isolates of the same MEE and REA types during the following OPC episodes. Similarly, for nine patients with re-current OPC (patients 5, 9 to 11, 13, 20, 21, 23, and 24), isolates indistinguishable by MEE and showing only minor differences in their REA and Ca3 hybridization patterns could be isolated from the oral cavity during the OPC episodes and the remis-sion phases in between (Table 3; Fig. 3). No association of specific Ca3 subtypes with the presence or absence of OPC signs within each patient was visible (Table 3).
C. albicanssubtypes and changes in susceptibility to flucon-azole. The changes in susceptibility in sequential isolates as evidenced by changes of the inhibition zone diameters for the
fluconazole agar disk diffusion test are reported in Table 3. Of the 21 patients with sequential isolates, 14 showed a significant change in the susceptibility to fluconazole of their C. albicans isolates, and three or more isolates from 12 of them (patients 11, 13 to 15, and 17 to 24) were examined. In four (patients 11, 14, 18, and 19), a gradual decrease in susceptibility to flucon-azole of the isolates tested could be observed (Table 3). In three other patients (13, 23, and 24), a decrease as well as an increase in susceptibility to fluconazole of the sequential iso-lates was evidenced. No change in ETs, REA profiles, or Ca3 hybridization patterns could be associated with these variations in susceptibility to fluconazole (Table 3; Fig. 4). No relation-ship between a particular level of susceptibility to fluconazole and a specific Ca3 hybridization subtype could be seen for each patient (Table 3; Fig. 4). The same Ca3 hybridization patterns could be associated with significantly different levels of suscep-tibility to fluconazole in several patients (patients 11, 13 to 15, 18, and 23; Table 3 and Fig. 4).
Patients with multiple simultaneous isolates. From three patients without any signs of OPC at the time of sampling or earlier and not previously treated with antifungal agents, sev-eral C. albicans colonies originating from one clinical sample were isolated and typed (patient 1, 10 colonies; patient 2, 5 colonies; and patient 3, 10 colonies). For two patients, the isolates within each patient were indistinguishable by MEE and REA. For the first patient, the 10 isolates examined also had identical Ca3 hybridization profiles (Fig. 5), and for the second, three closely related profiles could be found. For the third patient, nine clones were indistinguishable by MEE and the 10th differed only in its lack ofbG activity. However, all 10 clones from that patient showed identical REA patterns and very closely related Ca3 hybridization profiles (Fig. 5). In all three cases, the ETs found were unique to each patient. The CD4 counts of these patients at the time of sampling were 198, 642, and 649 cells per mm3, respectively.
For three other patients previously treated with fluconazole (patient 13, ET28; patient 21, ET2; and patient 24, ET11), pairs (five) or triplets (three sets) of isolates taken from the same clinical samples were examined. All the clones within pairs or triplets were indistinguishable by MEE or REA (ex-cept for a few minor bands in the HinfI profiles, as mentioned for sequential isolates). Identical or very closely related Ca3 hybridization profiles were also obtained for clones within the pairs or triplets (Table 3).
For a seventh patient (patient 5, ET34 and ET35) also pre-viously treated with fluconazole, 18 isolates from two clinical samples (nine isolates each) were examined. In both samples, two clearly distinct ETs differing at eight enzyme loci could be found simultaneously (Table 3). These two ETs could also be clearly distinguished by REA and by hybridization with the Ca3 probe (Table 3; Fig. 2). The CD4 count of this patient was already at 55 cells per mm3at the first sampling date.
[image:9.612.62.294.74.423.2]The inhibition diameters found in the fluconazole suscepti-bility test for the isolates from the three untreated patients mentioned above were almost identical (47 to 49 mm). Simi-larly, for two patients (patients 21 and 13) previously treated with fluconazole, all the isolates within the triplets showed the same or very similar inhibition diameters (Table 3). However, for two other previously treated patients (patients 24 and 5), isolates from the same sample and indistinguishable by MEE and REA showed significantly different inhibition diameters (Table 3). The latter results were confirmed by testing the isolates with the E-test for fluconazole (AB BIODISK, Pisca-taway, N.J.) (Table 3).
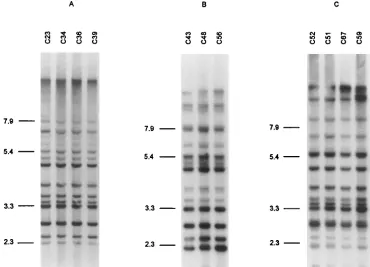
FIG. 2. REA patterns of 18 oral C. albicans isolates from five HIV-infected patients (Table 3) obtained with the enzymes HinfI (A) and EcoRI (B). Lanes 1,
lHindIII marker; lanes 2 to 4, isolates C43, C48, and C56 from patient 18; lanes 5 to 9, isolates C27, C37, C57, C40, and C58 from patient 17; lanes 10 to 12, isolates C61, C64, and C66 from patient 9; lanes 13 to 17, isolates C33, C34, C26, C75, and C82 from patient 15; and lanes 18 and 19, isolates C98 and C101 from patient 5 in Table 3 (the two main types found in this patient). Note that a clear decrease of in vitro susceptibility to fluconazole was observed in the three isolates from patient 18 (lanes 2 to 4). Isolates C40 and C75 differed in their ETs from the other isolates of the respective patients, 17 and 15. Isolate C61 (lane 10) is missing a band in both HinfI and EcoRI patterns (star) in comparison with the other isolates from patient 9 (lanes 11 and 12).
on May 15, 2020 by guest
http://jcm.asm.org/
DISCUSSION
C. albicans is a very widespread facultative human pathogen
which can be isolated from many body locations in a significant proportion of healthy people (35). Several different clinical pictures are associated with this yeast, including candidemia, abscesses, postoperative infections (mainly after intraperito-neal surgery), and most frequently vaginitis and oropharyngeal candidiasis, particularly in HIV-infected patients (35). The condition of the patient is probably the major factor governing the development of a clinical candidiasis, which is usually as-sociated with immunodeficiencies or other predisposing factors (52). However, as recently shown for many other microbial pathogens, one cannot exclude that some strains or groups of strains are more prone than others to be involved in clinical disorders. The eventuality that particular strains may present a tropism for specific body locations or that some strains are associated with specific patient populations or clinical pictures has been suspected by some authors (46). Similar phenomena have been recently evidenced in other microbial pathogen pop-ulations (45). One of the aims of the present work was to address this problem and to see if some C. albicans clones may present particular characteristics of clinical relevance.
Among the numerous typing methods developed to differ-entiate C. albicans strains, only a few have the ability to reliably assess the genetic relatedness between isolates. MEE, or isoen-zyme typing, is one of them. This method not only distinguishes
C. albicans strains with a relatively high power of
discrimina-tion (14), but also allows assessment of the structure of the population under study, its mode of reproduction under natu-ral conditions, and its genetic diversity (25, 26). MEE is there-fore particularly well suited to answer questions about the population genetics of C. albicans and was used as the main technique for the present study.
Both enzyme loci found as monomorphic in the present
work (IDH and IPO) had also been previously found to be monomorphic by other investigators (5). The other monomor-phic loci described by those authors (ACO, GOT, phospho-glucomutase [PGM], and 6PG) were only poorly polymorphic in the present study. The higher average genetic diversity found here among ETs (0.35) than what has been previously reported (0.13 [5]) may rely on differences in electrophoresis conditions used, allowing the detection of more alleles (several different buffer systems) and on possible differences in the respective populations examined. Similarly to results of previ-ous MEE studies (5, 31), our results with typical heterozygote migration patterns in some enzymes are consistent with the generally accepted diploid nature of the yeast C. albicans (40). The clonal propagation of C. albicans had been difficult to assess in the past by molecular methods, and no definitive answer to this problem could be found (5, 48). The fixation indices Fis(12) obtained in the present work are in agreement with the lack of sexual reproduction observed in this species. In addition, the patterns obtained with IDH and FUM are cer-tainly not what is expected under random mating. If sexual reproduction (and therefore recombination) occurs, then the different loci should assort independently at each reproduc-tion, unless they are all located on a small segment of the same chromosome (unlikely). On the other hand, if there is no recombination, then the different loci should be in strong dis-equilibrium. Our results show clear evidence of disequilibrium among all pairs of loci but one. Thus, our data clearly support an asexual and clonal nature of C. albicans and confirm those recently obtained by other investigators (31). The clonal nature of C. albicans evidenced here also represents a necessary pre-requisite for a simple use of molecular typing methods in epidemiological tracing.
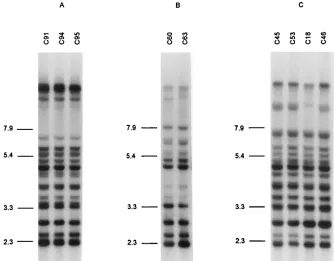
[image:10.612.136.470.71.332.2]In order to test whether some particular yeast populations may be associated either with HIV-infected patients or with FIG. 3. Ca3 hybridization patterns of multiple successive oral C. albicans isolates from patients 20 (A), 8 (B), and 11 (C). These successive isolates were associated with changes in the clinical status of the patients (Table 3). For patient 11, a clear decrease in susceptibility to fluconazole was also observed in these successive isolates. The positions of reference molecular size markers (in kilobases) are shown to the left of each gel.
on May 15, 2020 by guest
http://jcm.asm.org/
invasive candidiasis, by MEE we compared oral C. albicans isolates from HIV-infected patients with those from healthy persons and with those isolated in the course of invasive can-didiasis. The clustering of isolates by the UPGMA method showed no particular grouping correlated with any specific origin. Similar results were obtained when F-statistics were applied; no significant differences could be found between the three populations mentioned above. Molecular analysis of vari-ance also confirmed this hypothesis. These results are in agree-ment with those of other investigators using DNA fingerprint-ing, who showed that no particular strain is associated with HIV-infected patients and that C. albicans populations from the oral cavities of HIV-infected and HIV-negative persons have a common clonal origin (53). However, some researchers using serotyping or fingerprinting with the Ca3 probe have suggested that changes in the C. albicans population may occur during or after HIV seroconversion (4, 42). This seems not to be the case in the HIV-infected population examined in the present study. Furthermore, no cluster of strains was associ-ated with invasive candidiasis in this study. Thus, our results show that no C. albicans clone is linked with any particular characteristic of clinical relevance so far. However, this result must be confirmed with a larger set of isolates and with C.
albicans populations from other clinical settings, such as
vagi-nitis cases. As can be seen in Fig. 1, the oral C. albicans isolates found in association with clinical signs of OPC did not belong to a limited cluster of closely related clones within the popu-lation studied. Similarly, the oral isolates showing a clearly reduced in vitro susceptibility to fluconazole were not re-stricted to a small group of genetically related clones.
The high frequency of isolates of ET1 in all three popula-tions examined here also shows that this particular clone is specifically associated with neither healthy carriage nor clinical
signs of candidiasis. Other authors have also observed major clusters of closely related isolates within the C. albicans pop-ulation that they examined (13, 31). No clear explanation for the widespread overrepresentation of such clones has been given. It may be hypothesized that they are better adapted than other clones to life on or in the human body. They may also be more easily transmitted between humans than other clones.
The results blindly obtained by MEE for 145 isolates from 24 HIV-infected patients showed that 23 of the patients harbored a unique, major C. albicans clone during the period of obser-vation. Only one patient among the 24 simultaneously har-bored two clearly distinct clones. This result was confirmed by REA and DNA fingerprinting. For 3 of these 24 patients, one isolate belonged to a minor variant of the major ET. The differences between the major ETs and their respective vari-ants could easily be explained by the lack of expression for one or two of the 36 alleles examined within the same clone. Minor modifications of the isoenzymes profiles over time during in vitro storage of C. albicans strains have previously been de-scribed (18). The appearance of minor variants of an ET within three patients in the present study probably relies on the same mechanism. These differences found with MEE were not con-firmed with the two other typing methods used, and it must be assumed that all the isolates from these three patients be-longed to the same clones.
[image:11.612.119.489.72.339.2]In spite of differences in the discriminatory powers of the three methods, the MEE results were in broad agreement with those obtained by REA using the enzymes EcoRI and HinfI (21, 41) and with those of DNA fingerprinting with the mod-erately repetitive Ca3 probe (43). When REA was used, minor but reproducible variants could also be observed within the isolates of some patients. They may be the consequence of the relatively frequent rearrangement in the C. albicans genome FIG. 4. Ca3 hybridization patterns of multiple successive oral C. albicans isolates from patients 14 (A), 18 (B), and 23 (C). The successive isolates from patients 14 and 18 showed a regular decrease in susceptibility to fluconazole (Table 4). Isolate C51 was the only one with a clearly reduced susceptibility to fluconazole in patient 23. The positions of reference molecular size markers (in kilobases) are shown to the left of each gel.
on May 15, 2020 by guest
http://jcm.asm.org/
described by some researchers (37). With one distinct major type per patient for 23 patients and two types for the 24th patient, DNA fingerprinting with the Ca3 probe was clearly the most discriminatory typing method. However, many more vari-ants could be distinguished among the multiple isolates of each patient when the Ca3 probe was used than with the two other methods. Minor but frequent variations in the Ca3 profiles observed within a clone have been described previously (19). Similarly to what was observed in the present study, these variations have been shown to occur mainly in the high-mo-lecular-weight fragments. They seem to rely on the presence of an RPS repetitive element in the target sequence homologous to the C1 fragment of the Ca3 probe. This relatively rapid evolution of the Ca3 patterns within a clone previously led Soll and coworkers (46) to empirically set a cutoff value in the similarity coefficients below which C. albicans clones cannot be reliably distinguished. Fortunately, the isolates of each patient examined in the present study could be clustered together with confidence by the presence of distinctive bands. Together with the MEE and REA results, this criterion was considered suf-ficient to conclude that all but one patient with multiple iso-lates each harbored a unique major C. albicans clone in their throats. Our results obtained by three typing methods and showing the relative frequent appearance of variants within a clone stress the necessity of using at least two different meth-ods simultaneously to obtain a clear and reliable identification of clones when typing C. albicans isolates in epidemiological studies.
The reproducibility of the results obtained by MEE has not been tested here on a broad scale, but the few isolates tested in a blinded fashion in duplicate gave clearly reproducible results. In addition, the fact that the MEE results with multiple isolates
from HIV-infected patients blindly tested were in agreement with those of two other independent methods is a strong ar-gument for the reproducibility of MEE. The only three dis-crepancies observed between MEE and the other methods were reproducibly obtained and must be attributed to effective changes in the genotypes (mutations) or in the phenotypes (lack of expression of some alleles) rather than to a lack of experimental reproducibility of MEE.
The discriminatory index (15) of 0.96 obtained with 70 epi-demiologically unrelated isolates in the present study is slightly higher than what had been previously described for MEE (14). This may be a result of the more complex electrophoresis conditions used here, allowing the distinction of more electro-morphs than in other studies, and the higher number of en-zyme loci examined. With a probability of.95% of differen-tiating epidemiologically unrelated isolates, MEE is clearly a very powerful tool for typing C. albicans in epidemiological studies.
For six of seven patients tested by MEE, only one C. albicans clone could be evidenced per patient among multiple simulta-neous oral isolates. Thus, our results confirm the observation of other researchers (13, 24, 53), showing that the vast majority of patients carry one unique or only one major C. albicans clone in their oral cavities. HIV-infected patients may some-time carry several C. albicans clones in their oropharynx, but this seems to represent only a minor part of the population studied. This result is also supported by the fact that only one
C. albicans clone per patient was found in 20 of 21 patients
with sequential oral isolates. It is not clear why some other investigators have found a much higher proportion of patients simultaneously carrying several strains in their oropharynx (21, 28, 39). In the present study, three of the seven patients men-FIG. 5. Ca3 hybridization patterns of multiple simultaneous oral C. albicans isolates from patients 3 (A) and 1 (B). The positions of reference molecular size markers (in kilobases) are shown.
on May 15, 2020 by guest
http://jcm.asm.org/
[image:12.612.65.548.79.366.2]tioned above and carrying only one oral C. albicans clone had no known previous episode of OPC or prior antifungal treat-ment. Two of these three patients had CD4 counts above 600 cells per mm3. Thus, our results suggest that neither antifungal therapy nor advanced AIDS status may be the reason for the presence of one unique C. albicans clone in the oropharynx of the majority of HIV-infected patients. The simultaneous and continuous presence of two distinct C. albicans clones in the oral cavity of one patient previously treated with antifungal agents and with very low CD4 counts also supports this con-clusion. In contrast, it could be hypothesized that a deficient immunity may facilitate the simultaneous colonization of the oropharynx of the patient by several distinct strains. Among the 18 patients with multiple C. albicans isolates and CD4 counts lower than 100 cells per mm3examined in the present study, only 1 simultaneously harbored more than one C.
albi-cans strain. Thus, our results do not support the latter
hypoth-esis, suggesting that factors other than the immune status of a patient may influence the colonization of the oropharynx by one or several C. albicans strains.
The present results show that clones found before, between, and during OPC episodes in HIV-infected patients are the same. This does not preclude the possibility that a change in colonizing oral C. albicans clones may take place early during the development of HIV seropositivity (42). In fact, the two patients who were sampled before their first OPC, and who harbored the same C. albicans clone during subsequent OPC episodes, already had decreased CD4 counts at the time of the first sampling (312 and 13 CD4 cells per mm3) and may have had changes in colonizing oral C. albicans earlier. However, the fact that the ET distributions in healthy oral carriers and in HIV-infected patients are similar does not corroborate this hypothesis. Our observation that HIV-infected patients keep the same oral C. albicans clone during and between OPC episodes is in agreement with the data obtained by some but not all other investigators. Changes in oral C. albicans strains have been shown in a significant proportion of cases in several studies (2, 28, 39). The reasons for the discrepancy between the results of different groups concerning this phenomenon are not clear. However, the regimen of therapy for the treatment of OPC may play an important role in this context. As mentioned by Powderly and collaborators (30), who showed a strong sta-tistical association between change in Candida strains during recurrent OPC episodes and use of suppressive antifungal therapy, the continuous isolation of the same strain during recurrent OPC episodes may be related to the lack of complete eradication of this strain by antifungal therapy. The total erad-ication of C. albicans from the oral cavity apparently obtained in certain cases (39) may facilitate the colonization by a new strain. Several patients from the present study had been treated with relatively low single doses of fluconazole until the appearance of clinical resistance (51). Thus, the therapy used for these patients may not have been sufficient in most cases to eliminate the C. albicans from their oral cavities. This may also have been the case in the study of Millon and coworkers (23), in which low-dose therapy was used as a first step. No changes in C. albicans strains could be detected by those authors. This is in contrast with two other studies in which changes in oral C.
albicans strains were observed at relatively high frequencies.
However, in those two studies, the antifungal therapy used higher doses than in the former studies and for a longer period (28, 39). These observations are in agreement with the results of Powderly and coworkers (30).
We could not find evidence of any change of C. albicans clones in patients during the development of in vitro resistance to fluconazole. Again, this is in agreement with the results
obtained by some (23, 33), but not all, authors. The reasons for the changes during the development of resistance to this anti-fungal agent described in several reports (1, 2, 28, 39) may be the same as for the changes in the course of OPC recurrences. The results of our study confirm that the development of re-sistance to fluconazole can take place within a clone and that the replacement of a susceptible clone by another, unrelated resistant one is not a necessary or frequent event, at least in certain populations.
Ca3 fingerprinting shows that no particular subpopulation within a clone is associated with clinical OPC episodes or with asymptomatic carriage between OPC episodes. In addition, no correlation between Ca3 subtypes and levels of susceptibility to fluconazole could be observed. Different Ca3 subtypes may show a decreased susceptibility to fluconazole and seem to be recovered randomly during the development of resistance.
Our results also show that isolates of the same clone but presenting significantly different levels of susceptibility to flu-conazole can be found simultaneously in the throats of some HIV-infected patients. Multiple in vitro subcultures without fluconazole have shown that these differences in phenotypes are stable and do not represent transitory adaptation to the presence of fluconazole (data not shown). This phenomenon may be the reason for some unexplained and irregular varia-tions in susceptibility to fluconazole observed in a few sequen-tial C. albicans isolates in the present study.
In conclusion, our results show and confirm that the yeast C.
albicans has a clonal mode of reproduction in natural
popula-tions and that there is no particular C. albicans subpopulation associated with HIV-infected patients or with invasive candi-diasis. The vast majority of HIV-infected patients examined here carried only one major C. albicans clone in their oral cavities. The patients harbored the same C. albicans clones during and between recurrent OPC episodes. Development of in vitro resistance to fluconazole in these patients was not associated with replacement of C. albicans clones. Finally, sub-populations of C. albicans presenting different levels of suscep-tibility to fluconazole and belonging to the same C. albicans clone may be found in the oral cavities of HIV-infected pa-tients during the development of resistance to this widely used antifungal agent.
ACKNOWLEDGMENT
We are indebted to D. R. Soll for kindly providing hislCa3 clone.
REFERENCES
1. Barchiesi, F., R. J. Hollis, D. A. McGough, G. Scalise, M. G. Rinaldi, and
M. A. Pfaller.1995. DNA subtypes and fluconazole susceptibilities of Can-dida albicans isolates from the oral cavities of patients with AIDS. Clin. Infect. Dis. 20:634–640.
2. Bart-Delabesse, E., P. Boiron, A. Carlotti, and B. Dupont. 1993. Candida albicans genotyping in studies with patients with AIDS developing resistance to fluconazole. J. Clin. Microbiol. 31:2933–2937.
3. Boerlin, P., F. Boerlin-Petzold, C. Durussel, M. Addo, J.-L. Pagani, J.-P.
Chave, and J. Bille.1995. Cluster of oral atypical Candida albicans isolates in a group of human immunodeficiency virus-positive drug users. J. Clin. Microbiol. 33:1129–1135.
4. Brawner, D. L., and J. E. Cutler. 1989. Oral Candida albicans isolates from nonhospitalized normal carriers, immunocompetent hospitalized patients, and immunocompromised patients with or without acquired immunodefi-ciency syndrome. J. Clin. Microbiol. 27:1335–1341.
5. Caugant, D. A., and P. Sandven. 1993. Epidemiological analysis of Candida albicans strains by multilocus enzyme electrophoresis. J. Clin. Microbiol. 31: 215–220.
6. DeWit, S., D. Weerts, H. Goossens, and N. Clumeck. 1989. Comparison of fluconazole and ketokonazole for oropharyngeal candidiasis in AIDS. Lan-cet i:746–747.
7. Durussel, C., A. Vuffray, J.-P. Chave, and J. Bille. 1994. A simple and reliable fluconazole disk diffusion test to predict clinical outcome of oropha-ryngeal candidiasis in HIV-positive patients, abstr. F-110, p. 607. In