© 2015, IRJET ISO 9001:2008 Certified Journal Page 1150
INCREASE THE EFFICIENCY OF PV MODULE BY USING LOW COST
TRACKING SYSTEM
Ajay Kumar Damral
11
Researcher, Dept. Electrical Engg., SSGM College of Engg. Shegaon, MS, India
Abstract
-
PV modules can be used in PV system for generating electricity. PV modules are available in range of power ratings that vary from few watts to hundred watts. Also, these modules are made from different types of materials. Various parameters of a solar PV module include Short Circuit Current (ISC), OpenCircuit Voltage (Voc), Fill Factor (FF), Efficiency (η), Peak Power (Pm), Series Resistance (Rs) and Shunt Resistance (RSh). Factor affecting
electricity generated by a solar cell Sun intensity, effect of cell area & shadow effect. Losses in solar cell loss of low energy photons, loss due to excess energy of photon, voltage loss, fill factor loss, loss by reflection, loss due to incomplete absorption, loss due to metal coverage & recombination losses. Tracking concentrator uses proper tracker hardware. No additional mirror supporting structures are needed. It could increase solar power efficiency of PV panels. Substantially reduce unit price of PV power in presented. The efficiency is increased due to low cost tracking system. Flat plate solar PV module when placed in the field shows increase in temperature. This increase in temperature is due to the loss of heat that is unutilized in energy conversion. The temperature rise is due to unutilized energy, which mostly comes from the high-energy photons. To operate solar cells at high concentration levels, one has to use proper cooling techniques. These may range from passive convective cooling, using heat sink, or active convective cooling, using flowing water.
Key words
:
PV cell. PV module, Sun intensity, sun angle, shadow effect, losses in solar cell, tracking concentrator.1. INTRODUCTION
1.1.
Solar
photovoltaic module
PV modules generate power. These modules generates power ranging from few watts to hundred watts. Different materials are used in PV modules. Material plays an important role in power generation. Hence it is necessary to indentify the PV modules from which it is made.
PV modules are constructed by connecting solar cells together. Most commonly used technology in PV modules are the crystalline Si solar cells. These Si crystalline Si solar cells are of two types Monocrystalline and polycrystalline Si solar cells.
The mono‐crystalline Si solar cells are either circular
in shape of pseudo‐square, while the
multi‐crystalline Si cells are normally square or rectangular. Due to their shape the solar PV modules made using mono‐crystalline cell have empty space between the cells while the solar PV modules made using multi‐crystalline Si cells will be tightly packed and will not have empty space between the cells. The crystalline Si solar cell technology is known as first generation solar cell technology. There is also a second generation solar cell technology which include CdTe (cadmium telluride), CIGS (copper indium gallium sellenide) and a‐Si (amorphous Si). These second generation technologies are also referred as thin film technologies. These technologies are also commercially available. The PV modules that are made using crystalline Si appears bluish in colour and also have thin metal contact lines on the top. These metal contact lines are separated by few mm. In case of thin film solar PV modules these visible metal contacts are not there, because instead of metals, transparent oxides are used to make metal contacts. The colours of thin film PV module can be dark grey. [1] [3]
1.2.
Various parameters of a solar
module
Various parameters of a solar PV module include Short Circuit Current (ISC), Open Circuit Voltage (Voc), Fill Factor (FF), Efficiency (η), Peak Power (Pm), Series Resistance (Rs) and Shunt Resistance (RSh).[1]
1.2.1. Short circuit current
© 2015, IRJET ISO 9001:2008 Certified Journal Page 1151 current density and current per unit area, in terms of
mA/cm2
The short circuit current is due to the generation and collection of light-generated carriers. The short-circuit current is the largest current which may be drawn from, the solar cell. ISC which is written as:
(1.1)
Fig -1.1: Current - voltage (I-V curve of solar pv module)
1.2.2.
Open circuit voltage
Open circuit voltage Voc is the maximum voltage
[image:2.595.322.473.110.212.2]that can be obtained from a solar PV Module when its terminals are left open
Fig.-1.2: Current - voltage (I-V curve of solar pv module)
(1.2)
1.2.3.
Maximum power
This is defined as the maximum power (Pmax or Pm) output of a PV module under standard test
condition (STC), which corresponds to 1000 W/m2
and 25oC cell temperature in PV module. Under the
STC the power output of a PV module is maximum; therefore it is also referred as peak power or Watt (peak) or Wp. This is given as product of Vm and Im.
(1.3)
Fig. -1.3 : Maximum power
1.2.4.
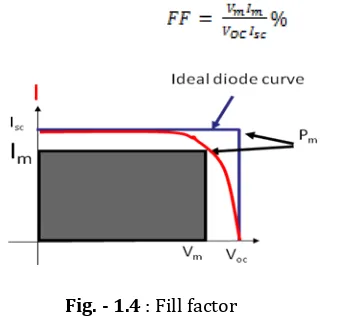
Fill factor
Fill Factor (FF) is defined as the squareness of the I‐V curve and mainly related to the resistive losses in a solar module. It can be defined as the ratio of actual maximum power output to the ideal maximum power output. In ideal case, its value can be 100% corresponding to square I‐V curve. But it is not feasible to have square I‐V. There are always some losses which reduces the value of FF. The best value of FF that can be obtained for a solar module can empirically be written as a function of VO.
(1.4)
The Fill Factor (FF) of a PV module can also be is actually the area under the I‐V curve. It is given in percentage.
(1.5)
Fig. - 1.4 : Fill factor
1.2.5.
Efficiency of PV module
[image:2.595.329.509.467.634.2]© 2015, IRJET ISO 9001:2008 Certified Journal Page 1152 module efficiency should be measured few times
during the measurement and average value of PV module efficiency should be used. Module efficiency is written as:
(1.6)
Where, Pin is the input radiation. The efficiency is given in %. Normally efficiency of a PV module is specified at Standard Test Condition (STC), which is corresponding to input power density of 1000
[image:3.595.64.228.266.377.2]W/m2 and 25oC cell temperature in PV module.
Fig. - 1.5: Efficiency of P.V. cell
1.2.6.
Series resistance
The series resistance is the sum of resistances due to all the components that come in the path of current. This includes the base, emitter, semiconductor‐metal contact resistance and resistance of metal contact. It is desirable to have the value of series resistance as low as possible. The effect of series resistance is to reduce the Fill Factor and hence efficiency of PV modules.
1.2.7.
Shunt resistance
Shunt resistance is due to the leakage across P‐N junction. It could be due to a shunt around the periphery of cell or due to the crystal defect or precipitates of impurities in the junction region. It is desirable to have the value of shunt resistance as high as possible. The effect of series resistance is to reduce the Fill Factor and hence efficiency of PV modules.
1.3.
Solar simulator
I-V
measurement
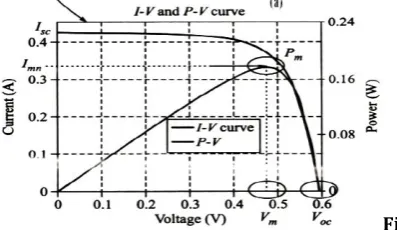
Solar simulator plots the current-voltage
relationship (I-V curve) for the solar cell. The information obtained from I-V curve is useful in evaluating solar cell performance in terms of its efficiency, maximum current and voltage or peak power.
The solar simulator makes use of an artificial light source whose illumination spectrum matches with that of the sun. Preferably lamps (for instance, Xenon or Mercury arc lamps) are used as the light source as their spectrum nearly matches with that of the sun at AM1.5. The light, when incident on solar cells, generates current and voltage that are measured with the help of the data acquisition systems (DAS). An internal sweep circuit applies either current or voltage and the measurement circuit measures the other quantity (voltage or current). In this way, current-voltage or I-V curve of the cell is obtained. The information gathered from the I-V curve gives the Isc, Voc FF, peak power, Imp, Vmp, series resistance and efficiency. The typical I-V curve, power curve and other solar cell parameters obtained from solar simulator are shown in fig. 1.6.
Solar simulators are manufactured to provide standard test conditions (STC) for solar cells. The
simulator works at irradiations levels of 1000 W/m2
and at AM 1.5 spectrums. In order to match the spectrum, some filters are also used. A proper temperature control system needs to be set up which can maintain the solar cell temperature at about 250C.
Fig.-1.6: Typical I-V curve and other solar parameters obtained from solar simulator.
1.4.
Bypass diode
[image:3.595.316.515.416.531.2]
© 2015, IRJET ISO 9001:2008 Certified Journal Page 1153 Fig. - 1.7: Placing of bypass diode in parallel with
cells to avoid reverse biasing and hot spots in the module
2. FACTOR AFFECTING ELECTRICITY
GENERATED BY A SOLAR CELL
2.1. Sun intensity
The magnitude of photocurrent is maximum under a full bright sun (1.0 sun). On a partially sunny day, the photocurrent diminishes in direct proportion to the sun intensity. At a lower sun intensity, the I-V characteristic shifts downward as shown in Figure 2.1
Fig.- 2.1: I-V Characteristic of PV module shifts down at lower sun intensity, with small reduction in voltage.
[image:4.595.59.213.102.225.2]On a cloudy day, therefore, the short-circuit current decreases significantly. The reduction in the open-circuit voltage, however, is small. Photo conversion efficiency of the cell is insensitive to solar radiation in the practical working range.
Fig. - 2.2: Photoconversion efficiency vs. solar radiation
Figure 2.2 show that the efficiency is practically the same at 500W/m2 and at 1000 W/m2. This means that the conversion efficiency is same on a bright sunny day as on a cloudy day. Lower power output on a cloudy day is obtained only because of lower solar energy impinging on the cell.[2]
2
.
2. Sun angle
Cell output current is written as:
I=IoCosθ, (2.1)
where I0is the current with normal sun and θ is the angle of the sun line measured from the normal. This cosine law holds well for sun angles ranging from 0 to about 500. Beyond 500, the electrical output deviates significantly from the cosine law, and cell
generates no power beyond 850, although the
mathematical cosine law predicts 7.5% power generation (Table 2.1). The actual power-angle curve of the PV cell, called the Kelly cosine, is shown in Figure 2.3.
Table - 2.1 Kelly cosine values of the photocurrent in silicon cells
Angle
Degrees Mathematical Cosine Value Kelly Value Cosine
30 0.866 0.866
50 0.643 0.635
60 0.500 0.450
80 0.174 0.100
85 0.087 0
[image:4.595.64.239.430.519.2] [image:4.595.311.530.446.677.2]© 2015, IRJET ISO 9001:2008 Certified Journal Page 1154
2.3. Effect of cell area
Maximum current from a module greatly depends on the size of each cell. Cell having larger area has higher short circuit current than the small sized one.
2.4. Shadow effect
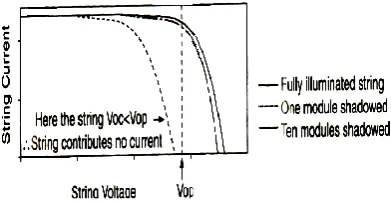
The array may consist of many parallel strings of series-connected cells. Two such strings are shown in Fig. 2.4 a. A larger array may get partially shadowed due to a structure interfering with the sun line. If a cell in a long series string gets completely shadowed, it loses the photo voltage but still must carry the string current by virtue of its being in series with all other cells operating in full sunlight. Without internally generated voltage, the shadowed cell cannot produce power. Instead, it acts as a load, producing local I2R loss and heat. Remaining cells in
the string must
[image:5.595.56.252.471.572.2]work
Fig. - 2.4 a: Shadow effect on the long series string of an array
Fig. - 2.4b: The I-V characteristic of the stings
at higher voltage to make up the loss of the shadowed cell voltage. A higher voltage in healthy cells means a lower string current as per the I-V characteristic of the stings. This is shown in Figure 2.4b. The current loss is not proportional to the shadowed area, and may go unnoticed for a mild shadow on a small area. However, if more cells are shadowed beyond the critical limit, I-V curve goes below the operating voltage of string, making the string current fall to zero, losing all the power of string. This causes loss of one whole string from the array.
3.
LOSSES IN SOLAR CELLS
A loss in a solar cells refers to loss of photon energy (partial or full) which, due to some reason, is not able to deliver an electron out of a solar cell. This loss could be due to the fundamental reason (limited by material properties) or it could be due to the technological reason (limited by cell processing capabilities). There are several ways in which photon energy loss could occur. [1] [2]
3.1.
Loss of low energy photons
The photon having energy less than band gap energy do not get absorbed in the material and therefore, do not contribute to the generation of electron-hole pairs. This is referred as transmission loss and is almost equal to 23% for single junction solar cells.
3.2.
Loss due to excess energy of
photon
In an ideal case only, photon of energy equal to the band gap energy is required to excite an electron from valence band to conduction. When the photon energy E is higher than the band gap energy Eg, the excess energy (E- Eg ) is given of as a heat to the material. This loss is referred as the thermalization loss. For single junction solar cell, this is equal to about 33%.
3.3.
voltage loss
Voltage corresponding to band gap of a material is obtained by dividing band gap (potential energy) by charge, i.e. Eg/q. This is referred as band gap voltage. Actual voltage obtained from a solar cell is Voc. This happens due to the unavoidable intrinsic Aunger recombination. The ratio of Voc/Eg/q lies in the range of 0.65 to 0.72.
3.4.
Fill factor loss
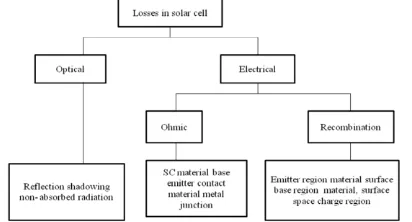
© 2015, IRJET ISO 9001:2008 Certified Journal Page 1155 Fig. - 3.1: Categorization of loss mechanisms in solar
cell arising from technological limitations
The loss categories are optical losses and electrical losses. The optical losses are referred to as the loss of photons which may result in generation of electron-hole pairs. And electrical loss is referred to as the loss of photons, [3] which is absorbed in solar cell, but do not contribute to cell output power due to either recombination or ohmic losses. The losses due to the ethnological reasons are as follows:
3.5.
Loss by reflection
A part of incident photons is reflected from the cell surface. The reflection can be minimized by using anti-reflective coating and surface texturing.
3.6.
Loss due to incomplete
absorption
It refers to the loss of photons which have enough energy (i.e.,>Eg) to get absorbed in solar cell, but do not get absorbed in the cell due to limited solar cell thickness. The incomplete absorption is becoming important in the current scenario thickness of the cell (both wafer based and thin film) is being reduced in order to save the active material for cost reduction purpose.
3.7.
Loss due to metal coverage
In wafer-based solar cell, the contact to the front side of the cell (from where light enters) is made in the form of finger and bus bar. This metal contact shadows some light which can be up to 10%. Several approaches have been adopted to minimize this loss which includes one-side contacted cell, buried-contact solar cell or transparent buried-contact as used in thin film solar cells.
3.8.
Recombination losses
Not all generated electron-hole pairs contribute to the solar cell current and voltage due to recombination. The recombination could occur in
the bulk of material or at the surface. This type of recombination can be minimized by appropriate surface and bulk passivation techniques
4. LOW COST TRACKING
CONCENTRATOR
4.1. New tracking concentrator
Concentrator modules are used for obtaining low concentration ranges of about 2-suns to 4-suns. Figure 4.1 shows a flat plate solar PV module converted into a concentrator module utilizing mirrors. This forms a simple non-imaging optics concentrator. The idea is simple and easy to implement on the commercial flat plate modules. The concentration ratio (geometrical concentration ratio) is given by the aperture area of the mirrors opening and the area of the flat plate collectors. The concentration ratio could be increased by increasing the aperture area of the collector mirrors, but there are practical limitations for the size of the mirrors. From fig. 4.1, the geometrical concentration ratio is defined as:
(4.1)
Where n is the number of reflections,
Ψ is the trough angle and
θ is the acceptance angle.
Fig. -
4.1: Low-cost tracking concentrator
The advantage of such types of concentrator is that they do not require tracking mechanism and also absorb the diffuse component of the radiation. This makes them suitable for low-cost concentrator application.
4.
2. Concentration ratio
[image:6.595.57.263.107.218.2]© 2015, IRJET ISO 9001:2008 Certified Journal Page 1156 receiver which is the solar cell. This is achieved with
the help of lens or mirrors acting as the collectors. The amount of concentration or the quantity of solar radiation incident on the receiver is measured in terms of suns (where 1 sun is 1000 W/m2). This is obtained from the area of the collector and the receiver. The term called the concentration ratio, (CR) could be defined as the ratio of collector aperture area and the receiver area.
(4.2)
4.3. Cooling requirements
Flat plate solar PV module when placed in the field shows increase in temperature. This increase in temperature is due to the loss of heat that is unutilized in energy conversion. The temperature rise is due to unutilized energy, which mostly comes from the high-energy photons and which has energy greater than Eg (band gap of the solar cells). This shows that temperature rise is much higher in the top region of solar cell where most of the high energy photons are absorbed, especially region near the junction. In steady state, energy balance in the solar cell could be written as:
Ein = Eout + Eloss (4.3)
Where Ein is input solar radiation incident on the solar cells.
Eout is electrical energy obtained and
Eloss is the thermal energy released in the form of convection and radiation.
Eloss = Ecov + Erad (4.4)
The convection and radiation are functions of temperature, and as temperature goes on increasing, the loss increases. Moreover, it is observed that temperature of solar cell depends on electrical load. When solar cell operates in the open circuit or short circuit condition, temperature increase is more as opposed to its operation at the maximum power point when the electrical load is optimized. If no cooling mechanism is provided then solar cell temperature increases rapidly and is given as:
(4.5)
Where T is cell temperature,
Ta is ambient temperature,
X is concentration ratio,
A cell is the cell area,
Aradiation is radiative area which is equal to the solar cell area,
Ε is emissivity,
is the Stefan–Boltzmann’s constant and
Ein is the input power per unit area to the solar cell.
Temperature of the solar cell in the case of convective and radioactive cooling by air or water is given as:
(4.6)
Where h is convective heat transfer coefficient for air or water; its value is different for different forced and natural circulation of air.
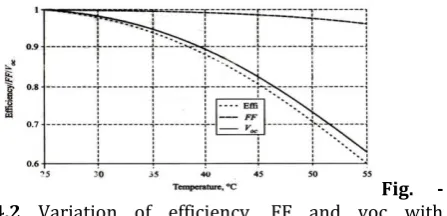
Fig. -
4.2 Variation of efficiency, FF and voc with
temperature
To operate solar cells at high concentration levels, one has to use proper cooling techniques. These may range from passive convective cooling, using heat sink, or active convective cooling, using flowing water (or another fluid) through pipes.
Radiative and convective cooling using air and water. It is found that the cooling by forced circulation of water is beneficial as it helps in maintaining the temperature constant over a wide range of concentration ratios. Thus, this method is suitable for concentration ratio of more than 10-suns. For concentration levels less than 10-suns, passive cooling using heat sink is feasible as the
temperature increase is observed well below 1000C.
[image:7.595.319.543.372.480.2]© 2015, IRJET ISO 9001:2008 Certified Journal Page 1157
4.4. Tracking concentrator
Solar tracker and tracking concentrator are described along with tracking strategy which enables high collectible energy surplus at medium tracking accuracy. A new low cost tracking (C 1.6 - 1.7) concentrator can double PV power harvest in comparison with fixed panels and substantially reduce price of PV power is presented. The new
system combines simple low-cost tracker.
Concentrator outer mirror has been eliminated. On single axis trackers, both horizontal and polar, the mirrors have to be extended beyond PV panels to ensure uniform illumination of panels, at seasonally variable elevation of the sun.
On polar axis trackers with seasonally adjustable slope of the axle, the extended mirror is not needed. It is advantageous that concentrators for photovoltaics do not need highly specular expensive mirrors. Weather resistant mirrors with high total reflectance are needed. [4] The mirror can be made of Silver coated polymer (acrylic) film or sheet, Aluminium coated polymer (acrylic) film or sheet and Silver coated hardened glass.
The concentrator is easily scalable. The standard version of tracking concentrator can accommodate from two small PV panels. Application of the concentrator on different tracking systems is also very easy. It can be used on polar or horizontal single axis tracker. Concentration ratio of 1.6 - 1.7 reduces the temperature of PV panels (higher efficiency) and avoids degradation of the encapsulant.[4]
It is advantageous that concentrators for photovoltaics do not need highly specular expensive mirrors. Weather resistant (at least 10 years) mirrors with high total reflectance are needed. The mirror can be made of rolled stainless steel sheet with special surface finish of rolled aluminium alloy sheet (plated with pure aluminium) protected by a weather resistant polymer (PVF) film of silver coated polymer (acrylic) film or sheet, of aluminium coated polymer (acrylic) film or sheet, of silver coated hardened glass. Polar axis solar tracker and/or tracking concentrator is always mounted on high support structures (to avoid contact of the rotating PV array with the ground). It improves back side energy collection in comparison with fixed PV arrays or even roof integrated PV modules.
The new low cost tracking concentrator of radiation can double solar energy harvest and substantially reduce price of PV energy. It has range of advantages in comparison with existing devices. First of all its
simplicity has positive influence to the reliability and price. In near future, this device can be used for the construction of the solar pumping systems which is used in agriculture for irrigation.
Solar tracker concentrator is always mounted on high support structures which improve cooling of PV modules by air flow. Measured temperature of c-Si PV modules on the tracker was usually lower than that of roof integrated c-Si modules. Even in low cost tracking concentrators (C = 1.6 – 1.7) with PV modules there is very low temperature difference against roof integrated modules. The reduced temperature of modules can also increase the power and efficiency.
5.1. Measuring the parameters of a solar
PV module without low cost tracking
system
- To measure the current‐voltage (I‐V)
characteristics of a PV module
- Measuring or estimating various parameters including Short Circuit Current (ISC), Open Circuit Voltage (VOC), Fill Factor (FF), Maximum power (Pm), Series Resistance (RS), Shunt Resistance (Rsh) and efficiency (η) of a solar PV module.
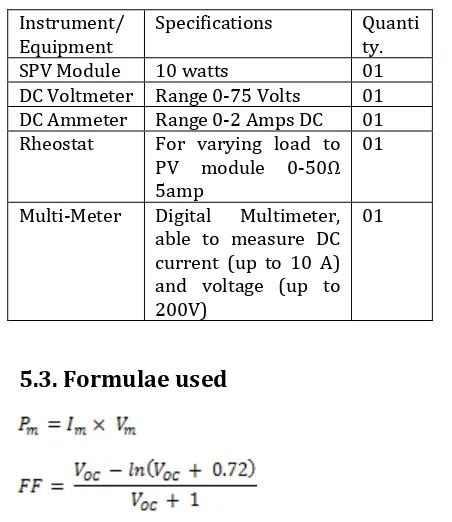
[image:8.595.306.532.493.754.2]5.2. Equipments required
Table - 5.1: Equipments required to conduct this experiment
Instrument/
Equipment Specifications Quantity.
SPV Module 10 watts 01
DC Voltmeter Range 0-75 Volts 01
DC Ammeter Range 0-2 Amps DC 01
Rheostat For varying load to
PV module 0-50Ω 5amp
01
Multi-Meter Digital Multimeter,
able to measure DC current (up to 10 A) and voltage (up to 200V)
01
© 2015, IRJET ISO 9001:2008 Certified Journal Page 1158 Where,
Pm = Maximum Power
Im = Maximum Current
Vm = Voltage at maximum power
Voc = Open circuit voltage
Isc = Short circuit current
Pin = Global intensity of sunlight
η= Efficiency
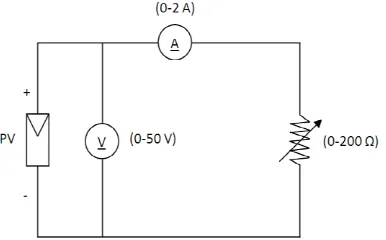
[image:9.595.311.527.96.349.2]5.4. Circuit diagram:
Fig. - 5.1: Connection diagram to find out current versus voltage characteristics
5.5
. Procedure:
Voc is measured by connecting voltmeter across
the open ends of PV module.
Isc is measured with the help of multimeter by shorting the two ends of PV
Values of Voltage & current are measured for various positions of
rheostat
Using measured values of voltage & current
maximum power and
Efficiency values are calculated.
5.6. Observation table
Table - 5.2: Experimental results of PV module without low cost tracking system without low cost tracking system
Resistance
(Ω) Voltage (V) Current (A) Power (W)
0.48 0.40 0.82 0.32
1.40 1.15 0.82 0.94
1.65 1.36 0.82 1.11
2.29 1.88 0.82 1.54
2.60 2.14 0.82 1.75
6.29 5.10 0.81 4.13
8.14 6.60 0.81 5.34
10.4 8.32 0.80 6.65
11.96 9.45 0.79 7.46
13.52 10.55 0.78 8.22
14.84 11.43 0.77 8.80
17.44 12.91 0.74 9.55
19.70 13.99 0.71 9.93
20.89 14.42 0.69 9.94
22.63 14.94 0.66 9.86
Open circuit
voltage Voc Short circuit current Isc Area of PV module A
18.60V 0.82 Amp 0.1291 m2
5.7. Calculation
Solar intensity at the time of experiment, Pin = 808 watt /m2
5.8. Based on experimental
measurements:
Open Circuit Voltage (Voc) = 18.60Volts
Short Circuit Current (ISC) = 0.82 Amp
The value of solar intensity at the time of experiment, Pin = 808 W/m2
The maximum power obtained from the PV Module Pm = 9.94 Watt
Voltage at maximum power point (Vm) = 14.42V
[image:9.595.56.249.372.492.2]© 2015, IRJET ISO 9001:2008 Certified Journal Page 1159 Efficiency (empirically) = 11.65%
Efficiency (practically) = 9.53%
The efficiency found by empirical is 11.65% using fill factor as 0.7979
The efficiency found by doing experiment is 9.53% using fill factor as 0.6518
5.9. To observe the effect of low cost
tracking system on the operational
parameters of the PV module.
5.10. Apparatus
1. PV module
2. 50 Ω, 5Amp Rheostat
3. 0.75V voltmeter DC
4. Multimeter
5. Low cost tracking system
5.11. Procedure:
1. In this case, the intensity of light is increased artificially using low cost tracking system. The sun rays incidents on low cost tracking system are reflected on to the PV module.
[image:10.595.310.524.134.383.2]2. Further procedure followed is same as discussed earlier and the values of Efficiency & Power Obtained are compared to those which are obtained in case I.
Fig. – 5.2 : Circuit diagram with low cost tracking system.
Table - 9.3: Experimental results of PV module with low cost tracking system
Resistance
(Ω) Voltage (V) Current (A) Power (W)
0.51 0.51 0.99 0.50
2.52 2.55 1.01 2.57
3.93 4.01 1.02 4.09
5.30 5.41 1.02 5.51
6.73 6.60 0.98 6.46
8.02 7.62 0.95 7.23
10.43 9.60 0.92 8.83
12.21 11.12 0.91 10.11
13.60 12.11 0.89 10.77
15.04 13.54 0.90 12.18
17.36 14.76 0.85 12.54
19.44 15.36 0.79 12.13
20.60 15.66 0.76 11.90
22.58 15.81 0.70 11.06
24.42 16.12 0.66 10.63
Open circuit
voltage Voc Short circuit current Isc Area of PV module A
18.77 V 1 Amp 0.1291 m
5.12. Calculation:
Solar intensity at the time of experiment, Pin = 808 watt /m2
5
.
13.
Based
on
experimental
measurements:
Open Circuit Voltage (Voc) = 18.77
Volts Short Circuit Current (ISC) = 1 Amp
The value of solar intensity at the time of experiment, Pin = 808 W/m2
The maximum power obtained from the PV Module Pm = 12.54 Watt
[image:10.595.49.252.564.658.2]© 2015, IRJET ISO 9001:2008 Certified Journal Page 1160 Current at maximum power point (Im) = 0.85V
Efficiency (empirically) = 14.37%
Efficiency (practically) = 12.01%
With Low cost tracking System the efficiency found empirically is 14.37% using the value of fill factor as 0.7991 and the efficiency found by actual experimental reading is 12.01% using the value of fill factor as 0.6680
Hence from above results the efficiency found without low cost tracking system empirically and practically is 11.65% and 9.53% and respectively.
6. CONCLUSIONS
Tracking concentrator uses proper tracker hardware. No additional mirror supporting structures are needed. It could increase solar power efficiency of PV panels. Substantially reduce unit price of PV power in presented. The efficiency is increased due to low cost tracking system. The efficiency is increased due to low cost tracking system.
With Low cost tracking system the efficiency found empirically is 14.37% using the value of fill factor as 0.7991 and the efficiency found by actual experimental reading is 12.01% using the value of fill factor as 0.6680
Hence from results the efficiency found without low cost tracking system empirically and practically is 11.65% and 9.53% and respectively.
With the help of this technique a new tracking concentrator which can increase the P.V. power harvest is comparison with fixed panels substantially.
REFERENCES
1. A text book of “Solar photovoltaics” by Chetan
Singh Solanki, PHI
2. A text book of “Wind and solar power systems”
by Mukund R. Patel,
3. A text book of “Nonconventional Energy
Sources” by G.d rai
4. V. Pouleka, M. Librab, “A new low-cost tracking
ridge concentrator”, Journal of solar energy materials & solar cells, ELSEVIER, Science direct, 61, page no. 199-202, 2000
5. A text book of “Advances in Renewable Energy
Technologies” by S.H. Pawar & L.A. Ekal, NAROSA
6. T.V. Torchynska and G. Polupan, “High efficiency