
Defective insulin secretion in hepatocyte
nuclear factor 1alpha-deficient mice.
M Pontoglio, … , M Yaniv, K S Polonsky
J Clin Invest.
1998;
101(10)
:2215-2222.
https://doi.org/10.1172/JCI2548
.
Mutations in the gene for the transcription factor hepatocyte nuclear factor (HNF) 1alpha
cause maturity-onset diabetes of the young (MODY) 3, a form of diabetes that results from
defects in insulin secretion. Since the nature of these defects has not been defined, we
compared insulin secretory function in heterozygous [HNF-1alpha (+/-)] or homozygous
[HNF-1alpha (-/-)] mice with null mutations in the HNF-1alpha gene with their wild-type
littermates [HNF-1alpha (+/+)]. Blood glucose concentrations were similar in HNF-1alpha
(+/+) and (+/-) mice (7.8+/-0.2 and 7.9+/-0.3 mM), but were significantly higher in the
HNF-1alpha (-/-) mice (13.1+/-0.7 mM, P < 0.001). Insulin secretory responses to glucose and
arginine in the perfused pancreas and perifused islets from HNF-1alpha (-/-) mice were <
15% of the values in the other two groups and were associated with similar reductions in
intracellular Ca2+ responses. These defects were not due to a decrease in glucokinase or
insulin gene transcription. beta cell mass adjusted for body weight was not reduced in the
(-/-) animals, although pancreatic insulin content adjusted for pancreas weight was slightly
lower (0.06+/-0.01 vs. 0.10+/-0.01 microg/mg, P < 0.01) than in the (+/+) animals. In
summary, a null mutation in the HNF-1alpha gene in homozygous mice leads to diabetes
due to alterations in the pathways that regulate beta cell responses to secretagogues
including glucose and arginine. […]
Research Article
J. Clin. Invest.
© The American Society for Clinical Investigation, Inc. 0021-9738/98/05/2215/08 $2.00
Volume 101, Number 10, May 1998, 2215–2222 http://www.jci.org
Defective Insulin Secretion in Hepatocyte Nuclear Factor 1
a
–deficient Mice
Marco Pontoglio,* Seamus Sreenan,‡ Michael Roe,‡ William Pugh,‡ Diane Ostrega,‡ Antonia Doyen,* Anthony J. Pick,‡
Aaron Baldwin,‡ Gilberto Velho,** Philippe Froguel,‡‡ Matteo Levisetti,‡ Susan Bonner-Weir,¶ Graeme I. Bell,‡§i Moshe Yaniv,*
and Kenneth S. Polonsky‡
*Department des Biotechnologies, Unité de Recherche Associée 1644 du Centre National de la Recherche Scientifique, Institut Pasteur, 75015 Paris, France; ‡Department of Medicine, §Department of Biochemistry and Molecular Biology, and iHoward Hughes Medical
Institute, University of Chicago Pritzker School of Medicine, Chicago, Illinois 60637; ¶Joslin Diabetes Center, Boston, Massachusetts
02215; **INSERM U342, Hospital Saint-Vincent-de-Paul, 75014 Paris, France; and ‡‡Institut Pasteur de Lille, 59019 Lille, France
Abstract
Mutations in the gene for the transcription factor
hepato-cyte nuclear factor (HNF) 1a cause maturity-onset diabetes
of the young (MODY) 3, a form of diabetes that results from defects in insulin secretion. Since the nature of these defects has not been defined, we compared insulin secretory
func-tion in heterozygous [HNF-1a (1/2)] or homozygous
[HNF-1a (2/2)] mice with null mutations in the HNF-1a
gene with their wild-type littermates [HNF-1a (1/1)].
Blood glucose concentrations were similar in HNF-1a (1/1)
and (1/2) mice (7.860.2 and 7.960.3 mM), but were
signif-icantly higher in the HNF-1a (2/2) mice (13.160.7 mM,
P , 0.001). Insulin secretory responses to glucose and
argi-nine in the perfused pancreas and perifused islets from HNF-1a (2/2) mice were , 15% of the values in the other two groups and were associated with similar reductions in
intracellular Ca21 responses. These defects were not due to
a decrease in glucokinase or insulin gene transcription. b
cell mass adjusted for body weight was not reduced in the
(2/2) animals, although pancreatic insulin content
ad-justed for pancreas weight was slightly lower (0.0660.01 vs.
0.1060.01 mg/mg, P , 0.01) than in the (1/1) animals.
In summary, a null mutation in the HNF-1a gene in
ho-mozygous mice leads to diabetes due to alterations in the
pathways that regulate b cell responses to secretagogues
in-cluding glucose and arginine. These results provide further
evidence in support of a key role for HNF-1a in the
mainte-nance of normal b cell function. (J. Clin. Invest. 1998. 101: 2215–2222.) Key words: diabetes • insulin secretion •
hepato-cyte nuclear factor 1a • maturity-onset diabetes of the
young •b cell
Introduction
Maturity-onset diabetes of the young (MODY)1 is an
autoso-mal dominant form of non–insulin-dependent diabetes melli-tus in which affected subjects develop hyperglycemia generally before the age of 25 yr (1, 2). Mutations in the transcription factor hepatocyte nuclear factor (HNF) 1a are the cause of MODY3 (3), one form of MODY. The elevation in plasma glucose concentrations in MODY3 subjects appears to be due to abnormal b cell function (4, 5). We have observed previ-ously that insulin secretory responses to high glucose are con-sistently abnormal in MODY3 subjects before the onset of overt diabetes (4). A subsequent study in a larger cohort dem-onstrated reduced insulin concentrations in MODY3 subjects even under basal conditions, lending further support to the no-tion that MODY3 results from a primary defect in the pancre-atic b cell (5).
HNF-1a is involved in the transcription of a large set of he-patic genes including albumin, a-1 antitrypsin, a and b fibrino-gen, clotting factors, and apolipoproteins (6–11). HNF-1a is a dimeric homeodomain-containing protein that is expressed in liver, kidney, pancreas, and in the digestive tract. Complete de-ficiency of HNF-1a in mice was shown to be associated with hepatic dysfunction, phenylketonuria, and renal Fanconi syn-drome (12). A fraction of the mice lacking HNF-1a die shortly after weaning from a progressive wasting syndrome. Homozy-gous mutant mice have elevated phenylalanine levels due to a severe defect in the transcription of the phenylalanine hydrox-ylase gene. This transcriptional defect is due to a closed chro-matin conformation of the transcriptional control regions of the phenylalanine hydroxylase gene (13). Kidney proximal tu-bular reabsorption of glucose, phosphate, and amino acids is defective in these animals, leading to urinary wasting of sev-eral metabolites. This renal defect is due to a decrease in the transcription of specific sodium-dependent cotransporters (M. Pontoglio, unpublished observations).
Although HNF-1a has been shown to be a weak transacti-vator of the rat insulin 1 gene (14), it was not until it was deter-mined by positional cloning that mutations in HNF-1a were responsible for the MODY3 form of diabetes (3) that a role for this gene in glucose regulation and specifically b cell func-tion in humans was appreciated. However, the nature of the defects in b cell function resulting from a deficiency of HNF-1a has not been defined. In this report, we show that HNF-1a
mu-M. Pontoglio and S. Sreenan contributed equally to the conduct of this study.
Address correspondence to Kenneth S. Polonsky, M.D., Univer-sity of Chicago, Department of Medicine, 5841 S. Maryland Ave., MC 1027, Chicago, IL 60637. Phone: 773-702-6217; FAX: 773-834-0486; E-mail: [email protected]
Received for publication 17 December 1997 and accepted in re-vised form 4 March 1998.
1. Abbreviations used in this paper: AUC, area under the curve; BrdU, bromodeoxyuridine; [Ca21]
tant homozygous mice but not heterozygotes exhibit marked reductions in insulin secretory responses to glucose and argi-nine. The extent of the increase in blood glucose concentration is limited by the associated defect in glucose absorption in the proximal kidney tubule which results in urinary glucose wast-ing. These results suggest that HNF-1a plays an important role in pancreatic b cell function and glucose homeostasis.
Methods
Animals. HNF-1a–deficient mice were generated by replacing the first exon of the HNF-1a gene with the bacterial b-galactosidase cod-ing sequence followed by a neomycin expression cassette as described previously (12). Two independent mutations were produced, the only difference between them being the extent of the deletion. In the first (PH1), the deletion removes both the coding portion of the first exon and the first 4 kb of the first intron. The second (PH2) deletes only the coding portion of the first exon. Both mutations interrupt the transcription of the residual portion of the HNF-1a gene and do not result in the synthesis of a truncated protein.
Studies were performed on 2–24-wk-old HNF-1a (2/2) mice and their age-matched (except where otherwise stated) heterozygous [HNF-1a (1/2)] and wild-type [HNF-1a (1/1)] littermates. HNF-1a (2/2) mice fail to thrive, and demonstrate a clinical phenotype con-sistent with phenylketonuria and renal Fanconi syndrome (21). Ap-proximately 60% of the HNF-1a (2/2) mice survive to age 6–8 wk.
With the exception of glucose tolerance tests, all studies were per-formed on nonfasted mice. On the day of killing, mice were weighed, and tail blood samples were obtained for measurement of glucose (Hemocue AB, Angelholm, Sweden). Mice were killed by cervical dislocation.
Assessment of glucose tolerance. Intraperitoneal glucose tolerance tests (IPGTTs) were performed after a 4-h fast in HNF-1a (1/1) and (1/2) mice. IPGTTs were not performed in the HNF-1a (2/2) mice because they consistently demonstrated elevated fasting glucose con-centrations indicative of diabetes. Blood was sampled from the tail vein before and 30, 60, and 120 min after intraperitoneal injection of 2 g/kg dextrose.
b cell mass and replication. These measurements were performed
on pancreata obtained from HNF-1a (2/2), (1/2), and (1/1) ani-mals. After pancreatectomy, the pancreata were cleared of fat and lymph nodes, weighed, fixed in Bouin’s solution, and embedded in paraffin. b cell mass was measured by point-counting morphometry of insulin-immunostained pancreatic sections (3–5 mm) as described by Weibel (15) and as applied by Bonner-Weir (16) to endocrine pan-creas. A polyclonal guinea pig antiporcine insulin antibody was used. A 96-point transparent overlay was used for point counting. One ran-dom section of each block was scored systematically at a final magni-fication of 406. In nonoverlapping fields, the number of intercepts over b cell, endocrine non-b cell, exocrine pancreatic tissue, and non-pancreatic tissue was determined. A range of 48 to 226 fields was counted per animal (mean 157 fields). In the 2-wk-old animals, 34– 102 fields per animal were counted (mean 56). All sections were blinded before quantitation and read by one observer (A.J. Pick).
b cell mass was calculated by multiplying the pancreatic weight by the relative b cell volume. In this calculation, pancreatic weight was cor-rected for the presence of nonpancreatic tissue (fat, lymph nodes, bowel) seen histologically. The relative b cell volume represents the percentage of total points counted over pancreatic tissue that fall on
b cells.
For the measurement of b cell replication rates, 5-bromo-29 -deoxy-uridine (BrdU; Sigma Chemical Co., St. Louis, MO), 100 mg/kg body wt, was administered intraperitoneally 6 h before killing. Pan-creas sections (5 mm thick) were double-stained for BrdU and a mix-ture of non-b endocrine cells (antibodies directed against pancreatic polypeptide, somatostatin, and glucagon). Briefly, BrdU staining was performed by incubation with anti-BrdU mAb followed by a
peroxi-dase-conjugated anti–mouse IgG. Diaminobenzidine with nickel en-hancer was used as the chromogen (Cell Proliferation kit; Amer-sham Corp., Arlington Heights, IL).
b cell nuclei (defined as intraislet endocrine cells with a character-istic large round nucleus surrounded by relatively abundant cyto-plasm not staining for the red-brown signal from the immunostained mixture of non-b endocrine cells) were counted at a magnification of 912. BrdU positivity was characterized by nuclei with a black signal. All nuclei or the first 1,000 b cell nuclei were counted in each section, and data were expressed as the percentage of BrdU-positive b cells per total number of b cells.
Insulin secretion from the in situ–perfused pancreas. The
pan-creas was perfused in situ in a humidified, temperature-controlled chamber using a modification of a protocol described previously (17). The perfusate, introduced through the aorta at the level of the celiac artery, consisted of oxygenated KRB containing 0.25% BSA and a variable concentration of glucose. The perfusion system used three peristaltic pumps (Minipuls 2; Gilson, Inc., Middleton, WI), two of which were computer controlled to allow the perfusate glucose con-centration to increase progressively from 2 to 26 mM over 100 min, while maintaining a constant total flow rate of 1 ml/min. After 100 min, 20 mM arginine was perfused in the continued presence of 26 mM glucose for an additional 25 min. Before sample collection, the pan-creas was perfused with KRB/2 mM glucose for a 30-min equilibra-tion period. Insulin concentraequilibra-tions (picomoles per liter) were mea-sured in the effluent perfusate at 1 and 5 min, and every fifth minute thereafter.
Insulin secretion from isolated perifused pancreatic islets. Islet
iso-lation was accomplished by collagenase digestion and differential centrifugation through Ficoll gradients using a modification of pro-cedures described previously for rat islets (18). Insulin secretion was measured from islets incubated with 95% air/5% CO2 at 378C using a temperature-controlled multichamber perifusion system (ACUSYST-S; Cellex Biosciences, Inc., Minneapolis, MN). Groups of 75 islets were suspended in Bio-Gel P2 beads (Bio-Rad Laborato-ries, Hercules, CA) and modified KRB containing 2 mM glucose and 5 mg/ml BSA and placed in four parallel perifusion chambers. The perifusion system used two computer-controlled peristaltic pumps (Minipuls 2; Gilson, Inc.) to allow the perfusate glucose concentra-tion to increase progressively from 2 to 26 mM over 120 min, while maintaining a constant total flow rate. Before sample collection, islets were perifused with KRB containing 2 mM glucose for a 30-min equilibration period. After 120 min, 20 mM arginine was added in the continued presence of 26 mM glucose. Insulin concentrations were measured in the effluent perfusate in the first and fifth minute and ev-ery fifth minute thereafter, and expressed as picomoles per liter per 75 islets.
Assay methods. Insulin concentrations were measured by a
dou-ble-antibody RIA using a rat insulin standard. The intraassay coeffi-cient of variation for this technique is 7%. All samples were assayed in duplicate. Pancreatic insulin content was measured after acid etha-nol extraction of the whole pancreas (19) and quantified by RIA.
Intracellular Ca21 concentration ([Ca21]
i) in pancreatic islets. Af-ter isolation as described above, islets from HNF-1a (1/1), (1/2), and (2/2) mice were placed on 25-mm coverslips for 48–96 h to allow time for adherence, and set up in primary culture in supplemented RPMI 1640 containing 11.6 mM glucose, 10% (vol/vol) FCS, 100 mU/ml penicillin, and 100 mg/ml streptomycin. Before measurement of [Ca21]
i, the islets were loaded with fura-2 acetoxymethylester (Molec-ular Probes, Inc., Eugene, OR) and perifused at a flow rate of 2.5 ml/ min (378C) with KRB (without BSA) in a temperature-controlled microperifusion chamber (Medical Systems Corp., Greenvale, NY) mounted onto an inverted microscope (Nikon, Inc., Melville, NY) equipped for epifluorescence as described previously (20). Changes in [Ca21]
inten-sity (detected at 510 nm) after excitation at 340 and 380 nm (ratio 340/380).
Statistical analysis. Results are expressed as mean6SEM. In ex-periments involving multiple sampling times, average values for insu-lin secretion and area under the curve (AUC) for [Ca21]
i were used as summary measures. Since the data were not normally distributed, log transformations were carried out before comparison using a one-way ANOVA or nonpaired t test where appropriate. Tukey’s studentized range test was used for post hoc comparisons. Differences were con-sidered to be significant at P , 0.05.
Results
Increased blood glucose concentrations in HNF-1a (2/2) but not (1/2) mice. To define the state of glucose homeostasis in HNF-1a–deficient animals, blood glucose concentrations were measured in heterozygous and mutant homozygous mice. Table I summarizes these values in mice killed for studies on insulin secretion. HNF-1a (1/2) animals did not show any in-crease in blood glucose concentration compared with wild-type mice. Conversely, HNF-1a (2/2) mice had higher blood glucose concentrations than the animals in the other two groups and were significantly smaller, as reported previously (12). Whereas in young animals (2 wk of age), blood glucose concentration was only 20% higher than in controls, glycemia was 65% higher in surviving mutant mice at 6 wk of age (Table I). The HNF-1a (2/2) animals tended to be older at the time of study (Table I), although the differences were not statisti-cally significant. This stems from the fact that the size of the HNF-1a (2/2) mice was in general too small to perform the perfused pancreas experiments on younger animals. There-fore, in experiments involving the in situ–perfused pancreas, the HNF-1a (2/2) animals were matched for weight with ani-mals in the other two groups, and tended to be older.
IPGTTs. Since random blood glucose concentrations were similar in the HNF-1a (1/2) and (1/1) mice, the response to the intraperitoneal administration of glucose was measured because this is a more sensitive test of glucose tolerance. 10 an-imals were studied from each group. The mean age was 56.365.2 d and was identical in the two groups. Fasting (8.160.4 vs. 8.060.4 mM) and 30-min (25.561.6 vs. 2461.5 mM) glucose values were similar in the HNF-1a (1/2) and (1/1) mice, as were the overall mean glucose levels during this test.
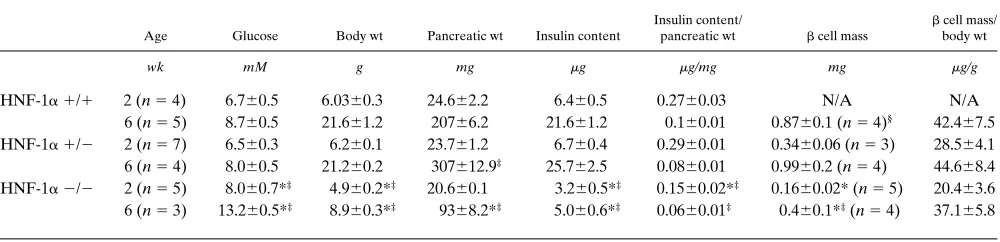
Pancreatic weight and insulin content (Table II). To under-stand better the nature of the defect in glucose homeostasis observed in HNF-1a–deficient mice, we measured pancreas weight and insulin content in animals at 2 wk of age and in the surviving animals after 6 wk. The results presented in Table II show that pancreas weight in the HNF-1a (2/2) mice was barely smaller than in the heterozygotes or wild-type animals at 2 wk of age. After 6 wk, the pancreas weight of mutant ho-mozygotes (9368.2 mg) was reduced significantly compared with both the (1/1) (20766.2 mg) and (1/2) (307612.9 mg) animals. However, since the body weight of the HNF-1a mu-tant animals is much smaller, this difference in pancreas weight is not significant after adjustment for the differences in body weight. Insulin content adjusted for the pancreas weight was reduced in the HNF-1a (2/2) mice at 2 wk of age, but at 6 wk these differences were significant only in comparison to the (1/1) animals.
[image:4.612.57.297.73.152.2]Pancreatic histology and b cell mass. To determine if ab-normalities were present in islet structure or b cell mass, pan-creatic sections obtained from the different genotypes were ex-amined by light microscopy and immunohistochemistry. Islets from HNF-1a (1/1) mice exhibited a core of b cells with uni-form, strong insulin immunostaining surrounded by a mantle of non-b cells (Fig. 1). Islets displayed a normal size distribu-tion, from very small (only a few cells in cross section) to large (200-mm cross section). Islets from HNF-1a (1/2) mice were similar to those from (1/1) mice in size distribution, organiza-tion, and insulin immunostaining (Fig. 1). Whereas occasional small islets of predominantly or exclusively insulin-stained cells (suggesting continued islet formation) were seen, islet hormone staining in duct epithelium was observed only rarely. In contrast, islets of HNF-1a (2/2) mice are smaller overall than those of the (1/1) or (1/2) animals, with only a few moderate to large islets and many small well-granulated islets (Fig. 1 C). In all but the smallest islets, the non-b cell mantle was more prominent than in islets of HNF-1a (1/1) and (1/2) Table I. Ages, Weights and Nonfasted Blood Sugars
Genotype Age Weight Blood glucose
d g mM
1/1 (n 5 14) 67.965.2 22.360.7 7.860.2
1/2 (n 5 15) 74.666.2 23.060.7 7.960.3
2/2 (n 5 15) 91.9611.6 16.061.1* 13.160.7*
[image:4.612.57.557.603.724.2]*P , 0.001 compared with 1/1 and 1/2 mice.
Table II. Pancreatic Insulin Content and b Cell Mass in 2- and 6-wk-old Mice
Age Glucose Body wt Pancreatic wt Insulin content
Insulin content/
pancreatic wt b cell mass
b cell mass/ body wt
wk mM g mg mg mg/mg mg mg/g
HNF-1a1/1 2 (n 5 4) 6.760.5 6.0360.3 24.662.2 6.460.5 0.2760.03 N/A N/A
6 (n 5 5) 8.760.5 21.661.2 20766.2 21.661.2 0.160.01 0.8760.1 (n 5 4)§ 42.467.5 HNF-1a1/2 2 (n 5 7) 6.560.3 6.260.1 23.761.2 6.760.4 0.2960.01 0.3460.06 (n 5 3) 28.564.1 6 (n 5 4) 8.060.5 21.260.2 307612.9‡ 25.762.5 0.0860.01 0.9960.2 (n 5 4) 44.668.4 HNF-1a2/2 2 (n 5 5) 8.060.7*‡ 4.960.2*‡ 20.660.1 3.260.5*‡ 0.1560.02*‡ 0.1660.02* (n 5 5) 20.463.6 6 (n 5 3) 13.260.5*‡ 8.960.3*‡ 9368.2*‡ 5.060.6*‡ 0.0660.01‡ 0.460.1*‡ (n 5 4) 37.165.8
mice, suggesting that the ratio of b to non-b cells was de-creased. This decrease may be due to a loss of b cells, as active neogenesis is evident in the ductal epithelium. Interestingly, there is little evidence of insulin degranulation, a characteristic feature of islets from diabetic animal models as well as from humans with diabetes.
b cell mass measurements were similar in (1/1) and (1/2) mice (0.8760.1 vs. 0.9960.2 mg) at 6 wk of age (Table II) and were not performed in 2-wk-old (1/1) animals. HNF-1a (2/2) mice demonstrated reduced b cell mass compared with the (1/2) mice at 2 and 6 wk and compared with the (1/1) mice at 6 wk. However, this reduction in b cell mass was propor-tional to the reduction in body weight, and the differences therefore became nonsignificant after adjustment for body weight (Table II).
To allow rates of b cell proliferation to be studied, the per-centage of S-phase cells, by BrdU incorporation, was mea-sured in the 6-wk-old animals. The results revealed low levels of BrdU incorporation in all three mouse groups, with values of 0.1160.07, 0.1460.11, and 0.1760.06% BrdU incorporation per 6 h in the HNF-1a (1/1), (1/2), and (2/2) animals, re-spectively. These differences were not statistically significant, indicating that a significantly higher proliferation rate was not present in the HNF-1a (2/2) b cells despite the presence of hyperglycemia.
Insulin secretory responses to glucose and arginine from the in situ–perfused pancreas and isolated perifused islets. Since the measurements of b cell mass, insulin content, and mor-phology did not reveal a defect severe enough to explain the alteration in glucose tolerance present in the homozygous mu-tant mice, the insulin secretory response to glucose and other secretagogues was measured directly. The relationship be-tween glucose and insulin secretion from the perfused
pan-creas is shown in Fig. 2. As the glucose concentration in the perfusate was increased from 2 to 26 mM, insulin secretory re-sponses were significantly different in the three groups (P , 0.0001 by ANOVA, Fig. 2 A). Mean insulin concentrations in the effluent perfusate were 36.665.4 pmol/liter in the HNF-1a (2/2) compared with 275.4631.2 and 229.2619.2 pmol/liter in the (1/1) and (1/2) mice, respectively. Only the differences between the (2/2) mice and the other two groups of mice were statistically significant (P , 0.005). The mean insulin re-sponse to 20 mM arginine (Fig. 2 B) in the continued presence of 26 mM glucose was also significantly lower (P , 0.00001) in the HNF-1a (2/2) mice (937.26112.2 pmol/liter) compared with the (1/1) and (1/2) mice (7984.86619.8 and 7544.46 582.6 pmol/liter, respectively).
Insulin secretion from perifused pancreatic islets after a ramp increase in the perifusate glucose from 2 to 26 mM fol-lowed by the administration of 20 mM arginine in the contin-ued presence of 26 mM glucose (Fig. 3, A and B) yielded simi-lar results to those obtained in the perfused pancreas. The mean insulin concentration of the effluent perifusate was 14.462.4 pmol/liter/75 islets in the (2/2) animals compared with 109.2612.0 and 126.669.0 pmol/liter/75 islets in the (1/1) and (1/2) mice, respectively [P , 0.01 by ANOVA and P , 0.02 for comparison of the (2/2) with (1/1) mice]. The mean insulin concentration during perifusion with arginine was 70.2612.6 pmol/liter/75 islets in the HNF-1a (2/2) mice com-pared with 534.0655.2 and 512.4641.4 pmol/liter/75 islets in the (1/1) and (1/2) mice, respectively (P , 0.03).
Changes in islet intracellular Ca21. To determine whether the reduction in the insulin secretory response to glucose was associated with reduced intracellular Ca21, changes in b cell [Ca21]
i were measured. After loading with the Ca21-sensitive
[image:5.612.58.551.61.273.2](AUC) was measured in perifused islets from the three groups of mice after glucose stimulation (Table III, and Fig. 4, A and B). Glucose-stimulated changes in [Ca21]
i in HNF-1a (1/2)
mouse islets were not significantly different from islets isolated from (1/1) mice. Therefore, the data from the control (1/1) and (1/2) mice were pooled and compared with the results from the (2/2) mice. The AUC in the (2/2) islets was signifi-cantly lower, as glucose was increased either as a ramp from 2 to 26 mM (14% of the value in the control islets, P , 0.005) or as a single step increase from 2 to 14 mM (13% of the value in control islets, P , 0.0001). However, the responses in [Ca21]
i
to 20 mM KCl were not significantly different in control and (2/2) islets. These results suggest that there is no defect in
voltage-dependent Ca21 channels on the b cell membrane in the homozygous mutant mice.
[image:6.612.62.550.60.233.2]Glucokinase and insulin mRNA levels. Since reduced ex-pression of the enzyme glucokinase could explain the decrease in insulin secretory responses to glucose present in the ho-mozygous mutant mice, experiments were performed to inves-tigate the possible consequences of HNF-1a inactivation on the expression of the glucokinase gene. Northern blot analysis was performed on total RNA from pancreas of HNF-1a –defi-cient animals. As illustrated in Fig. 5, glucokinase is expressed to similar levels in the controls and in HNF-1a–deficient ani-mals. In the Northern blot shown in Fig. 5, the signal in the mutant homozygotes is even higher than in controls. However, Figure 2. Insulin secretory responses to glucose and arginine in the in situ–perfused pancreas. During the first part of each experiment, the
per-fusate glucose concentration was increased progressively from 2 to 26 mM (A). Thereafter, in the continued presence of 26 mM glucose (hatched
bar), 20 mM arginine was added to the perfusate (B). The mean insulin output by pancreata of HNF-1a (2/2) mice (circles, n 5 3) was signifi-cantly less than that from HNF-1a (1/1) (triangles, n 5 5) and (1/2) (squares, n 5 5) mice in response to both glucose and arginine (P , 0.005 in each case).
Figure 3. Insulin secretory responses to glucose and arginine in perifused islets. Insulin secretion by isolated islets was measured in response to a
[image:6.612.62.551.513.681.2]in other experiments, the increase was much less significant. We also monitored, in a parallel RNA sample, steady state in-sulin mRNA levels. The results show that inin-sulin mRNA is not changed significantly in HNF-1a mutant mice, in agreement with the b cell mass measurements reported above (Fig. 5).
Discussion
MODY3 is the most common form of MODY, and subjects with this form of diabetes exhibit reduced insulin secretion
even before the onset of overt clinical disease. This suggests that the site of the primary defect is in the pancreatic b cell (4). The demonstration that MODY3 results from mutations in HNF-1a (3) indicates an unanticipated role for this transcrip-tion factor in determining pancreatic b cell function. Although clinical and genetic studies in MODY3 have defined a link be-tween mutations in HNF-1a and diabetes due to reduced insu-lin secretion, the nature of the defects in the b cell responsible for the reductions in insulin secretion is unclear.
One goal of these studies was to determine whether HNF-1a (2/2) or (1/2) mice constitute a valid experimental model for MODY3 and more generally for non–insulin-dependent diabetes mellitus. In addition, we hoped to gain insight into the nature of the b cell defects responsible for the MODY3 phe-notype.
In comparison to their wild-type or heterozygous litter-mates, the HNF-1a (2/2) mice have a 20% increase in blood glucose at 2 wk of age. Measurements in the fraction of ani-mals that survive weaning showed that blood glucose concen-trations are increased by 65% in 6-wk-old homozygous ani-mals. These data clearly show that HNF-1a–deficient animals are indeed diabetic. In an attempt to understand the patho-Table III. [Ca21]
i AUCs in Control [HNF-1a (1/1) and
(1/2)] and HNF-1a (2/2) Mice in Response to Glucose Stimulation
Control HNF-1a (2/2)
2–26-mM ramp 33766350 (n 5 10) 4626126* (n 5 6) 2–14-mM step 397657 (n 5 14) 53615‡ (n 5 12)
[image:7.612.56.298.95.146.2]*P , 0.005 compared with controls. ‡P , 0.0001 compared with con-trols.
Figure 4. Measurements of [Ca21]
i in perifused islets. (A) Changes in [Ca21]i in response to a progressive increase in perifusate glucose from 2 to 26 mM over 48 min (hatched bar). Top, Data from control islets [(1/2) or (1/1)]. Middle, Results from (2/2) islets. (B) Changes in [Ca21]
i in response to a single step increase in perifusate glucose from 2 to 14 mM glucose (hatched bar) followed by the administration of 20 mM KCl (solid bar). Top, Data from control islets [(1/2) or (1/1)]. Middle, Results from (2/2) islets. Bottom, A and B, Summaries of the area under the [Ca21]
[image:7.612.64.551.332.669.2]physiologic basis of the elevation in blood glucose concentra-tions, we studied a number of parameters of b cell function. Although b cell mass and insulin content were reduced in the homozygous mutant mice, when normalized for body weight, only the insulin content differences between the homozygous mutant animals and the wild-type controls remained statisti-cally significant at 6 wk of age. This reduction in insulin con-tent is not due to a decrease in insulin mRNA, and further studies will be necessary to elucidate its basis.
The major factor responsible for the development of diabe-tes in the (2/2) animals appears to be a severe reduction in the insulin secretory response to glucose and arginine, demon-strated in this study, in both the in situ–perfused pancreas and perifused islets. As the perfusate glucose was raised from 2 to 26 mM, or when arginine, a nonglucose secretagogue, was ad-ministered, insulin secretion was reduced substantially in the (2/2) animals, representing z13% of the insulin secretory re-sponses in the wild-type littermates. The reduction in insulin content alone does not appear to be sufficiently severe to account for the impairment of insulin secretion that we ob-served in HNF-1a–deficient animals. By contrast, heterozy-gous HNF-1a (1/2) mice were not diabetic and exhibited nor-mal insulin secretory responses to glucose and arginine. The reduced insulin secretory responses were associated with par-allel reductions in intracellular Ca21 accumulation after glu-cose perifusion of b cells isolated from HNF-1a (2/2) mice.
Since HNF-1a (2/2) mice are hyperglycemic from an early age, it could be reasoned that the defects in insulin secretion are secondary to prolonged hyperglycemia and that the pri-mary defect is an increase in hepatic glucose production or some other abnormality in the pathway of insulin action. How-ever, if b cell function was completely normal in these mice, the compensatory increase in insulin secretion would have been expected to prevent an increase in plasma glucose con-centrations resulting from a possible increase in hepatic glu-cose production in the HNF-1a (2/2) animals. Furthermore, induction of hyperglycemia in rodents with initially normal
b cell function has been shown to lead to an increase in b cell mass (21) rather than to the decrease observed in these stud-ies. In addition, it has been demonstrated that the insulin secretory response to arginine at high glucose generally paral-lels changes in b cell mass in other animal models of hypergly-cemia (22). However, in the present studies, the insulin secre-tory responses to glucose and arginine from the perfused pancreas were reduced, whereas b cell mass was appropriate for the size of the animals, suggesting an intrinsic defect in b cell signaling. Although it is possible that the defect in secre-tion may have been aggravated by chronic exposure to high glucose, the data cited above strongly suggest that a primary
intrinsic defect in the insulin secretory pathways in HNF-1a (2/2) mice is responsible for the increase in plasma glucose.
The insulin secretory response of the perfused pancreas in HNF-1a (2/2) mice was reduced by 87% compared with con-trols, and the extent of this defect was greater than the reduc-tion in b cell mass (to 46% of control values). The reduction in
b cell mass in the (2/2) mice was proportional to the reduc-tion in the size of the animals. Previous studies in normal rats (21) have demonstrated that a 96-h intravenous glucose infu-sion leads to a 50% increase in b cell mass due to b cell hyper-plasia and hypertrophy. Despite the presence of hyperglyce-mia, b cell mass was not increased in the (2/2) animals, and the percentage of BrdU incorporation into b cells over a 6-h period was similar to that seen in animals from the other two groups, indicating that hyperglycemia failed to induce a prolif-erative b cell response in the (2/2) mice. Taken together, these results suggest that abnormal regulation of b cell mass is not the key defect responsible for diabetes in HNF-1a (2/2) mice, but they also suggest the presence of a defect in b cell mass compensation for hyperglycemia.
Diabetes in the HNF-1a (2/2) animals therefore appears to be multifactorial in origin, resulting from defects in the sig-naling pathways of insulin secretion in the b cell in conjunction with an inability of b cell mass to increase appropriately in re-sponse to hyperglycemia. Histological examination of the pan-creatic sections stained for insulin revealed less severe degran-ulation of insulin-containing cells than expected for the degree of hyperglycemia present in the HNF-1a (2/2) mice. This finding is consistent with the conclusion that severe defects are present in the metabolic signaling pathways in the b cell.
Although blood glucose concentrations were clearly in-creased in the (2/2) animals, the extent of the increase is less than might have been anticipated in light of the severity of the insulin secretory defect. The most likely explanation for this finding is the profound renal glucose wasting due to the pres-ence of a renal proximal tubular defect (renal Fanconi syn-drome) that has been observed in HNF-1a–negative animals (12). In other words, an important contribution to glucose ho-meostasis in the mutant animals could be provided by the dy-namic equilibrium between renal glucose wasting and the insu-lin secretion defect.
[image:8.612.69.464.57.176.2]One surprising aspect of these results is the consistently normal glucose tolerance and insulin secretory function in the heterozygous HNF-1a (1/2) mice. This is in marked contrast to the situation in humans, where mutations in one allele of the HNF-1a gene lead to defective insulin secretion and diabetes. The reasons for these differences between humans and mice are unclear. It is possible that the b cells of mice are better able to compensate for the reduction in HNF-1a activity than are
Figure 5. Northern blot analysis of total
those of humans. Alternatively, it is possible that some of the human mutations have dominant negative effects on insulin secretion that are not seen when one allele of the HNF-1a gene has been inactivated.
In summary, HNF-1a (2/2) mice have profound alter-ations in the insulin secretory response to an increase in glu-cose and arginine. Therefore, the results presented here lend further support to the concept that the HNF family of tran-scription factors plays a key role in the maintenance of normal insulin secretion and adaptive b cell responses to hypergly-cemia.
Acknowledgments
The authors thank Ms. Kimberly Biskup for expert technical assis-tance.
This research was supported by the National Institutes of Health grants DK-31842, DK-20595, and DK-44840 and by the Jack and Dol-lie Galter Center of Excellence of the Juvenile Diabetes Foundation International, the Blum Kovler Foundation, and the Mazza Founda-tion.
References
1. Fajans, S.S., G.I. Bell, D.W. Bowden, J.B. Halter, and K.S. Polonsky. 1996. Maturity onset diabetes of the young (MODY). Diabet. Med. 13(Suppl. 6):S90–S95.
2. Froguel, P. 1996. Glucokinase and MODY: from the gene to the disease. Diabet. Med. 13(Suppl. 6):S96–S97.
3. Yamagata, K., N. Oda, P.J. Kaisaki, S. Menzel, H. Furuta, M. Vaxillaire, L. Southam, R.D. Cox, G.M. Lathrop, V.V. Boriraj, et al. 1996. Mutations in the hepatocyte nuclear factor-1alpha gene in maturity-onset diabetes of the young (MODY3). Nature. 384:455–458.
4. Byrne, M.M., J. Sturis, S. Menzel, K. Yamagata, S.S. Fajans, M.J. Drons-field, S.C. Bain, A.T. Hattersley, G. Velho, P. Froguel, et al. 1996. Altered insu-lin secretory responses to glucose in diabetic and nondiabetic subjects with mu-tations in the diabetes susceptibility gene MODY3 on chromosome 12. Diabetes. 45:1503–1510.
5. Lehto, M., T. Tuomi, M.M. Mahtani, E. Widen, C. Forsblom, L. Sarelin, M. Gullstrom, B. Isomaa, M. Lehtovirta, A. Hyrkko, et al. 1997. Characteriza-tion of the MODY3 phenotype. Early-onset diabetes caused by an insulin se-cretion defect. J. Clin. Invest. 99:582–591.
6. Cereghini, S., M. Raymondjean, A.G. Carranca, P. Herbomel, and M.
Yaniv. 1987. Factors involved in control of tissue-specific expression of albumin gene. Cell. 50:627–638.
7. Maire, P., J. Wuarin, and U. Schibler. 1989. The role of cis-acting pro-moter elements in tissue-specific albumin gene expression. Science. 244:343–346.
8. Courtois, G., J.G. Morgan, L.A. Campbell, G. Fourel, and G.R. Crab-tree. 1987. Interaction of a liver-specific nuclear factor with the fibrinogen and alpha 1-antitrypsin promoters. Science. 238:688–692.
9. Bancroft, J.D., S.A. McDowell, and S.J. Degen. 1992. The human pro-thrombin gene: transcriptional regulation in HepG2 cells. Biochemistry. 31: 12469–12476.
10. Brooks, A.R., and B. Levy-Wilson. 1992. Hepatocyte nuclear factor 1 and C/EBP are essential for the activity of the human apolipoprotein B gene second-intron enhancer. Mol. Cell. Biol. 12:1134–1148.
11. Tronche, F., F. Ringeisen, M. Blumenfeld, M. Yaniv, and M. Pontoglio. 1997. Analysis of the distribution of binding sites for a tissue-specific transcrip-tion factor in the vertebrate genome. J. Mol. Biol. 266:231–245.
12. Pontoglio, M., J. Barra, M. Hadchouel, A. Doyen, C. Kress, J.P. Bach, C. Babinet, and M. Yaniv. 1996. Hepatocyte nuclear factor 1 inactivation re-sults in hepatic dysfunction, phenylketonuria, and renal Fanconi syndrome. Cell. 84:575–585.
13. Pontoglio, M., D.M. Faust, A. Doyen, M. Yaniv, and M.C. Weiss. 1997. Hepatocyte nuclear factor 1alpha gene inactivation impairs chromatin remodel-ing and demethylation of the phenylalanine hydroxylase gene. Mol. Cell. Biol. 17:4948–4956.
14. Emens, L.A., D.W. Landers, and L.G. Moss. 1992. Hepatocyte nuclear factor 1a is expressed in a hamster insulinoma line and transactivated the rat in-sulin I gene. Proc. Natl. Acad. Sci. USA. 89:7300–7304.
15. Weibel, E.R. 1978. Stereologic methods. In Practical Methods for Bio-logic Morphometry. Vol 1. Academic Press Ltd., London. 101–161.
16. Bonner-Weir, S. 1994. Regulation of pancreatic beta-cell mass in vivo. Recent Prog. Horm. Res. 49:91–104.
17. Sreenan, S., J. Sturis, W. Pugh, C.F. Burant, and K.S. Polonsky. 1996. Prevention of hyperglycemia in the Zucker diabetic fatty rat by treatment with metformin or troglitazone. Am. J. Physiol. 271(Endocrinol. Metab. 34):E742– E747.
18. Sturis, J., W.L. Pugh, J. Tang, D.M. Ostrega, J.S. Polonsky, and K.S. Po-lonsky. 1994. Alterations in pulsatile insulin secretion in the Zucker diabetic fatty rat. Am. J. Physiol. 267(Endocrinol. Metab. 30):E250–E259.
19. Montana, E., S. Bonner-Weir, and G.C. Weir. 1993. b cell mass and
growth after syngeneic islet cell transplantation in normal and streptozotocin diabetic C57BL/6 mice. J. Clin. Invest. 91:780–787.
20. Roe, M.W., R.J. Mertz, J.F. Worley III, and I.D. Dukes. 1993. Voltage dependent intracellular calcium release from mouse islets stimulated by glu-cose. J. Biol. Chem. 268:9953–9956.
21. Bonner-Weir, S., D. Deery, J.L. Leahy, and G.C. Weir. 1989. Compen-satory growth of pancreatic beta-cells in adult rats after short-term glucose infu-sion. Diabetes. 38:49–53.


![Table III. [Ca2�]i AUCs in Control [HNF-1� (�/�) and(�/�)] and HNF-1� (�/�) Mice in Response toGlucose Stimulation](https://thumb-us.123doks.com/thumbv2/123dok_us/8215552.819956/7.612.64.551.332.669/table-iii-aucs-control-mice-response-toglucose-stimulation.webp)

