2018 International Conference on Physics, Computing and Mathematical Modeling (PCMM 2018) ISBN: 978-1-60595-549-0
Research and Application of Improved K-means
Algorithm in Text Clustering
Shen-yi QIAN, Hui-hui LIU
*and Dai-yi LI
School of Computer and Communication Engineering, Zhengzhou University of Light Industry, Zhengzhou, Henan, 450002, P.R. China
*Corresponding author
Keywords: K-means clustering algorithm, Hierarchical clustering algorithm, Text distance, Objective function, F measure.
Abstract. K-means is a commonly used text clustering algorithm, the biggest advantage of the
proposed algorithm is simple and fast, but due to the random selection of the initial cluster center point, the K-means algorithm is easy to fall into the local optimal algorithm and instability of the clustering results and the number of iterations. To solve this problem, this paper selected the initial cluster centers using hierarchical agglomerative clustering algorithm, to ensure the high quality of the center point; using cosine similarity to measure the distance between the text; reconstructed calculation formula of cluster center and the objective function of clustering quality. The experimental results show that the improved K-means algorithm has a relatively high accuracy and stability with the Sogou Chinese text corpus as the data set.
Introduction
With the rapid development of the Internet, communications, computer and network technology with each passing day, people use a variety of information and data is growing rapidly. However, the mass of information bring convenience to people, but also brought many problems, for example, excessive information is difficult to digest, the information is difficult to distinguish true and false, information security is difficult to guarantee, information forms are difficult to unify and so on, so how to obtain information from the massive text information has become the focus of the current research on computer information theory[1-2]. Clustering, as an important branch of data mining, has a wide range of applications. Compared with other data mining methods, clustering has the advantage of no prior learning, and it can find the distribution of data from the data set and then acquire the knowledge. Clustering is the process of grouping the set of physical or abstract objects according to the similarity of the relevant features.[3] The purpose of clustering is to make the sample characteristics in the same cluster as similar as possible, while the differences between the samples of different clusters are increased as much as possible.
Text Preprocessing
Text Vectorization
In order to convert the data into a record that the computer can read, this paper uses the Vector Space Model (VSM) to represent each text. [8] The basic idea of this model is to express the sample set as a text set D = {D1, D2, ..., Dn}. Each of the text Di is considered as a set of terms (t1, t2, ..., tn), for the entry ti, according to its importance in the text to give a certain weight wi, Thus, the text Di is represented as:
1 1 2 2
{( , ), ( , ), , ( , )}
i n n
D t w t w …… t w (1) The weight of each eigenvector ti in the text Dj is calculated by the TF-IDF weighted algorithm[9]:
2
1log 0.01
(0 1)
log ( 0.01) i
i
i N i
ik
k i
N tf
DF t
W w
N tf
DF t
(2)Where tfi is the frequency of the entry appears in the text; N is the total number of text,DF t( )i is
the number of text that contains the entry ti for the text set; the denominator in the formula is the normalization factor. Thus the vectorization of the text is shown below:
1 1 2 2
{( : ), ( : ), ( : )}
i i i i i in in
d t w t w ……,t w (3)
That is to say, tij denotes the jth entry of the ith text, wij denotes the weight of the term, and n denotes the number of entries in the vector. In the text vector, the value on the corresponding dimension of the word is the above weight, the result of this weighting is that the weight of the stop word is small and the weight of the rare word is large.
Text Distance
After the text is represented by the vector space model (VSM), the similarity between texts can be measured. In this paper, the cosine distance measure is chosen to measure the distance between two texts.[10] The Cosine Distance The cosine distance measure can be measured by the angle between the two vectors which formed by the point of origin pointing to two points, when the angle is relatively small, the direction of the vector is roughly same, which can be considered similar (That is, the similarity of the two texts is high). The higher the similarity between texts, the smaller the distance between texts, therefore the cosine value is subtracted from 1 to obtain a reasonable distance as the cosine measure distance (ie, the distance of the text).
The smaller the angle, the larger the cosine value, the smaller the distance of the text (the higher the text similarity). Let di and dj be vectors of two texts, Sim d d( ,i j) is the cosine of two text vectors,
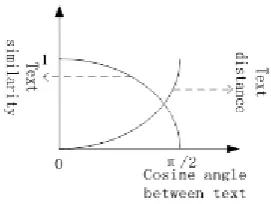
( ,i j)
[image:2.595.220.356.666.768.2]Dis d d is the distance between two texts, then the distance between the text as shown in equation (4). The text similarity and text distance are shown in Figure 1:
( ,i j) 1 ( ,i j) 1 i j
i j d d Dis d d Sim d d
d d
(4)
Traditional K-means Algorithm
K-Means algorithm is a commonly used clustering method in text clustering, and it is widely used in most other situations. The K-Means algorithm mainly uses a kind of iterative idea, and its basic algorithm idea is as follows:
Suppose there are N samples, which need to be clustered into K clusters. The first randomly selected K samples as the center of the cluster, and then the rest of the sample according to the similarity with the K cluster center (text distance), were assigned to the most similar cluster, then the algorithm is iterative processing and adjust the center position, until the maximum number of iterations, or the target function starts to converge (that is, the center position is no longer changing). Each iteration is divided into two steps. The first step, find the closest point to the center, and assign these data points to the corresponding cluster. The second step is to update the center position with the coordinate mean value of all points in each cluster.
In general, the sum of squares of errors is chosen as the objective function to measure the quality of clustering, and the definition is as shown in equation (5) [11]:
2 1
| |
i
k
i i x C
SSE X X
(5)Where Kis the total number of clusters; Ci is the ith cluster; X is an object in the cluster; Xi is the center of the cluster (centre of mass), the mean of all the objects in the cluster.
The algorithm process is as follows:
(1) Randomly select K text as the center point from N texts;
(2) Measure the distance to each center point for each remaining text, select the cluster closest to the center point, and place the text in the cluster;
(3) Recalculate the center point of each cluster that has been obtained, the center point is the arithmetic mean of all points in the cluster, and the objective function value SSE at this time is calculated by the formula (5);
(4) Repeat 2~3 steps until the new central point is equal to the original center point, or the absolute value difference between the objective function values of the previous two iterations is less than the specified threshold, and the algorithm is finished.
Improved K-means Algorithm
Selection of Initial Cluster Centers
Since the traditional K-means algorithm chooses the initial cluster center randomly, it is easy to fall into the local optimum, but the global optimal solution can not be obtained; In addition, different initial cluster centers can obtain different clustering results, which leads to instability of clustering results. At the same time, random selection of initial cluster centers is easy to increase the number of iterations, resulting in an increase in total time consuming. In this paper, the initial cluster center of the sample set is selected by the hierarchical clustering algorithm, and the initial cluster center with high quality is obtained. The initial cluster center selection process is as follows:
(1) The N samples in the sample set are considered as N individual clusters, and the distance between the cluster and the cluster is the distance between the objects they contain;
(2) Find the closest two clusters to merge into a cluster, the total number of clusters will be reduced by one;
(5) Finally, we select the central point of k clusters as the initial cluster center of K-means algorithm.
The distance between objects is chosen to use the text distance in 1.2, as in equation (4); the center of each cluster is represented by the centroid of the cluster, and the centroid of the cluster is shown in equation (6):
1
i
i
X C i
X X
m
(6)Where Ci is the ith cluster; Xi is mean of cluster Ci(centre of mass); mi is the number of objects
in the cluster Ci; X is the object in the cluster Ci.
The Whole Process of Improved K-means Algorithm
The overall flow of the algorithm is shown in Figure 2: The specific process of the algorithm is as follows:
Input: When the absolute value of the difference between the two values of the objective function SSE is less than , the iteration is terminated; The total number of clusters is K and N vectorization of the text set.
Output: K clusters satisfying the termination condition of iteration.
(1) Select the initial center point of K clusters using the method in Section 4.1.
(2) Calculate the distance between the remaining text and the center of the K cluster, and classify the text as the nearest cluster.
(3) Recalculate the center of each cluster (centre of mass), as shown in equation (6), and calculate the objective function value SSE at this time, as shown in equation (5).
(4) Assuming that A and B represent the objective function values of the last iteration and the objective function values of the iteration, when E1E2 , then the iteration ends and outputs the result.
Experiment and Analysis
Introduction of Experiment
In order to verify that the improved K-means algorithm is effective and stable, this paper analyzes and compares the original K-means and the improved k-means algorithm respectively. In the course of the experiment, the selected data set is from the Chinese text corpus provided by Sogou laboratory[12]. This paper chooses 1000 documents in the experimental data set as the sample of the experiment, including five categories: military, health, tourism, culture and education. The experiment uses the Python-based jieba Chinese word segmentation module to segment the text, delete the stop word, and use VSM to implement the text vectorization and other preprocessing operations. Because the original K-means clustering algorithm randomly selects the center of the initial cluster, which is easy to cause the instability of the clustering result. In this paper, the original algorithm and the improved algorithm are simulated five times by setting different feature extraction rates. Finally, we compare the quality of clustering from the experimental results. In this paper, the F-metric is chosen to evaluate the effect of clustering. The F-metric is the harmonic mean of the precision P and the recall R. The definition of P, R, and F metrics is as follows:
TP P
TP FP
TP R
TP FN
2
2
1 PR F
P R
2 0,
(7)
Text Data Set
Text Vectorization TF-IDF
VSM
Hierarchical clustering algorithm selects K center
points
Find the nearest cluster center and document the
clusters
Updating cluster centers based on the mean of
samples in clusters
Vectorization
Improved K-means Text Clustering
Cluster centers converge or merge into
K clusters
Output clustering results yes
[image:5.595.157.417.67.345.2]no
Figure 2. Improved K-means algorithm for the whole process of text clustering.
The experimental environment is Linux, NVidia Tesla GPU, memory32G, Python3.5, Numpy, Sklearn.
Analysis of Experimental Results
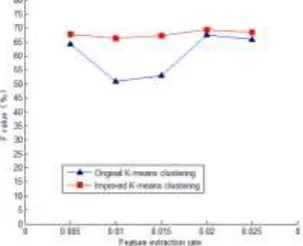
[image:5.595.56.538.475.573.2]Five experiments were carried out with the original k-means clustering and the improved K-means clustering respectively. The experimental results are shown in Table 1:
Table 1. Comparison of clustering results for two clustering algorithms.
V Original K-means algorithm Improved K-means algorithm
P/% R/% F/% P/% R/% F/%
0.005 70.55 58.96 64.24 70.53 65.32 67.82
0.01 56.53 46.34 50.93 71.13 62.17 66.35
0.015 54.62 51.26 52.89 68.23 66.35 67.28
0.02 65.12 70.08 67.51 70.02 68.93 69.47
0.025 68.41 63.59 65.91 69.64 68.46 68.43
According to the comparison of the two clustering algorithms in Table 1, we use Matlab software to draw the comparison graph of two clustering algorithms, and including the F-metric of two clustering algorithms, as shown in Figure 3:
[image:5.595.220.372.637.760.2]As can be seen from Table 1 and Figure 3, the average F-metric of the primary clustering algorithm is 60.3%, which is lower than the average F-metric of the improved K-means clustering of 67.87%. The original K-means clustering algorithm due to the randomness of the initial clustering center selection, easy to select isolated points in data set, which leads to the clustering results will produce large fluctuations, so that reduce the quality and stability of clustering. The improved K-means clustering algorithm uses a hierarchical clustering algorithm to select a reasonable clustering initial center, and then uses the resulting initial center for k-means clustering. The clustering results tend to be stable and the quality of clustering is relative to the original K-means clustering algorithm has some improvement. The above results show that the improved K-means algorithm has relatively high accuracy and stability.
Conclusions
Because of the randomness of the initial cluster center selection in the original K-means clustering algorithm, the clustering results are prone to local optimization, unstable clustering results and too many iterations. Therefore, this paper uses the hierarchical clustering algorithm to select the initial cluster center point and obtain the high quality initial cluster center. The experimental results prove the effectiveness and stability of the improved algorithm. Although hierarchical clustering algorithm can obtain high quality clustering and initial cluster center, the algorithm has large amount of computation and high storage requirements, so how to improve the hierarchical clustering algorithm to achieve higher efficiency needs to be further studied.
References
[1]Likas A, Vlassis N J, Verbeek J. The global K-means clustering algorithm[J]. Pattern Recognition, 2003, 36( 2): 451-461.
[2]Jie Z, Improvement and Application of a K - means Clustering Algorithm [J]. Application Research of Computers. 2015(01)
[3] Yu Hong W. Summary of clustering algorithms [J]. Computer Science, 2015, 01:48-61.
[4]Xiao Feng L. An Efficient Clustering Algorithm Based on K - means Local Optimality[J]. Journal of Software, 2008, 19(7):1683-1692.
[5]Bin L. A New Clustering Algorithm in Large Data Environment [J]. Computer Science. 2015, 12: 52-54.
[6]Shi Zhuo Z. Research on Text Classification Application Based on Semi-supervised LDA [J]. Software, 2014, 35(1): 46-48.
[7] Dong Hai Z. Research on K-means Text Clustering Algorithm for Selecting Initial Cluster by Maximum Distance Method [J]. Application Research of Computers. 2014,03:55-57.
[8]Yu Z. Vector similarity measure method [J]. Acoustics, 2009, 04: 532-536.
[9]Cheng Hui H. A Text Similarity Measure Method Based on Semantic Information and TF - IDF Method [J]. Journal of Computer Science, 2011, 34(5): 856-864.
[10]Xue Feng Z. An Improved K-means Algorithm Based on Clustering Criterion Function. Computer Engineering and Applications, 2011, 47(11):123-127.
[11]Chang Zheng X. A k-means Algorithm for Optimizing Initial Clustering Center Based on Mean Density [J]. Computer Engineering and Applications. 2014, 20: 46-47.