R E S E A R C H A R T I C L E
Open Access
Is tea consumption associated with the
serum uric acid level, hyperuricemia or the
risk of gout? A systematic review and
meta-analysis
Yi Zhang
1†, Yang Cui
2†, Xuan-an Li
1, Liang-jun Li
1, Xi Xie
1, Yu-zhao Huang
1, Yu-hao Deng
1, Chao Zeng
1and Guang-hua Lei
1*Abstract
Background:The aim of this study was to examine the associations of tea consumption with the serum uric acid (SUA) level, hyperuricemia (HU) and the risk of gout.
Methods:A comprehensive literature search up to June 2016, using PUBMED and EMBASE databases, was conducted to identify the relevant observational studies that examined the associations of tea consumption with the SUA level, HU and the risk of gout.
Results:A total of fifteen observational studies were included in this study, and nine studies were extracted for meta-analysis. For the SUA level, seven studies were included. According to the combined weighted mean difference (WMD), there was no significant difference between the highest and the lowest tea intake category in terms of the SUA level (WMD = 7.41μmol/L, 95%CI:−2.34 to 17.15;P =0.136). In subgroup analysis including three studies, green tea consumption was positively associated with the SUA level (WMD = 17.20μmol/L, 95%CI: 7.00 to 27.40;P =0.01). For the prevalence of HU, five studies were included. The overall multi-variable adjusted odds ratio (OR) for the highest versus the lowest category of tea consumption was 0.98 (95%CI: 0.77 to 1.24;P =0.839). For the risk of gout, two prospective cohort studies showed that there was no relationship between tea consumption and the risk of gout in males and females, respectively.
Conclusion:The current evidences suggest that tea consumption does not seem to be associated with the SUA level, HU and the risk of gout. However, due to the limited number of studies, green tea consumption might be positively associated with the SUA level. More well-designed prospective cohort studies are needed to elaborate these issues further.
Keywords:Tea, Serum uric acid, Hyperuricemia, Gout, Systematic review, Meta-analysis
Background
Hyperuricemia (HU) is a major cause of disability, which has drawn increasing attention in recent decades
be-cause of its high prevalence in the global context [1–3].
HU occurs when the concentration of serum uric acid (SUA), determined by the production and excretion of
urate, exceeds a normal standard. Epidemiological findings have shown that around 21.4% of American adults suffer from HU [4], while the prevalence of HU in some Asian
countries ranges from 13 to 25.8% [5–9]. Emerging data
indicated that HU can increase the risk of hypertension, cardiovascular disease, diabetes and chronic kidney
dis-ease [10–13]. HU is also known as the precursor of gout,
the most common inflammatory arthritis in adult men [14]. In the presence of SUA concentration above
satur-ation levels (≥410 mmol/L, 6.8 mg/dL), monosodium
urate (MSU) crystals form at physiological temperature
* Correspondence:[email protected] †Equal contributors
1Department of Orthopaedics, Xiangya Hospital, Central South University, No.87 Xiangya Road, Changsha, Hunan Province 410008, China Full list of author information is available at the end of the article
and pH [15]. The host response to MSU crystals leads to the clinical manifestations of gout, such as acute flares and tophaceous disease [16, 17]. There are several risk fac-tors for gout, including obesity [18], hypertension [19] and certain aspects of diet, including the intake of alcohol [20] and purine-rich foods [21]. However, the specific patho-genesis of HU and gout has not yet been fully elucidated. Both the American College of Rheumatology (ACR) and the European League Against Rheumatism (EULAR) guidelines for the management of gout support diet modi-fication alongside pharmacologic interventions [22, 23]. Thus, identifying the modifiable dietary factors for HU or gout appears to be an important step in the prevention and management of these conditions.
Tea, derived from the leaves of the Camellia sinensis plant, is one of the most popular beverages consumed worldwide [24], especially in Eastern European and Asian countries [25]. Tea contains several kinds of anti-oxidants including flavonoid, catechin, thearubigin and theaflavin [26]. It is noteworthy that tea is negatively
as-sociated with depression, cancer, Parkinson’s disease and
cardiovascular disease [24, 25, 27, 28]. Several studies have reported that green tea extracts may decrease SUA
levels in animals [29–31]. Therefore, a similar effect in
humans may influence the prevalence of HU or gout, but current research from epidemiological studies
remains unclear [32–38]. Thus, the present systematic
review and meta-analysis of observational studies aimed at investigating the associations of tea consumption with the SUA level, HU and the risk of gout. It was hypothe-sized that tea consumption is inversely associated with the SUA level, HU and the risk of gout.
Methods
Search strategy
This systematic review and meta-analysis was performed with referencing to the Preferred Reporting Items for Systematic review and Meta-analyses (PRISMA) state-ment [39]. The electronic databases of PUBMED and EMBASE were searched up to June 2016, using a series of logic combinations of keywords and in-text words
that are related to uric acid (‘uric acid’,‘gout’,‘
hyperurice-mia’,‘urate’,‘hyperuricaemia’) and tea (‘tea’). The search
string is included in supplementary material (Additional file 1). No language restriction was imposed. The refer-ences of the retrieved articles and reviews were evaluated.
Study selection
Two researchers (YZ and GHL) reviewed the titles, ab-stracts and full texts of all retrieved studies independently. Disagreements, if any, were resolved by discussions and mutual-consultations. All eligible studies should meet the
following criteria: 1) observational studies (case–control,
cohort or cross-sectional study); 2) the exposure of inter-est was tea; 3) the outcome of interinter-est was the SUA level, the prevalence of HU and the risk of gout. The exclusion criteria were as follows: 1) duplicated or irrelevant articles; 2) reviews, letters, case reports or non-human studies; 3) inaccessibility of full-text.
Data extraction
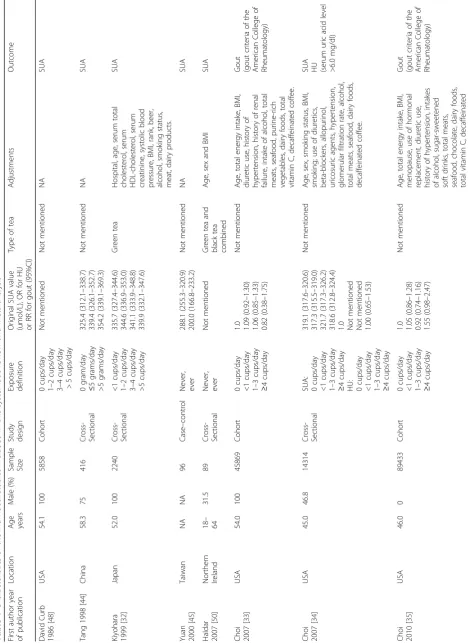
The available information and outcomes of each study were screened by the two researchers (YZ and GHL) independently. The data to be extracted were the first author, year of publication, location, age, gender, sample size, study design, exposure definition, original SUA value, OR for HU or RR for gout, type of tea, adjust-ments and outcomes. The primary outcome of interest was the difference in SUA concentration between the highest and the lowest category of tea consumption. The secondary outcome of interest was the odds ratio (OR) for the prevalence of HU and the relative risk (RR) for the risk of gout, for the highest versus the lowest category of tea consumption.
Quality assessment
The methodological quality of included studies was evaluated in accordance with the Newcastle-Ottawa Scale (NOS) [40], which is developed for assessing the quality of non-randomised studies based on three broad perspectives: the selection of study groups; the compar-ability among different groups; and the ascertainment of either the exposure or outcome of interest. Disagree-ments with respect to the methodological quality of results, if any, were resolved by discussion and mutual-consultation.
Statistical analyses
The outcome measures investigated in this meta-analysis were the SUA level and OR for the prevalence of HU. The weighted mean difference (WMD) and its corre-sponding 95% confidence interval (CI) for SUA were cal-culated respectively. The pooled OR of HU and its related 95%CI were also calculated. However, the pooled RR of gout and its related 95%CI were not calculated due to the limited number of studies (only two). Hence, their findings [33, 35] were simply reported in this re-sult, respectively. The most multivariable adjusted OR values reported in the original study were extracted for calculation if more than one was reported. The homogen-eity of effect size across trials was tested by Q statistics (p <0.05 was considered heterogeneous). The random
ef-fect models were used for all the analysis. The I2statistic,
which measures the percentage of the total variation across studies due to heterogeneity, was also examined
(I2< 25% was considered low heterogeneity, I2around 50%
considered high heterogeneity). Begg’s tests were per-formed to assess the publication bias [41], and statistical analyses were performed using STATA version 11.0 (Stata-Corp LP, College Station, Texas). A p value equal to or less than 0.05 was considered to be statistically significant, unless otherwise specified.
Results
Literature search and study characteristics
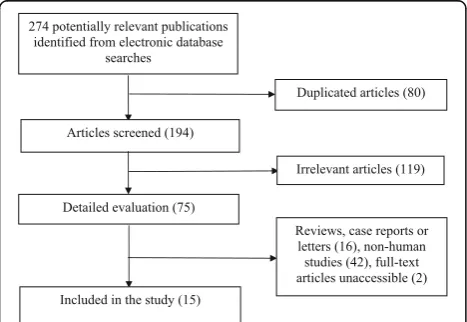
The flow chart for the identification of the included studies was presented in Fig. 1. A total of two hundred and seventy four potentially relevant publications were retrieved during the initial literature search. After elim-inating eighty duplicated articles, one hundred and ninety four articles were identified for detailed evalu-ation. One hundred and nineteen studies were excluded initially. Then, sixteen reviews, case reports or letters, forty two non-human studies, and two articles without full-text accessibility were removed [42, 43]. All of the excluded articles are listed in Additional file 2.
Eventu-ally, ten cross-sectional, one case–control and four
co-hort studies were included in this systematic review and meta-analysis. Eleven, five and two studies were related to the associations of tea consumption with the SUA level, HU and the risk of gout, respectively. Table 1 sum-marizes the main characteristics of these fifteen included studies. The methodological qualities of these studies were shown in Additional file 3: Table S1 (cross-sec-tional study), Table S2 (cohort study) and Table S3
(case–control study).
Weighted mean difference of SUA concentration between the highest and the lowest tea intake category
Seven studies including five cross-sectional, one cohort and
one case–control studies, reported the SUA concentration
in different tea intake categories [32, 34, 36, 37, 44–46].
They originated from USA, China (two studies), Taiwan,
Japan, Korea and Singapore. At the level of study setting, six population-based and one hospital-based studies were included. Since Tian only provides baseline and five year follow-up SUA level in tea consumers and non-tea con-sumers, the baseline data was extracted into this meta-analysis [46]. The combined WMD suggested that there was no significant difference in SUA between the highest
and the lowest tea intake category (WMD = 7.41 μmol/L,
95%CI:−2.34 to 17.15;P =0.136) (Fig. 2). A substantial level
of heterogeneity was observed among studies (P <0.001,
I2= 93%). No evidence of publication bias was observed
among the included studies according to the Begg
rank-correlation test (P =0.917). Since Yuan’s study [45] has a
relatively small weighting and seems like a considerable outlier (two thirds of participants were HU or gout pa-tients), a sensitivity analysis was conducted. The results showed that there was a moderately increase in the SUA level for the highest versus the lowest tea intake category
(WMD = 10.08μmol/L, 95%CI: 0.79 to 19.38;P =0.033). A
substantial level of heterogeneity was observed among
stud-ies (P <0.001, I2= 92%). No evidence of publication bias
was observed among the included studies according to the
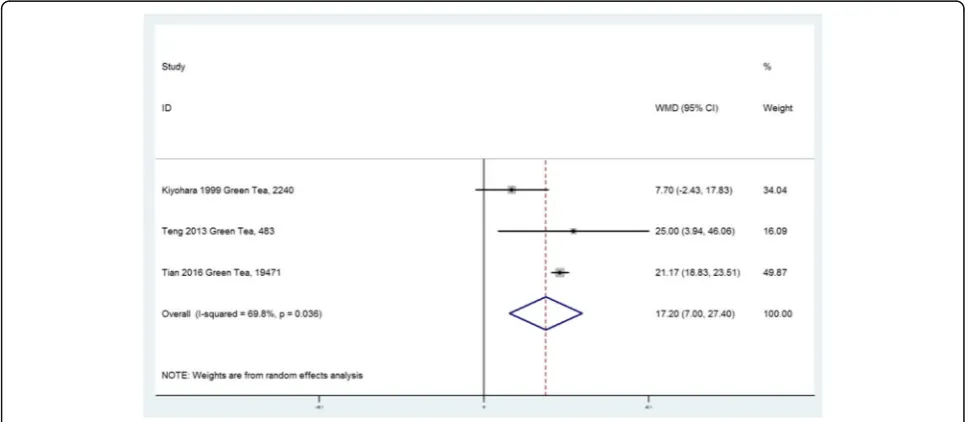
Begg rank-correlation test (P =0.536). Three studies were
included in a subgroup analysis for green tea. The com-bined WMD suggested that green tea consumption was positively associated with the SUA level (WMD =
17.20 μmol/L, 95%CI: 7.00 to 27.40; P =0.01) (Fig. 3). A
substantial level of heterogeneity was observed among
studies (P =0.036, I2= 70%). No evidence of publication
bias was observed among the included studies according
to the Begg rank-correlation test (P =1.00). It is necessary
to emphasize that there were four studies with inappropri-ate data for meta-analysis. Chang [47], Curb [48] and Chatzistamatiou [49] only reported the correlation coeffi-cient between tea and the SUA level. In addition, the rela-tive data was not showed in Haldar [50]. Chang and Haldar found that tea consumption was positively associated with the SUA concentration; while Curb and Chatzistamatiou reported a negative relationship between the two.
Odds ratio of HU for the highest versus the lowest tea intake category
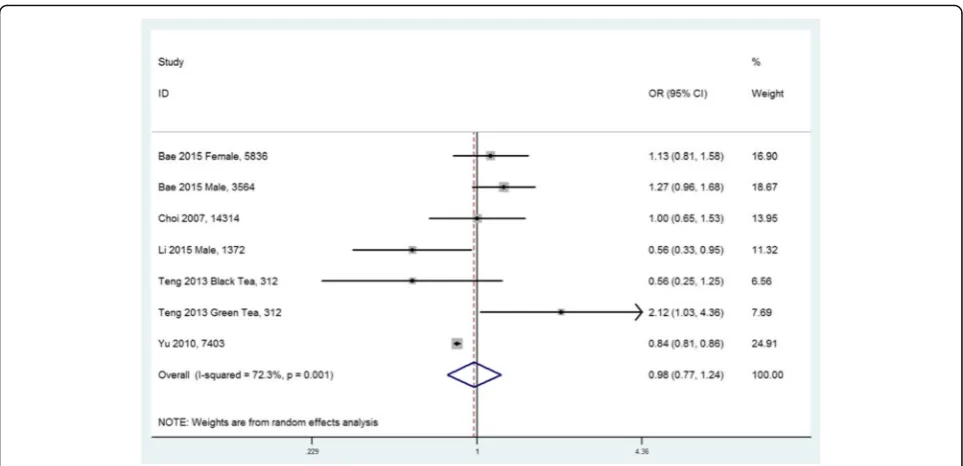
Five cross-sectional studies reported the OR for the
prevalence of HU [34, 36–38, 51]. They were all
com-munity population-based studies which originated from USA, China (two studies), Korea and Singapore. The overall multi-variable adjusted OR for the highest versus the lowest category of tea intake showed no significant
difference (OR = 0.98, 95%CI: 0.77 to 1.24, P =0.839)
(Fig. 4). A substantial level of heterogeneity was
observed among studies (P =0.001, I2= 72%). No
evidence of publication bias was observed among the included studies according to the Begg rank-correlation
test (P =1.00).
[image:3.595.57.291.550.711.2]Table 1 Characteristics of the individual studies included in this systematic review and met a-analysis First autho r year of pub lication Location Age years Male (%) Sam ple Si ze Stud y desig n Exposu re definit ion O riginal SUA value (u mol/L), OR for HU or RR for gout (95%C I) Type of tea Adj ustment s Outcome David Cur b 1986 [ 48 ] USA 54.1 100 58 58 Coho rt 0 cups /day 1 – 2 cups /day 3 – 4 cups /day > 5 cups /day Not mentio ned Not menti oned NA SUA Tang 1998 [ 44 ] China 58.3 75 41 6 Cross -Sec tional 0 gram/d ay ≤ 5 grams/day >5 gram s/day 32 5.4 (312. 1 – 338.7) 33 9.4 (326. 1 – 352.7) 35 4.2 (339. 1 – 369.3) Not menti oned NA SUA Kiyoh ara 1999 [ 32 ] Japan 52.0 100 22 40 Cross -Sec tional <1 cu ps/day 1 – 2 cups /day 3 – 4 cups /day >5 cu ps/day 33 5.7 (327. 4 – 344.6) 34 4.6 (336. 9 – 353.0) 34 1.1 (333. 9 – 348.8) 33 9.9 (332. 1 – 347.6) Green te a Ho spital, age , serum tot al chol estero l, serum HDL-c holest erol , serum creat inine, systolic blood pre ssure, BMI, rank, beer, alco hol, sm oking status, me at, dai ry produc ts. SUA Yuan 2000 [ 45 ] Taiwan NA NA 96 Cas e – contro l Never, ever 28 8.1 (255. 3 – 320.9) 20 0.0 (166. 8 – 233.2) Not menti oned NA SUA Haldar 2007 [ 50 ] Norther n Ireland 18 – 64 31.5 89 Cross -Sec tional Never, ever Not mentio ned Green te a and black tea combi ned Age , sex and BM I SUA Choi 2007 [ 33 ] USA 54.0 100 45 869 Coho rt 0 cups /day <1 cu ps/day 1 – 3 cups /day ≥ 4 cups/day 1. 0 1. 09 (0.92 – 1.30) 1. 06 (0.85 – 1.33) 0. 82 (0.38 – 1.75) Not menti oned Age , total ene rgy intake, BMI, diure tic use, history of hyp ertension , history of renal failu re, intake of alcoh ol, total me ats, seaf ood, pur ine-rich veg etables , dairy food s, total vitamin C, decaffeinat ed coffee. Gout (gout criteria o f the Ameri can Colleg e of Rheum atology ) Choi 2007 [ 34 ] USA 45.0 46.8 14 314 Cross -Sec tional
SUA: 0cups
/day <1 cu ps/day 1 – 3 cups /day ≥ 4 cups/day
HU: 0cups
/day <1 cu ps/day 1 – 3 cups /day ≥ 4 cups/day 31 9.1 (317. 6 – 320.6) 31 7.3 (315. 5 – 319.0) 32 1.7 (317. 3 – 326.2) 31 8.6 (312. 8 – 324.4) 1. 0 Not mentio ned Not mentio ned 1. 00 (0.65 – 1.53) Not menti oned Age , sex, sm oking status, BMI, sm oking; use of diu retics, be ta-block ers, all opurino l, uri cosuri c agents , hyperte nsion, glom erular filt ration rate, alco hol, tot al meat s, seafood , dairy food s, de caffeinated coffee .
SUA HU (serum
[image:4.595.63.532.89.733.2]Table 1 Characteristics of the individual studies included in this systematic review and met a-analysis (Continued) Yu 2010 [ 51 ] China 40.2 48.4 74 03 Cross -Sec tional Never, ever 1. 0 0. 84 (0.82 – 0.86) Not menti oned NA HU (serum uri c acid >7.0 mg/dl in males and >6.0 mg /dl in female s) Chang 2012 [ 47 ] Taiwan 75 100 36 1 Cross -Sec tional Never, ever Not mentio ned Not menti oned NA SUA Teng 2013 [ 36 ] Singapore 57.6 44.3 48 3 Cross -Sec tional SUA (Green tea): Non-d rinkers, Month ly drinke rs, Weekl y drinkers, Daily drinke rs. SUA (Black tea) : Non-d rinkers, Month ly drinke rs, Weekl y drinkers, Daily drinke rs. HU (Gre en tea): Non-d rinkers, Month ly drinke rs, Weekl y drinkers, Daily drinke rs. HU (B lack tea): Non-d rinkers, Month ly drinke rs, Weekl y drinkers, Daily drinke rs. 30 9.5 (298. 4-32 1.0) 30 9.5 (290. 4 – 329.9) 31 1.6 (296. 3 – 327.7) 33 4.5 (316. 2 – 353.9) 31 2.4 (301. 4 – 323.8) 30 8.8 (289. 0 – 329.9) 31 4.3 (298. 6 – 330.7) 31 8.4 (299. 6 – 338.4) 1. 0 0. 84 (0.36 – 1.98) 1. 15 (0.62 – 2.14) 2. 12 (1.03 – 4.36) 1. 0 0. 68 (0.28 – 1.67) 1. 27 (0.68 – 2.37) 0. 56 (0.25 – 1.27) Green te a, black tea Cho lesterol , creatinine, HbA1 c, trigl ycerides, age , gen der, BM I, ed ucation , cigarette smokin g statu s, physical activ ity st atus, hyp ertension at baseline, dai ry produ cts, red meat , fish, alco hol, soda, fruit juic e.
SUA HU (serum
uri c acid level >6 mg /dl) Chat zistamatiou 2015 [ 49 ] Greece 51 53 66 0 Cross -Sec tional Never, ever Not mentio ned Not menti oned NA HU (serum uri c acid >7.2 mg/dl in males and >6.1 mg /dl in fem ales) Bae 2015 [ 37 ] Korea 61.9 37.9 94 00 Cross -Sec tional SUA (Male): <0.1 ml/day, 0.1 – 8.0 ml /day, 8.1 – 51.4 ml/da y, ≥ 51 .5 ml /day; SUA (Femal e): <0.1 ml/day, 0.1 – 8.0 ml /day, 8.1 – 51.4 ml/da y, ≥ 51 .5 ml /day; HU (Mal e): <0.1 ml/day, 0.1 – 4.0 ml /day, 4.1 – 25.7 ml/da y, ≥ 51 .5 ml /day; HU (Fe male): <0.1 ml/day, 34 5.0 (340. 9-34 9.1) 33 6.9 (328. 6 – 345.8) 33 8.7 (332. 1 – 344.0) 34 8.1 (341. 5 – 354.7) 26 0.6 (258. 2 – 263.0) 26 2.0 (254. 8 – 269.0) 26 1.3 (257. 7 – 264.9) 26 3.6 (259. 4 – 267.8) 1. 0 0. 92 (0.66 – 1.28) 0. 95 (0.73 – 1.22) 1. 27 (0.96 – 1.67) 1. 0 0. 97 (0.66 – 1.42) 0. 84 (0.62 – 1.14) 1. 13 (0.81 – 1.59) Not menti oned Age , education, mar ital status, cigare tte smo king, alco hol drinki ng, reg ular exercis e, BMI, tri glyceride, fasting serum gluc ose , hyperte nsion medi cation, glom erular filt ration rate, tot al ene rgy, vitamin c, me at inta ke, seaf ood intake, dai ry food inta ke, soft drink inta ke, add ed sug ar in coffee, added cream in coff ee.
SUA HU (serum
Table
1
Characteristics
of
the
individual
studies
included
in
this
systematic
review
and
met
a-analysis
(Continued)
0.1
–
4.0
ml
/day,
4.1
–
25.7
ml/da
y,
≥
51
.5
ml
/day;
Li 2015
[
38
]
China
37.7
52.5
13
72
Cross
-section
al
<1
ti
me/wee
k
1
–
6
time
s/week
≥
6
times/we
ek
1.
0
0.
74
(0.47
–
1.17)
0.
56
(0.33
–
0.93)
Not
menti
oned
Age
,
smo
king
an
d
drinki
ng
status
HU (SUA
>41
6
μ
mol
/L
in
mal
es
and
>35
7
μ
mol
/L
in
fem
ales)
Tian 2016
[
46
]
China
63
44.1
19
471
Coho
rt
study
Never, ever
28
0.0
(278.
6
–
281.3)
30
1.1
(299.
2
–
303.0)
Green
te
a
Age
,
sex,
BM
I,
ed
ucat
ion,
smo
king
statu
s,
alcoho
l,
drinking
statu
s,
phy
sical
activ
ity,
hyperte
nsion
statu
s,
hyperlipidem
ia
statu
s,
dia
betes
status
an
d
family
history
of
CHD
Relative risk of gout for the highest versus the lowest tea intake category
Only two prospective cohort studies reported the RR for the risk of gout [33, 35]. They were both community population-based studies which originated from USA. Their results showed that tea consumption does not seem to be associated with the risk of gout in males (RR = 0.82, 95%CI: 0.38 to 1.75) and females (RR = 1.55, 95%CI: 0.98 to 2.47), respectively.
Discussion
A total of fifteen studies were included in this systematic review and meta-analysis. Nine studies were retrieved to examine the associations of tea consumption with the SUA level and HU in meta-analysis. The quantitative synthesis of these observational studies showed that there was no significant relationship between tea con-sumption and the SUA level or HU. However, green tea consumption might be positively associated with the
Fig. 2Forest plot of meta-analysis: WMD of SUA concentration between the highest and the lowest tea intake category
[image:7.595.57.542.87.317.2] [image:7.595.56.541.504.715.2]SUA level. In addition, two prospective cohort studies showed that tea consumption was not associated with the risk of gout.
Recently, a meta-analysis including five randomized controlled trials aimed to explore the influence of tea or tea extracts on the SUA level [52]. Unfortunately, due to the limited number of included studies and the lack of data on bioavailability (bioavailability is the proportion of the dose of a drug that reaches the systemic circula-tion intact after administracircula-tion by a route other than intravenous), it failed to clarify any effective influence. However tea extracts could increase the SUA level in normal subjects but decrease that in HU patients [52]. This interesting phenomenon could be due to the dual effects of polyphenols on the SUA level. Polyphenols could decrease the production and increase the
excre-tion of uric acid (UA) [53–55], but may also prevent
oxi-dation [33–35] (UA is an antioxidant). Further studies
are therefore needed to elaborate these issues.
Although green tea and black tea are both derived from Camellia sinensis, they are processed differently. In the manufacturing process of green tea, fresh tea leaves are steamed or heated immediately after harvest and re-sult in minimal oxidation of polyphenols. Therefore, the major polyphenols in green tea are epigallocatechin gall-ate (EGCG). On the contrary, in the manufacturing process of black tea, tea leaves are dried and crushed to enhance oxidation, which generates more kinds of poly-phenols (e.g. theaflavins and thearubigens) [52]. Some experimental studies reported the effect of green tea ex-tracts in decreasing the SUA level in rat or mice. Jung
[29] and Meki [30] showed that green tea extracts could reduce the SUA level in metabolic syndrome and rheumatoid arthritis rat models. In addition, Chen [31] further confirmed that green tea polyphenols could lower the SUA level in mice with HU by decreasing UA production and enhancing UA excretion. Therefore, green tea consumption might be negatively associated with the SUA level, HU and the risk of gout. Although the combined WMD suggested that there was no signifi-cant relationship between tea consumption and the SUA level, the majority of WMD values actually showed an increase in SUA level for tea group. Moreover, a
sensitiv-ity analysis excluding Yuan’s study [45], showed that tea
consumption was even moderately positively associated with the SUA level. Therefore, we speculate some var-ieties of tea might increase the SUA level. Since only one study specified the varieties of tea (green tea, black tea) [36] and two studies investigated the green tea specially [32, 46], a subgroup analysis (three studies) for green tea was conducted. Surprisingly, their results showed that green tea consumption was positively associated with the SUA level. For this obvious contradiction between experimental and epidemiological studies, several specu-lations were listed as follow. To begin with, the reliability of this results might be weaken since only three studies were included for subgroup analysis. Besides, the green tea extracts or polyphenols might decrease the SUA level in animal model rather than in human beings. Further-more, the components in green tea were complicated and some neglected substance might increase the SUA level, which ran counter to the effect of polyphenols.
[image:8.595.57.539.86.319.2]Finally, polyphenols might has a dual effect on the SUA level which depends on the SUA level itself. In another word, tea extracts could increase the SUA level in normal subjects but decrease that in HU patients [52], which might partly account for the difference in WMD which occurred as a result of the sensitivity analysis. Neverthe-less, we did not find any associations of tea consumption with HU or the risk of gout. More well-designed studies with classification of different tea varieties are needed.
The strengths of the present systematic review and meta-analysis are mainly reflected from the following as-pects. First, this is the first systematic review and meta-analysis aiming at the associations of tea consumption with the SUA level, HU and the risk of gout based on the most comprehensive literature search to date. Sec-ond, the included studies were analyzed based on ad-justed results and large samples. Third, this study reveals the potential contradiction between experimental and epidemiological studies for green tea. Limitations of the present study should also be acknowledged. Firstly, the substantial level of heterogeneity among various studies might have distorted the results of this meta-analysis. Secondly, due to the limitation of relevant literature, only a few studies were qualified for this meta-analysis. Thirdly, it is difficult to evaluate the classification of tea intake. Tea consumption was mostly assessed by the number of cups of daily intake, but the concentration of each variety of tea and the cup size could vary greatly among individuals. Fourthly, the definitions of outcome and the selection of adjusted factors were not uniform. Last but not the least, since only a small number of studies specified the varieties of tea, some issues could not be addressed. These limitations might weaken the strength of this study.
Conclusion
In conclusion, the current evidences suggest that tea con-sumption does not seem to be associated with the SUA level, HU and the risk of gout. However, due to the limited number of studies, green tea consumption might be posi-tively associated with the SUA level. More well-designed prospective cohort studies, which classify the varieties of tea, are needed to elaborate these issues further.
Additional files
Additional file 1:Search string. (DOCX 89 kb)
Additional file 2:Excluded articles. (DOCX 14 kb)
Additional file 3: Table S1.The methodological quality of
cross-sectional studies in accordance with the Newcastle-Ottawa Scale (NOS).
Table S2. The methodological quality of cohort studies in accordance with the Newcastle-Ottawa Scale (NOS).Table S3. The methodological quality of case–control studies in accordance with the Newcastle-Ottawa Scale (NOS). (DOCX 19 kb)
Abbreviations
CI:Confidence interval; ECCG: Epigallocatechin gallate; HU: Hyperuricemia; OR: Odds ratio; RR: Relative risk; SUA: Serum uric acid; UA: Uric acid; WMD: Weighted mean difference
Acknowledgements
None.
Funding
This work was supported by the National Natural Science Foundation of China (No. 81272034, 81472130, 81401838, 81402224, 81501923, 81672225, 81601941), the Scientific Research Project of the Development and Reform Commission of Hunan Province ([2013]1199), the Scientific Research Project of Science and Technology Office of Hunan Province (2013SK2018), the Key Research and Development Program of Hunan Province (2016JC2038), the Xiangya Clinical Big Data System Construction Project of Central South University (No.45) and the Clinical Scientific Research Foundation of Xiangya Hospital, Central South University (2015 L03).
Availability of data and materials
The datasets supporting the conclusions of this article are included within the article.
Authors’contributions
YZ, GHL conceived the study objective and participated in the study design. YC, XAL, LJL and CZ coordinated the data collection. XX, YZH and YHD performed the statistical analysis and interpreted the results. All authors helped to outline the manuscript. YZ, YC and GHL drafted the manuscript. All authors read and approved the final version.
Competing interests
The authors declare that they have no competing interests.
Consent for publication
Not applicable.
Ethics approval and consent to participate
Not applicable.
Author details
1Department of Orthopaedics, Xiangya Hospital, Central South University, No.87 Xiangya Road, Changsha, Hunan Province 410008, China.2Department of International Medical Service, Xiangya Hospital, Central South University, Changsha, Hunan Province 410008, China.
Received: 5 October 2016 Accepted: 21 February 2017
References
1. Liu H, et al. Prevalence of hyperuricemia among Chinese adults: a national cross-sectional survey using multistage, stratified sampling. J Nephrol. 2014; 27(6):653–8.
2. Trifiro G, et al. Epidemiology of gout and hyperuricaemia in Italy during the years 2005–2009: a nationwide population-based study. Ann Rheum Dis. 2013;72(5):694–700.
3. Wallace KL, et al. Increasing prevalence of gout and hyperuricemia over 10 years among older adults in a managed care population. J Rheumatol. 2004;31(8):1582–7.
4. Zhu Y, Pandya BJ, Choi HK. Prevalence of gout and hyperuricemia in the US general population: the national health and nutrition examination survey 2007–2008. Arthritis Rheum. 2011;63(10):3136–41.
5. Roddy E, Doherty M. Epidemiology of gout. Arthritis Res Ther. 2010; 12(6):223.
6. Miao Z, et al. Dietary and lifestyle changes associated with high prevalence of hyperuricemia and gout in the Shandong coastal cities of Eastern China. J Rheumatol. 2008;35(9):1859–64.
7. Nagahama K, et al. Hyperuricemia and cardiovascular risk factor clustering in a screened cohort in Okinawa. Japan Hypertens Res. 2004;27(4):227–33. 8. Lin SD, Tsai DH, Hsu SR. Association between serum uric acid level and
9. Uaratanawong S, et al. Prevalence of hyperuricemia in Bangkok population. Clin Rheumatol. 2011;30(7):887–93.
10. Grayson PC, et al. Hyperuricemia and incident hypertension: a systematic review and meta-analysis. Arthritis Care Res (Hoboken). 2011;63(1):102–10. 11. Li M, et al. Hyperuricemia and the risk for coronary heart disease morbidity
and mortality a systematic review and dose–response meta-analysis. Sci Rep. 2016;6:19520.
12. Sluijs I, et al. Plasma uric acid is associated with increased risk of type 2 diabetes independent of diet and metabolic risk factors. J Nutr. 2013;143(1):80–5. 13. Filiopoulos V, Hadjiyannakos D, Vlassopoulos D. New insights into uric acid
effects on the progression and prognosis of chronic kidney disease. Ren Fail. 2012;34(4):510–20.
14. Choi HK, Mount DB, Reginato AM. Pathogenesis of gout. Ann Intern Med. 2005;143(7):499–516.
15. Loeb JN. The influence of temperature on the solubility of monosodium urate. Arthritis Rheum. 1972;15(2):189–92.
16. Martinon F, et al. Gout-associated uric acid crystals activate the NALP3 inflammasome. Nature. 2006;440(7081):237–41.
17. Dalbeth N, et al. Cellular characterization of the gouty tophus: a quantitative analysis. Arthritis Rheum. 2010;62(5):1549–56.
18. Aune D, Norat T, Vatten LJ. Body mass index and the risk of gout: a systematic review and dose–response meta-analysis of prospective studies. Eur J Nutr. 2014;53(8):1591–601.
19. McAdams-DeMarco MA, et al. Hypertension and the risk of incident gout in a population-based study: the atherosclerosis risk in communities cohort. J Clin Hypertens (Greenwich). 2012;14(10):675–9.
20. Choi HK, et al. Alcohol intake and risk of incident gout in men: a prospective study. Lancet. 2004;363(9417):1277–81.
21. Zhang Y, et al. Purine-rich foods intake and recurrent gout attacks. Ann Rheum Dis. 2012;71(9):1448–53.
22. Zhang W, et al. EULAR evidence based recommendations for gout. Part II: management. Report of a task force of the EULAR standing committee for international clinical studies including therapeutics (ESCISIT). Ann Rheum Dis. 2006;65(10):1312–24.
23. Khanna D, et al. American College of Rheumatology guidelines for management of gout. Part 1: systematic nonpharmacologic and pharmacologic therapeutic approaches to hyperuricemia. Arthritis Care Res (Hoboken). 2012;64(10):1431–46.
24. Ma S, et al. Association of tea consumption and the risk of thyroid cancer: a meta-analysis. Int J Clin Exp Med. 2015;8(8):14345–51.
25. Grosso G, et al. Coffee, tea, caffeine and risk of depression: A systematic review and dose–response meta-analysis of observational studies. Mol Nutr Food Res. 2016;60(1):223–34.
26. Yan A, et al. Does tea consumption correlate to risk of fracture? A meta-analysis. Int J Clin Exp Med. 2015;8(6):8347–57.
27. Qi H, Li S. Dose–response meta-analysis on coffee, tea and caffeine consumption with risk of Parkinson’s disease. Geriatr Gerontol Int. 2014;14(2):430–9. 28. Pang J, et al. Green tea consumption and risk of cardiovascular and
ischemic related diseases: A meta-analysis. Int J Cardiol. 2016;202:967–74. 29. Jung MH, et al. Effect of green tea extract microencapsulation on
hypertriglyceridemia and cardiovascular tissues in high fructose-fed rats. Nutr Res Pract. 2013;7(5):366–72.
30. Meki AR, Hamed EA, Ezam KA. Effect of green tea extract and vitamin C on oxidant or antioxidant status of rheumatoid arthritis rat model. Indian J Clin Biochem. 2009;24(3):280–7.
31. Chen G, et al. Green tea polyphenols decreases uric acid level through xanthine oxidase and renal urate transporters in hyperuricemic mice. J Ethnopharmacol. 2015;175:14–20.
32. Kiyohara C, et al. Inverse association between coffee drinking and serum uric acid concentrations in middle-aged Japanese males. Br J Nutr. 1999; 82(2):125–30.
33. Choi HK, Willett W, Curhan G. Coffee consumption and risk of incident gout in men: a prospective study. Arthritis Rheum. 2007;56(6):2049–55. 34. Choi HK, Curhan G. Coffee, tea, and caffeine consumption and serum uric
acid level: the third national health and nutrition examination survey. Arthritis Rheum. 2007;57(5):816–21.
35. Choi HK, Curhan G. Coffee consumption and risk of incident gout in women: the Nurses’Health Study. Am J Clin Nutr. 2010;92(4):922–7. 36. Teng GG, et al. Serum urate levels and consumption of common beverages
and alcohol among Chinese in Singapore. Arthritis Care Res (Hoboken). 2013;65(9):1432–40.
37. Bae J, et al. The effect of coffee, tea, and caffeine consumption on serum uric acid and the risk of hyperuricemia in Korean multi-rural communities cohort. Rheumatol Int. 2015;35(2):327–36.
38. Li X, et al. Relationship between hyperuricemia and dietary risk factors in Chinese adults: a cross-sectional study. Rheumatol Int. 2015;35(12):2079–89. 39. Liberati A, et al. The PRISMA statement for reporting systematic reviews and
meta-analyses of studies that evaluate healthcare interventions: explanation and elaboration. BMJ. 2009;339:b2700.
40. GA Wells, B.S.D.O., The Newcastle-Ottawa Scale (NOS) for assessing the quality of nonrandomized studies in meta-analyses. http://www.ohri.ca/ programs/clinical_epidemiology/oxford.asp, 2010. 50(4): p. 1088–101. 41. Begg CB, Mazumdar M. Operating characteristics of a rank correlation test
for publication bias. Biometrics. 1994;50(4):1088–101.
42. Tiktinskii OL, Bablumian I. [Therapeutic action of Java tea and field horsetail in uric acid diathesis]. Urol Nefrol (Mosk). 1983;(1):47–50.
43. DECAUX F, BOURSIER B. [Coffee, tea and cocoa in hyperuricemic patients]. Gaz Med Fr. 1963;70:1465–70.
44. Tang D, Xia B. Influence of dietary habits and body weight on blood uric acid in the elderly. Hunan Yi Ke Da Xue Xue Bao. 1998;23(5):447–9. 45. Yuan SC, et al. Effect of tea and coffee consumption on serum uric acid
levels by liquid-chromatographic and uricase methods. Bull Environ Contam Toxicol. 2000;65(3):300–6.
46. Tian C, et al. Green tea consumption is associated with reduced incident CHD and improved CHD-related biomarkers in the Dongfeng-Tongji cohort. Sci Rep. 2016;6:24353.
47. Chang CS, et al. Smoking, habitual tea drinking and metabolic syndrome in elderly men living in rural community: the Tianliao old people (TOP) study 02. PLoS One. 2012;7(6):e38874.
48. Curb JD, et al. Coffee, caffeine, and serum cholesterol in Japanese men in Hawaii. Am J Epidemiol. 1986;123(4):648–55.
49. Chatzistamatiou E, Moustakas I.B.V.D., M.M.V.P. G., Kallikazaros I. Dietary patterns in hyperuricemic hypertensives. J Hypertens. 2015;1(33):e505-6. 50. Haldar S, et al. Influence of habitual diet on antioxidant status: a study in a
population of vegetarians and omnivores. Eur J Clin Nutr. 2007;61(8):1011–22. 51. Yu JW, et al. Epidemiological study on hyperuricemia and gout in Foshan
areas, Guangdong province. Zhonghua Liu Xing Bing Xue Za Zhi. 2010; 31(8):860–2.
52. Peluso I, et al. Camellia sinensis in asymptomatic hyperuricemia: A meta-analysis of tea or tea extract effects on uric acid levels. Crit Rev Food Sci Nutr. 2017;57(2):391–8.
53. Roth M, Timmermann BN, Hagenbuch B. Interactions of green tea catechins with organic anion-transporting polypeptides. Drug Metab Dispos. 2011; 39(5):920–6.
54. Fuchikami H, et al. Effects of herbal extracts on the function of human organic anion-transporting polypeptide OATP-B. Drug Metab Dispos. 2006; 34(4):577–82.
55. Vaidyanathan JB, Walle T. Transport and metabolism of the tea flavonoid (−)-epicatechin by the human intestinal cell line Caco-2. Pharm Res. 2001; 18(10):1420–5.
• We accept pre-submission inquiries
• Our selector tool helps you to find the most relevant journal
• We provide round the clock customer support
• Convenient online submission
• Thorough peer review
• Inclusion in PubMed and all major indexing services
• Maximum visibility for your research
Submit your manuscript at www.biomedcentral.com/submit